Learn how we are working to transform how we use and produce energy.
Solar in Arizona, Hydrogen in Louisiana: Here’s Where Each State Should Look for Quick Climate Solutions
RMI analyzed 24 states under current climate policies to see where they could best slash emissions by 2030 and keep US goals on track.
Why we share this work for free
RMI is an independent nonprofit working to accelerate the clean energy transition. We publish research like this to inform decision-makers and drive real-world impact.
Our work is supported by philanthropy as well as partnerships, including fee-for-service engagements. This support makes it possible for us to share our independent insights for free.
If you find this work valuable, you can support it anytime.
Get more insights like this
Stay up to date with the latest research, analysis, and tools from RMI by opting in to receive occasional emails below. You’ll get new reports, event invitations, and practical insights to help us all accelerate the clean energy transition.
Loading form...
Your download should start automatically. If it doesn’t, click the download button below.
This work is made possible by philanthropy
RMI is a nonprofit supported by donors and partners. Philanthropy enables us to produce independent research and make resources like this freely available.
If you find this report valuable, please consider supporting our work. You can also explore how we partner with organizations to drive impact.
Jump to Section
Forty-six states are drawing up plans to cut their greenhouse gas (GHG) emissions to take advantage of a $5 billion provision in the Inflation Reduction Act (IRA) known as the Climate Pollution Reduction Grants (CPRG) program. In a separate article, RMI shows the best way for states to set ambitious, actionable, and achievable emissions reduction targets in such plans. But which strategies in each state can best help achieve these targets? After all, we know that there is no one-size-fits-all solution given states have diverse sources of emissions and policies enacted to date. Using the state Energy Policy Simulator (EPS), RMI has identified the top strategies to reduce emissions in the next decade for each state.
Exhibit 1
By focusing climate action plans and CPRG implementation grant applications on policies and actions that advance these strategies, states can maximize the impact of their plans and increase the likelihood of receiving implementation grant funding from the Environmental Protection Agency (EPA), which is administering these funds. And by targeting implementation grant awards to policies and actions that align with these top state priorities, EPA can maximize the impact of CPRG funds.
Each state has a unique set of priority strategies to pursue to cut emissions
Although some key solutions are generally effective across many states, each state has a unique set of priority strategies to target its own sources of emissions. This depends on the makeup of the state’s energy sector, such as the size of its gasoline vehicle fleet, the amount and type of energy consumed to heat and cool buildings, industrial manufacturing output, oil and gas extraction levels, and the number of fossil fuel plants powering the grid, as well as the policies already in place to reshape the future of the state’s energy sector.
The solutions also depend on the time frame of targeted emissions reductions. This analysis highlights the most effective strategies for rapidly cutting emissions in the near term, that is by 2030. Other solutions that require the turnover of a significant number of individual units, such as an electric vehicle (EV) sales standard, typically have a smaller impact in 2030 but a much larger impact in later years like 2040 and 2050.
RMI has found the top three strategies per state (Exhibit 2) leading to the most annual emissions reductions in 2030 by comparing 2030 emissions reductions for 24 states between the pre-loaded Nationally Determined Contribution (NDC) scenario and a Current Policy scenario. The NDC scenario includes a set of about 30 policies that, when implemented across all states, allows the United States to achieve 2030 and 2050 NDC goals. The Current Policy scenario represents all climate and energy policies that the state has enacted to date.
Exhibit 2
In Pennsylvania for example, large fossil fuel plants and the oil and gas industry are projected to constitute about 35 percent and 16 percent, respectively, of the state’s emissions in 2030 when taking into account current policies. Replacing these plants with clean resources and tackling oil and gas methane emissions have the greatest impact in the state.
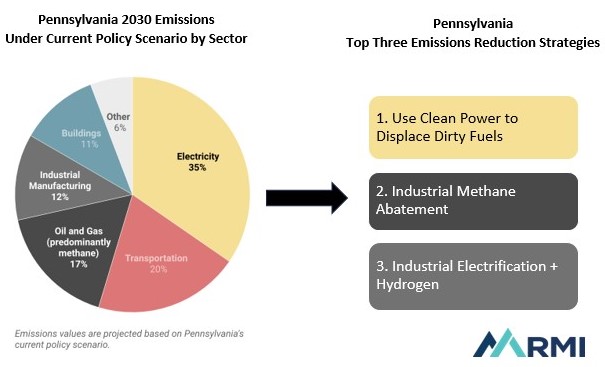
The good news is that federal programs exist to drive progress more easily, using programs such as the Energy Infrastructure Reinvestment Program and Methane Emissions Reduction Program from the IRA, and the Orphaned Wells Program from the Infrastructure and Investment Jobs Act.
Strategies focused on electricity and buildings rise to the top, following regional patterns
In this analysis, RMI finds that the most common single top strategy for states to cut emissions by 2030 is using clean power to replace dirty fuels. This requires accounting for new electricity load as more equipment is electrified, replacing existing fossil fuel assets with clean sources, interconnection reform, and transmission planning. Specific policies that could ultimately increase power generation from clean sources in states include:
- Integrating the IRA into utility resource planning. Regulators can take a variety of actions that will prompt utilities to harness IRA provisions in resource planning and procurement discussions, particularly the clean energy investment and production tax credits and the variety of adders that, if leveraged, further reduce the cost of clean resources. These actions should also ensure that IRA benefits are passed on to electricity customers.
- Refinancing fossil debt and using low-interest loans to invest in clean energy and infrastructure. Electricity generated from high-emitting fossil fuels is already uneconomic and becoming more so due to the declining costs of renewable energy, especially when considering the IRA’s clean energy incentives. Financing mechanisms such as the Energy Infrastructure Reinvestment loan program (EIR) — created by the IRA and authorized to distribute $250 billion in low-interest loans to support repurposing, retooling, restructuring, or replacing infrastructure in support of emission reductions — is available through 2026 and can further reduce the risks and costs associated with replacing these plants and investing in the grid.
- Establishing more ambitious clean electricity standards to provide market certainty and drive the transition to clean generation sources, as recently passed in Michigan’s House and Senate. Increasing clean electricity generation can both boost a state’s GDP and lower the cost of energy for customers.
- Streamlining the process for interconnection and transmission to be able to reliably build out the grid and transport clean electricity to demand centers on a climate-aligned timeline. This could include reforming the interconnection process, providing siting authority backstops, and addressing cost allocation issues.
The details of policy implementation will depend on whether a state has vertically integrated utilities or has restructured with competitive generation markets. In both cases, utility planning, replacing fossil fuel sources with clean sources, and improving interconnection and transmission are valuable tools for decarbonizing the grid.
Strategies that target the electrification and efficiency of appliances in buildings also have significant impact across a number of states. Policies that could accelerate the uptake of all-electric and efficient buildings and appliances include:
- Changing how utilities plan and invest in local infrastructure, with an eye toward reducing major reinvestments in the gas system, focusing instead on non-pipe alternative programs with electrification, energy efficiency, and thermal energy networks.
- Reforming electric and gas utility rate designs to ensure that when families electrify their homes, their energy bills are affordable and equitable.
- Adopting zero-emissions building energy codes that require new construction and major renovations to be all-electric by 2025. RMI’s analysis shows new construction is one of the lowest cost places to start with electrification, and there is strong policy leadership to learn from in Washington, California, New York, and hundreds of cities across the nation.
- Establishing whole-home electric retrofit programs that stack federal funds (CPRG Implementation Grants and home energy rebate programs) with state and utility funding to focus on low-income household upgrades, and environmental justice communities.
- Setting zero-emissions appliance standards for HVAC and water heating that go into effect by 2030.
Many of the states we analyzed can further reduce emissions by addressing industrial sector emissions, including manufacturing, as well as oil and gas. On the other hand, transportation policies such as an EV sales standard tend to be more impactful on the 2050 timeline, though there are some exceptions for states dominated by transportation sector emissions.
The analysis also finds that the top strategy across states follows regional patterns. In the Midwest, increasing clean power generation tends to rise to the top; in the Northeast, increased electrification and efficiency of building appliances is key; and in the South, clean electricity generation or fuel shifting to electrification and hydrogen for industrial facilities has the most impact on emissions. Regional patterns for the most impactful solutions can encourage collaboration on building cross-state infrastructure, such as transmission lines and green hydrogen transportation networks.
The strategies most crucial to cutting emissions also improve public health and boost economic growth
Implementing these top three new strategies can help states significantly boost jobs and public health benefits. New clean energy infrastructure means more manufacturing projects, such as those for solar panels, electric vehicle charging and batteries, and the retrofitting of existing buildings. And reducing pollution translates to cleaner air and water across the country, with associated health benefits, especially for communities living near large fossil fuel plants. RMI finds that if these 24 states are to implement this NDC scenario in addition to their current policies, the United States can gain over 2 million additional jobs and avoid almost 44 thousand asthma attacks in 2030.
Even if states only focus on their top three strategies, there are beneficial economic and health outcomes. These top strategies can also vary across sectors and still drive benefits. For example, Florida’s top opportunities are in the transportation sector, after power, and can gain nearly 150,000 jobs and avoid 5,000 incidents of asthma attacks in 2030 (roughly 6,500 and 200 per 1 million people respectively) by implementing its top three strategies. The avoided asthma attacks are particularly high compared to other states because of how clean vehicles improve air quality. Colorado, where industry comes out on top, sees benefits by prioritizing all three strategies. This is true also for Arkansas and Massachusetts where electricity and buildings lead respectively.
States should ensure that strategy design and implementation include meaningful community engagement to ensure they deliver benefits especially to low-income and disadvantaged communities through, for example, the Justice40 Initiative. This is important criteria for the CPRG Implementation Grant awards. They can do this by, for example, funding clean energy projects targeted at low-income communities, standing up strong buildings rebate programs from the IRA that provide additional discounts for low-income households, and emphasizing equitable access to EVs and EV charging infrastructure.
Some states are already making significant strides in reducing emissions
Of the 24 states analyzed, 21 have already passed policies that help reduce emissions in 2030. It’s worth celebrating the great climate progress states are already making, and identifying which strategies are contributing to this progress.
Many states will see the greatest progress from increasing clean power generation — this is not surprising given the relatively fast-moving nature of electricity sector transformation. Several states will see the most emissions reductions from building electrification and energy efficiency. Additional strategies that stand out for a handful of states include passing an EV sales standard, setting a carbon price, and driving down industrial methane.
Trying to understand what strategies to prioritize was overwhelming for states — until now
State governments working on clean energy and environmental policies have plenty on their plates right now. With the recent passage of the IRA and the Infrastructure Investment and Jobs Act as well as the climate crisis becoming ever more pressing, it can be hard to understand what the best solution is for their own economy. That’s why RMI has found the top strategies that these 24 states could prioritize to complement policies already on the books. States have an opportunity to include these strategies in their climate action plans through the CPRG program and benefit from near-term emissions reductions, a growth in jobs, and fewer negative public health outcomes.
This work was made possible by generous support from Bloomberg Philanthropies.
Methods
This analysis uses the state Energy Policy Simulator (EPS) models, which help states assess the environmental, economic, and health impacts of diverse state energy policies. State and federal decision-makers may freely use the EPS to set targets, explore solutions, and prioritize and quantify GHG-reducing measures within state plans.
In this analysis, we compare 2030 emissions reductions for 24 states between the pre-loaded Nationally Determined Contribution (NDC) scenario and a Current Policy scenario to identify the strategies that have the greatest potential to reduce emissions beyond current policy impacts. The NDC scenario includes a detailed set of about 30 policies that, when implemented across all states, allows the United States to achieve 2030 and 2050 NDC goals. The Current Policy scenario represents all climate and energy policies that the state has enacted to date. These 24 states were chosen to represent a diversity of geographic location, industries, and political makeup.
RMI has used these Current Policy scenarios to track state-level progress in meeting NDC-aligned climate targets, illustrated visually in the State Climate Scorecards. The scorecards demonstrate which states are leading the way in climate progress at the economywide, sector, and sub-sector level (technology and emissions sources within a sector). The policies leading to this progress documented here can show other states how to cut emissions effectively.
Note that the top strategies were determined by comparing the full NDC scenario to the full Current Policy scenario. Thus, the impact of the individual policies in isolation could be different than when taken as part of a scenario due to interactions between policies. Readers should consider how policies stack when it comes to emissions reductions. For example, ensuring growth in clean energy generation when electrifying end-use technologies.
To explore more solutions on the state or country level, visit the Energy Policy Simulator.
* This analysis only includes policies passed by July 2023.
Acknowledgements
The authors would like to acknowledge (listed alphabetically) Laila Atalla, Jacob Corvidae, Joseph Daniel, Ben Feshbach, Rachel Gold, Rachel Golden, Leia Guccione, Mike Henchen, Wendy Jaglom-Kurtz, David Smedick, and Gennelle Wilson for their valuable feedback and insights.


Related Insights

Help build the clean energy future. Donate today.
Independent research. Real-world solutions. Supported by donors.
RMI can pursue the highest-impact climate and energy solutions because we’re supported by people who believe change is possible. Every gift helps advance the work needed to make clean energy the default choice worldwide.
For other ways to give to RMI, including checks or gifts of stock, please visit Other Ways to Give.
