Learn how we are working to transform how we use and produce energy.
Hydrogen Reality Check: All “Clean Hydrogen” Is Not Equally Clean
Hydrogen’s overall emissions can vary substantially between and within each production pathway.
Why we share this work for free
RMI is an independent nonprofit working to accelerate the clean energy transition. We publish research like this to inform decision-makers and drive real-world impact.
Our work is supported by philanthropy as well as partnerships, including fee-for-service engagements. This support makes it possible for us to share our independent insights for free.
If you find this work valuable, you can support it anytime.
Get more insights like this
Stay up to date with the latest research, analysis, and tools from RMI by opting in to receive occasional emails below. You’ll get new reports, event invitations, and practical insights to help us all accelerate the clean energy transition.
Loading form...
Your download should start automatically. If it doesn’t, click the download button below.
This work is made possible by philanthropy
RMI is a nonprofit supported by donors and partners. Philanthropy enables us to produce independent research and make resources like this freely available.
If you find this report valuable, please consider supporting our work. You can also explore how we partner with organizations to drive impact.
Jump to Section
The Myth: The whole rainbow of hydrogen — from green to blue and beyond — can be considered “clean,” with the exception of producing grey, brown, or black hydrogen from fossil fuels. (For more, see “Clean Energy 101: The Colors of Hydrogen.”)
The Reality: Every form of hydrogen production has different emissions risks. Producing hydrogen from renewable electricity is the most straightforward way to ensure emissions are near zero, but all methods of production will require additional regulations to meet the mark. Supply chains must be strictly managed with a cradle-to-gate view on emissions to maximize hydrogen’s climate benefits.
The term “clean hydrogen” has no universally accepted definition. It has become a catchall term for nearly all low-carbon production pathways for hydrogen, but the term gets tossed around without any real clarity as to what “clean” means.
Broadly, “clean” hydrogen refers to any hydrogen produced with lower emissions than the incumbent fossil fuel-based methods. While there are many clean hydrogen production pathways often categorized by “colors,” we will use the two most common types to exemplify the main considerations:
- Green hydrogen: Hydrogen produced by splitting water molecules through electrolysis using renewable energy sources
- Blue hydrogen: Hydrogen produced from a natural gas feedstock with capture of the by-product carbon dioxide.
Both green and blue hydrogen are getting attention today for their carbon reduction benefits, but these pathways are not created equal. Furthermore, a simple color coding is insufficient to clarify the emissions of each production path. Depending on differences in the supply chain and technology performance, two supplies of hydrogen with the same “color” can have widely different carbon footprints, as seen in Exhibit 1. Understanding these differences requires visibility into the carbon intensity of the supply chain.
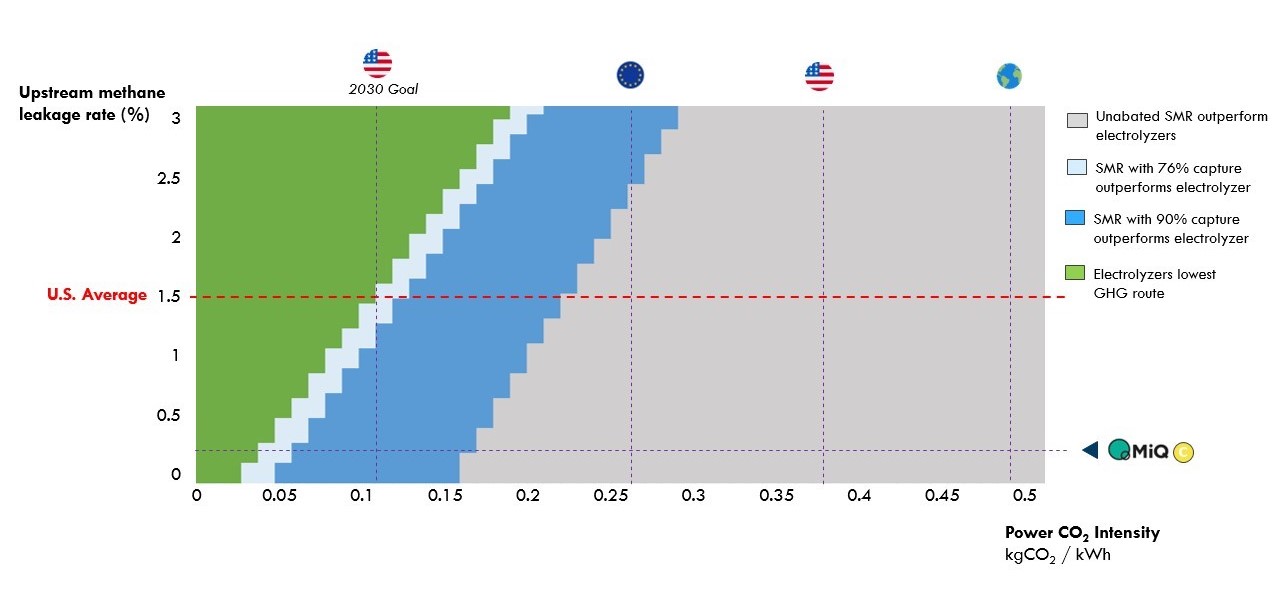
Exhibit 1: The carbon intensity of hydrogen varies widely, depending on the production method, methane leakage rates, and carbon capture rates for steam methane reforming (SMR) in the case of “blue” hydrogen derived from natural gas.
Note: Calculations assume a 100-year methane lifetime.
Taking into consideration the fundamental differences between clean hydrogen production pathways, developers, consumers, and policymakers must look to evaluate hydrogen’s carbon footprint quantitatively rather than relying on overly broad labels. Strategic decisions and actions informed by a more transparent hydrogen supply chain can minimize gigatons of carbon released. Hypothetically, if all hydrogen needed by 2050 had a green hydrogen emissions profile rather than a typical blue hydrogen emissions profile (4 kg CO2 per kg H2), 1.2 gigatons of CO2 each year would be saved. Those emissions savings amount to a cumulative 8 percent of the remaining global carbon budget for 1.5°C alignment. Conversely, scaling climate-incompatible assets will force a reliance on costly carbon removal technology in the future to reach net zero and meet global climate goals.
Let’s Get True on Blue
Any form of natural gas-based hydrogen production inherits a central challenge of the emissions-intensive oil and gas supply chain: methane leakage. Methane presents a significant near-term warming risk, with more than 80 times the warming potential of carbon dioxide on a 20-year time frame. Annual upstream methane leakage, largely due to venting from equipment and production processes, is highly variable. In the United States, leakage rates are estimated to be around 1.5 percent with recent aerial studies suggesting it may be as high as 9 percent in oil-heavy basins. At average US methane leakage rates, producing hydrogen from natural gas via steam methane reforming (SMR) will have cradle-to-gate emissions above 2.5 kg CO2 equivalent (CO2e) per kg of hydrogen, even if producers are somehow able to capture 100 percent of carbon dioxide emitted during production.
Carbon capture performance is another key determinant of blue hydrogen’s carbon footprint. With a methane leakage rate of 0.4 percent (equivalent to a “C” grade from the certification organization MiQ) and a ~60 percent capture rate — both beyond the performance of most US gas basins and capture processes today — SMR hydrogen production will emit ~4 kg CO2e per kg of hydrogen. Even with a 90 percent capture rate, this production pathway will emit ~2 kg CO2e per kg of hydrogen, as illustrated in Exhibit 2.
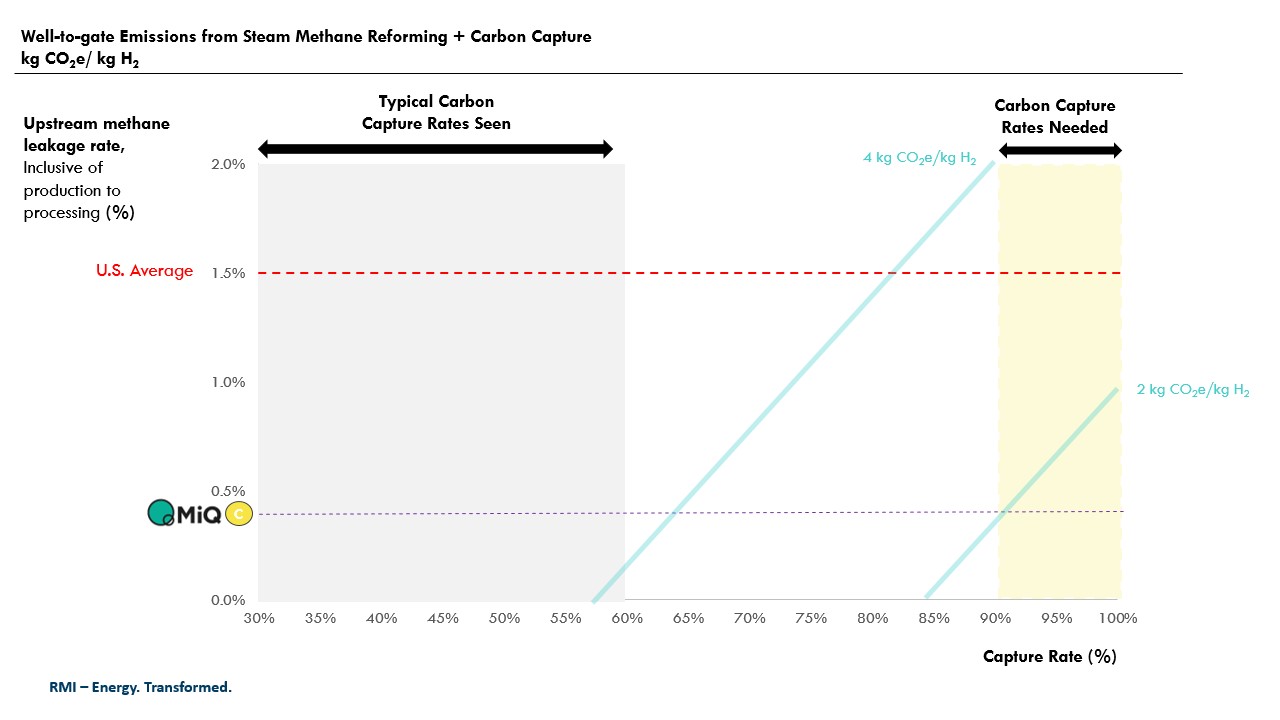
Exhibit 2: Cradle-to-gate emissions of steam methane reforming with various upstream methane leakage rates and carbon capture rates.
Note: Assumes US average grid carbon intensity of 0.38 kg CO2e per kWh and a 100-year methane lifetime. US average of 1.5% upstream methane leakage rate comes from RMI emissions modeling as part of the forthcoming Climate TRACE analysis, as of September 1st 2022.
Going Green
Hydrogen production via water electrolysis does not involve carbon: its inputs (electricity, water) and outputs (hydrogen, oxygen) are all carbon-free.
However, for electrolysis to produce no cradle-to-gate carbon emissions, its electricity must come from one of the following sources:
- Dedicated renewable power arrays, such as wind or solar farms
- A renewable-heavy electrical grid
Companies are pursuing both setups in projects today. For example, fertilizer producer Yara is building a green hydrogen plant in Norway with a dedicated wind array. Steelmaker H2 Green Steel is producing green hydrogen from the electric grid, which is dominated by hydroelectric power in their load zone and is therefore largely fossil-free.
Using renewable electricity will guarantee that hydrogen electrolysis is carbon-free for everything beyond the carbon embodied in the materials needed for power generation and electrolysis. But what happens to the emissions profile of hydrogen electrolysis when its electricity comes from a carbon-intensive grid? RMI analysis finds that green hydrogen produced on today’s fossil-heavy grid in Texas, for example, would have an average annual carbon intensity over 20 kg CO2 per kg H2. That would nearly double the emissions footprint of hydrogen made from natural gas with no carbon capture and storage (“grey” hydrogen).
Fortunately, the world’s electrical grids are quickly decarbonizing, with many expected to be low-carbon by the 2040s. Until then, it is necessary to provide certainty that grid-connected electrolysis is sufficiently low-carbon and materially contributes to grid decarbonization in the near term. Policymakers are tackling these considerations by stipulating that offsets must spur the build of additional carbon-free electricity rather than using existing sources. These regulations must consider the unique operational profile and location of the electrolyzer, as both will change the emissions of grid-connected electrolysis.
Managing Supply Chains
The rate of decarbonization and ultimate achievement of our climate goals depends on minimizing emissions across energy production supply chains. Policies today should aim to both catalyze market growth and maximize long-term climate benefits by investing in technologies compatible with our climate goals. Poorly designed policy could bring hydrogen development to a screeching halt, given practical supply chain constraints today, and could fundamentally risk scaling hydrogen in a manner that is incompatible with a net-zero economy.
Fixed assets, like carbon capture technology or electrolyzers, will remain in the market beyond 2040, so their performance needs to be aligned with what is required to reach net zero by mid-century. Specifically, this means that carbon capture rates should be above 95 percent for assets built in this decade to avoid costly retrofits in the future. Emissions from feedstocks, like upstream methane sources or grid-intensive electricity, should be regulated to promote the strictest emissions reductions, but they can also continue to decarbonize past the outlay of capital expenditure, providing opportunities for improvements throughout the lifetime of the project.
Specifically, a well-managed hydrogen market will require careful implementation of several considerations:
- Evaluate hydrogen production on a full cradle-to-gate emissions profile to promote consideration of emissions from the entire supply chain.
- Transition away from simple “color” designations and toward a metric of feedstock and carbon intensity.
- Promote capital investment only toward technologies compatible with or transitioning toward a net-zero economy, given the long lifetime of assets.
- Increase transparent reporting, measurement, and accountability of all supply chain emissions sources, with specific accounting guidance for each production pathway.
- Use and cohere with existing market-based mechanisms across the supply chain (i.e.,MiQ certification incentivizing methane leakage reduction, Guarantees of Origin for renewable electricity, and end-user certification schemes).
With decisions motivated by an understanding of hydrogen’s varied carbon footprint and the regulations required to ensure a low-to-no emissions supply chain, hydrogen’s climate benefit will be maximized.
Authors

Tessa Weiss
Manager
Thomas Koch Blank
Managing Director
Genevieve Lillis
Manager
Jardine Wall
Chathurika Gamage
Related Insights

Harnessing Green Demand to Drive Sustainable Chemicals Production

Help build the clean energy future. Donate today.
Independent research. Real-world solutions. Supported by donors.
RMI can pursue the highest-impact climate and energy solutions because we’re supported by people who believe change is possible. Every gift helps advance the work needed to make clean energy the default choice worldwide.
For other ways to give to RMI, including checks or gifts of stock, please visit Other Ways to Give.