Learn how we are working to transform how we use and produce energy.
Two Major Oil and Gas Emissions Trends Revealed by Climate TRACE This Year
A new data set of global emissions sources reveals priority areas of action to reduce the climate footprint of the oil and gas industry.
Why we share this work for free
RMI is an independent nonprofit working to accelerate the clean energy transition. We publish research like this to inform decision-makers and drive real-world impact.
Our work is supported by philanthropy as well as partnerships, including fee-for-service engagements. This support makes it possible for us to share our independent insights for free.
If you find this work valuable, you can support it anytime.
Get more insights like this
Stay up to date with the latest research, analysis, and tools from RMI by opting in to receive occasional emails below. You’ll get new reports, event invitations, and practical insights to help us all accelerate the clean energy transition.
Loading form...
Your download should start automatically. If it doesn’t, click the download button below.
This work is made possible by philanthropy
RMI is a nonprofit supported by donors and partners. Philanthropy enables us to produce independent research and make resources like this freely available.
If you find this report valuable, please consider supporting our work. You can also explore how we partner with organizations to drive impact.
Jump to Section
Many people already know that the emissions from fossil fuels pose a direct threat to meeting global climate targets, but fewer are aware of just how big the oil and gas industry’s role is in making or breaking our climate future. Taken together, the processes involved in extracting, transporting, and refining oil and gas all over the world account for nearly one in six tons of human-made greenhouse gases (GHGs) when accounting using a 20-year global warming potential (GWP). In 2021, these sectors totaled more than 11 billion tons of CO2e, more than the annual emissions of the United States.
Until recently, it has been difficult to pinpoint exactly where emissions are coming from, and which parts of the complex oil and gas supply chain are responsible for them. However, Climate TRACE’s latest global inventory of greenhouse gas emissions brings new data, covering every country and all emitting sectors of our global economy, plus over 70,000 of the highest-emitting facilities around the world. In the oil and gas sector specifically, RMI contributed data on more than 500 of the largest global oil and gas assets in 90 countries that together produce nearly all the world’s oil and gas.
Decision makers including global leaders at COP27, investors in and insurers of oil and gas assets, and companies looking to deliver on zero-carbon targets can leverage this enhanced emissions visibility to achieve GHG emissions reductions across the entire oil and gas supply chain in this decade.
Here are our main takeaways from the Climate TRACE GHG emissions inventory.
The Oil and Gas Industry Has an Outsize Opportunity to Cut Emissions, Especially Methane
Oil and gas products fan out to all global sectors in the form of both combusted and non-combusted products including jet fuel, gasoline, plastics, and other petrochemical products. This means there are billions of end-users of oil and gas worldwide. Reducing consumer demand for these products throughout the economy will take time.
Meanwhile, although the supply side is also complex, there are orders of magnitude fewer actors involved. Climate TRACE data makes it possible to identify supply-side entities that are responsible for large amounts of emissions. For example, if a single oil and gas field in Algeria (Hassi R’Mel) continues to emit more than the entire country of Ethiopia, it is evident that industry can and must do more to meet global climate targets.
Climate TRACE also shows that two-thirds of the industry’s climate damage comes from methane over its 12-year lifetime (Exhibit 1). The good news is that, once detected, many methane sources can be remedied with existing and affordable solutions. For example, making leaking pipes or malfunctioning equipment visible to operators so they can quickly rectify the problem can go a long way toward mitigating the methane impact of production and transport facilities.
 Note: 20-year GWP assumes that methane is 82.5 times more climate forcing than CO2.
Source: Climate TRACE
Leading companies are already taking steps to reduce emissions from their operations. For example, several gas companies are signing up to certify their gas production as a part of independent standards such as MiQ. By taking part in initiatives to evaluate their intensity and incorporate best practices like regularly deploying emissions monitoring technology, companies can demonstrate to the public, policymakers, and investors that they’re looking to reduce their emissions — and be rewarded for it in the market.
Emissions Intensity Matters Just as Much as Overall Emissions
The Climate TRACE platform allows users to view, rank, and compare facilities by total emissions, finding the highest emitters. High total emissions typically indicate that the facility operates at a high volume or has an above average climate intensity relative to other global assets (or both). Deeper inspection of Climate TRACE data allows user to sift out the producers that have higher intensity, thus enabling differentiation of oil and gas emissions.
The climate intensities of individual oils and gases globally can vary by a factor of 10 or more, driven by resource-specific factors. For example, the per-barrel intensity of an oil-producing field that burns (or “flares”) unwanted gas may be dominated by flaring-related combustion emissions or, worse, by methane emissions from inefficient and unlit flares. Meanwhile, a gas field’s intensity may be driven by methane leaks from equipment as gas is processed and transported.
At the country level, climate intensity shows which countries are producing the cleanest and dirtiest barrels. Exhibit 2 shows that some countries with large absolute emissions have below-average intensity (bottom right quadrant) in emissions per barrel of oil equivalent. These producers, including Saudi Arabia, the United States, and Qatar, are supplying global oil and gas demand with relatively low emissions damage compared with countries that have high emissions intensities (upper left and right quadrants).
Sources: Climate TRACE and RMI, Oil Climate Index plus Gas, https://ociplus.rmi.org/
From a climate standpoint, this enables prioritization. The high-volume, high-intensity resources in the top right quadrant are priority targets for businesses, investors, policymakers, and civil society to focus on for emissions reductions or decommissioning. Countries and facilities toward the bottom right can point toward a decarbonization pathway for the sector, demonstrating opportunities to lower emissions intensity during the transition toward a clean energy future.
Real Solutions to Drive Down Emissions
As we work to lessen global dependence on oil and gas, the reality is that this sector still generates a lot of emissions. After a temporary dip at the onset of the COVID-19 pandemic, emissions from oil and gas production, transport, and refining rebounded more than five percent in 2021 from 2020 levels (Exhibit 3).
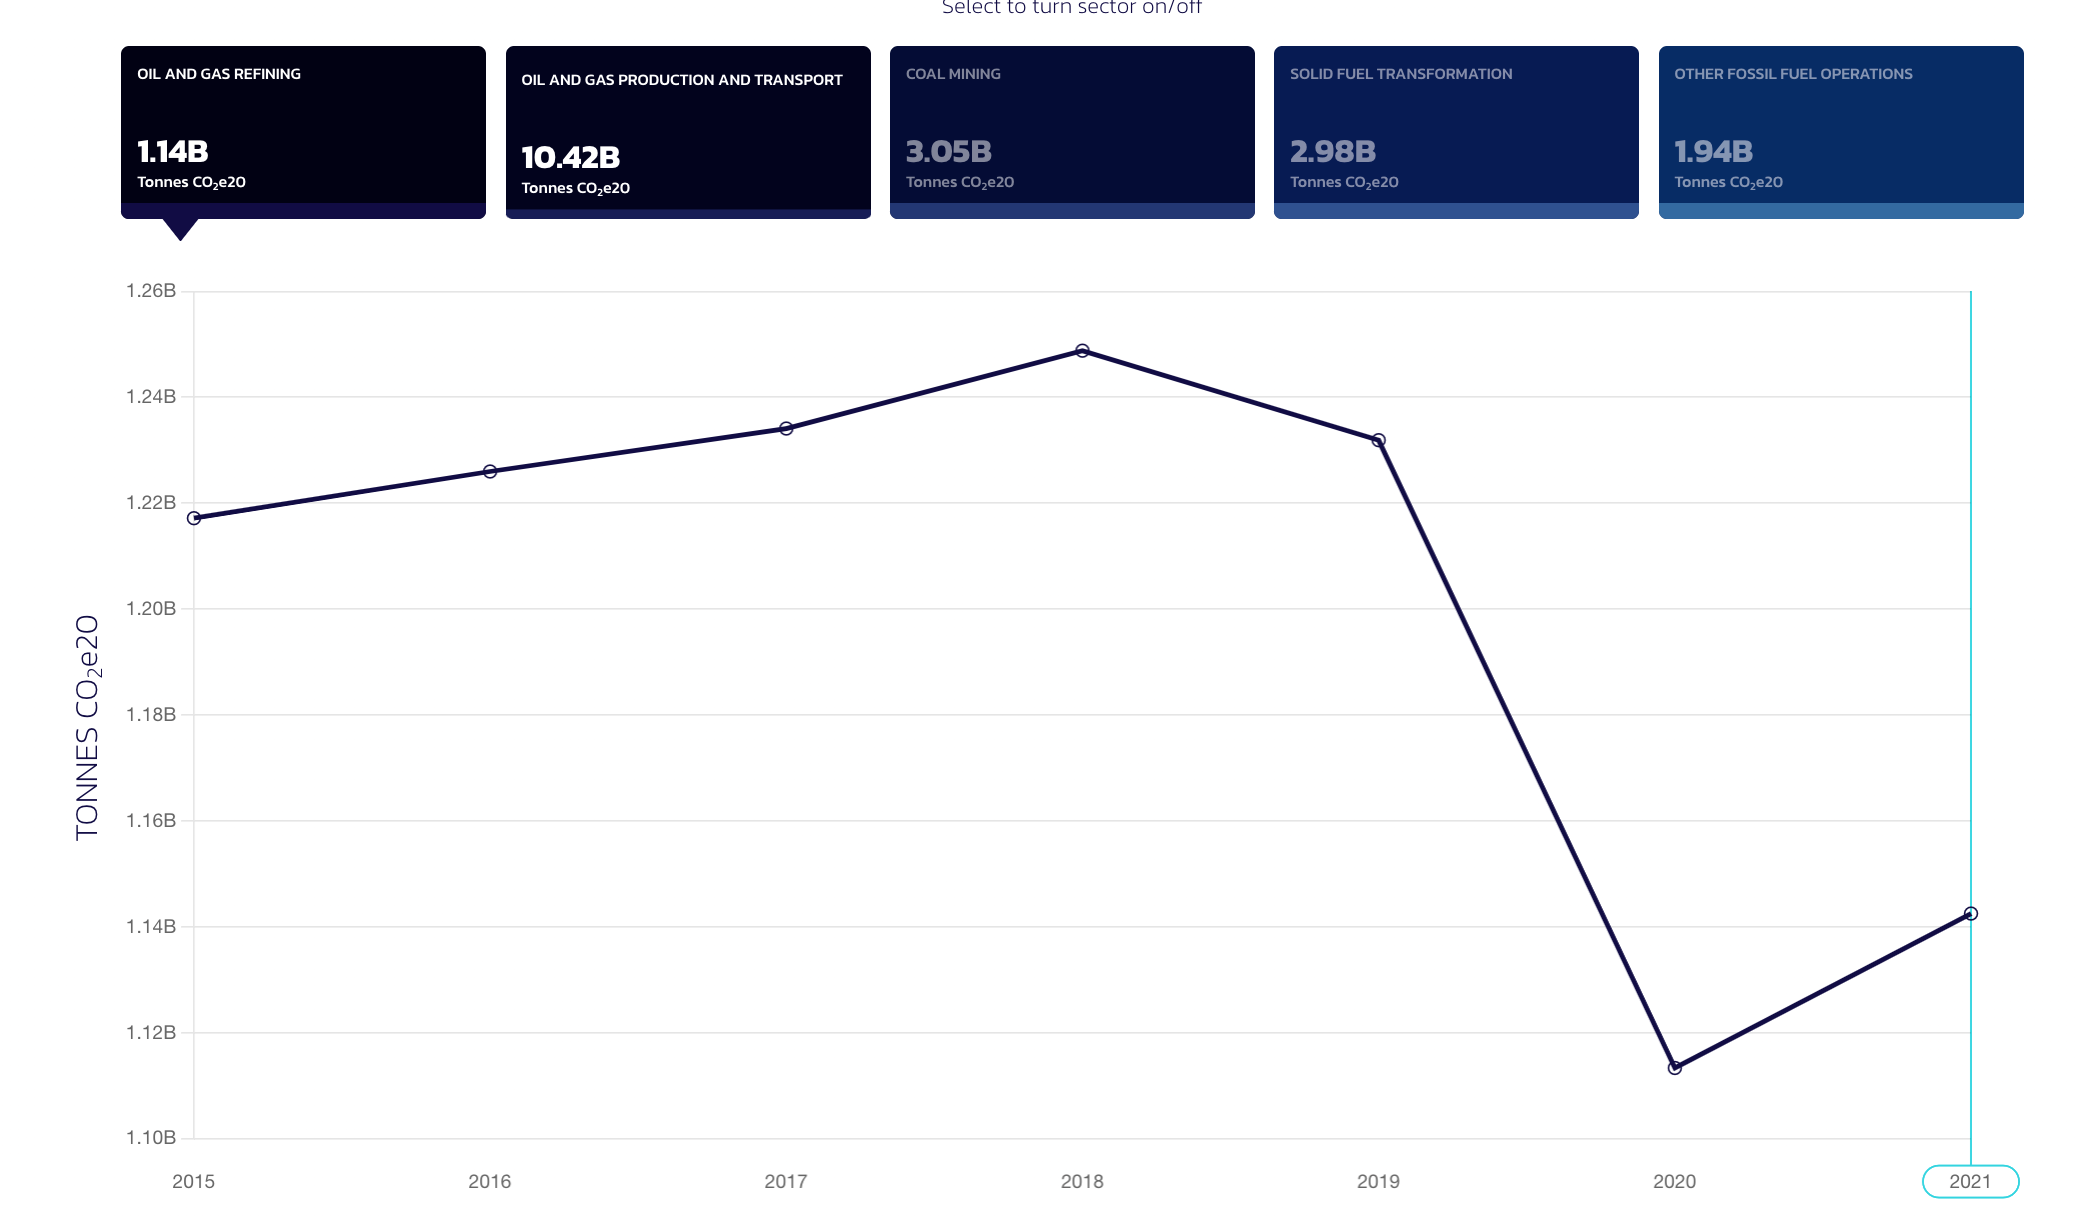
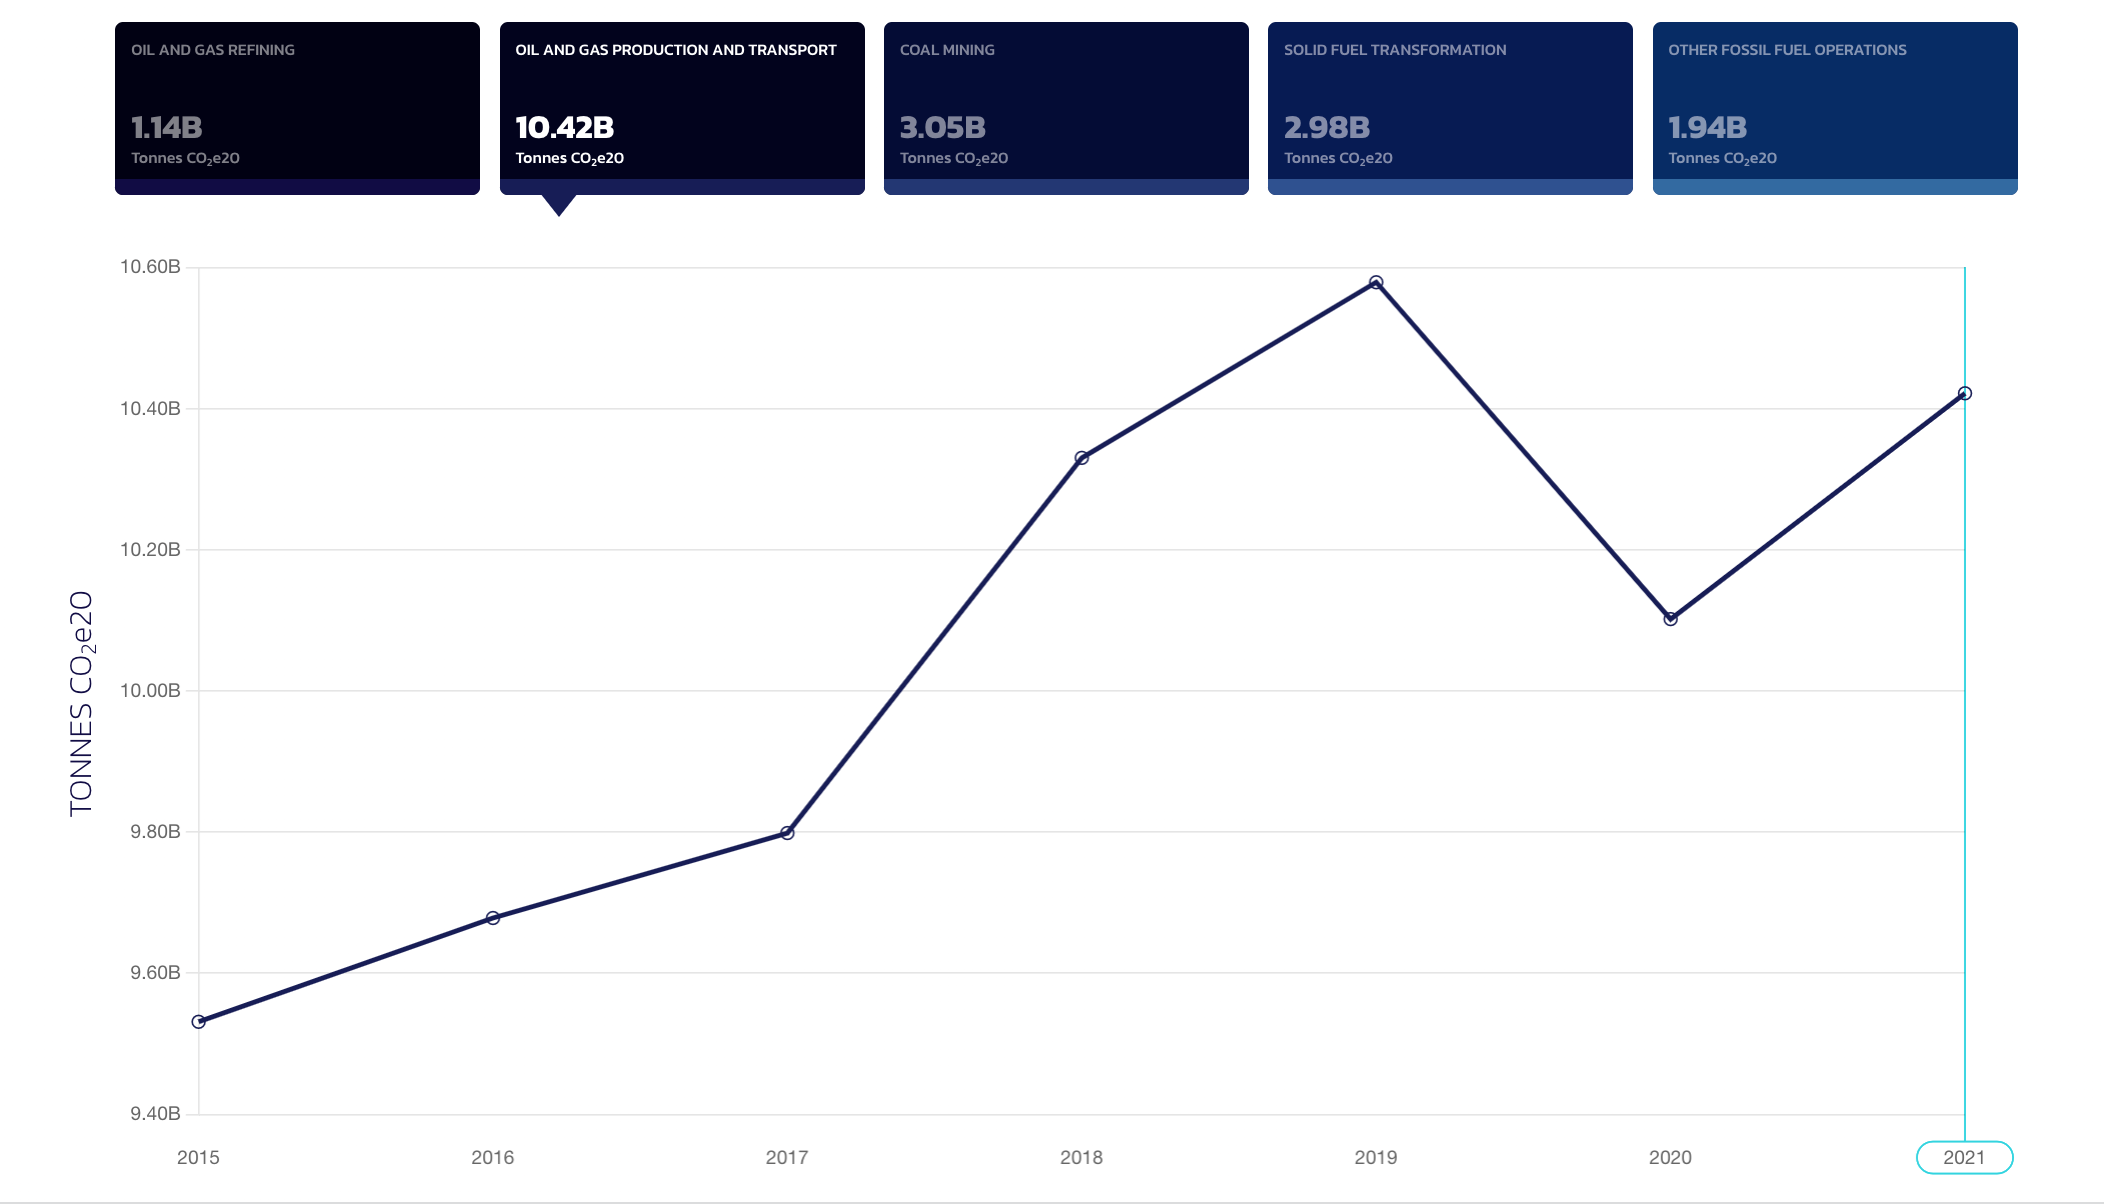
Now we must begin the critical work to bring about real solutions that make every barrel less climate intensive. We invite you to explore the oil and gas data at climatetrace.org and to visit RMI’s Oil & Gas Solutions Initiative page to learn more about the work RMI is doing with partners at Climate TRACE, Carbon Mapper, and others to bring greater visibility to emissions and develop mechanisms to attribute, track, and ultimately reduce them.


Related Insights

Help build the clean energy future. Donate today.
Independent research. Real-world solutions. Supported by donors.
RMI can pursue the highest-impact climate and energy solutions because we’re supported by people who believe change is possible. Every gift helps advance the work needed to make clean energy the default choice worldwide.
For other ways to give to RMI, including checks or gifts of stock, please visit Other Ways to Give.
