Working oil pumps against a sunset sky.

Taking Methane Waste from Invisible to Securable
The re-launch of OCI+ shows why the emissions differences between oil and gas sources have profound implications for energy security and public safety.
For decades, the differences between equivalent barrels of oil and gas have been largely hidden from markets, regulators, and citizens. Yet these differences have profound impacts on energy security and public safety. To make these differences visible, RMI is re-launching our updated Oil Climate Index plus Gas (OCI+), a first-of-its-kind tool that compares the life-cycle emissions intensities from equivalent barrels of these global resources. The more energy it takes to extract, process, and transport oil and gas — and the more methane squandered along the way — the higher their emissions intensity.
Generic industry averages and simple emission factors have historically dominated oil and gas decision-making, obscuring very real differences in emissions. With increasing observations and computational power, that is changing. RMI’s interactive OCI+ tool reveals the differences in life-cycle emissions that are large enough to matter. OCI+ also highlights the potential for significant emissions reductions and energy waste prevention if action is taken.
Spotlight on the oil and gas industry’s responsibility
The oil and gas industry is responsible for significant energy consumption and waste — even before petroleum products are consumed. These wide-ranging differences can be quantified. The inherent differences in resource types (defined by their chemical and physical properties) and how they are processed to make fuels and other commodities drive their energy input and emissions intensity.
For example, heavy oils require enhanced recovery methods like steam flooding; wet gas resources are more prone to methane leaks; and light oils tend to release gas from storage tanks. However, there is a huge range in industry responsibility emissions within each asset class, as plotted below. The current OCI+ launch explores this phenomenon along a few key themes, dissecting the supply chain by responsible actor, analyzing the role super-emitting events play, investigating what drives emissions, and proposing mitigation measures to cut energy waste.
Gas going global
Gas used to be a largely unwanted byproduct of liquids production. Today, it is becoming a highly traded global commodity that is shipped around the globe as liquefied natural gas (LNG). But the longer oil and gas supply chains become, the more energy required for transport, and the greater the risk of gas leakage throughout the system. Efforts are currently underway to measure and mitigate wasted energy that has economic implications. For example, MiQ, an NGO that openly and independently certifies oil and gas emissions, is measuring methane losses through its Supply Chain Protocol so operators and investors can durably reduce their emissions footprints and energy waste.
The surge in announcements of new LNG projects and financing highlights this upward trend in global gas trade. To understand this shift, it is useful to trace the life cycle of gas shown in the graphic below.

Gas’s journey starts at the well head, where it is commonly extracted with assorted hydrocarbons (such as oil) and non-hydrocarbons (water and CO2). Gas is separated from liquids, water and heavier hydrocarbons are removed, and other impurities are shed. From there, processed gas (which is mostly comprised of methane) may enter pipelines for domestic use, or in the case of LNG, be sent to liquefaction plants. At these plants the gas is further treated and cooled with several stages of refrigeration to sub-zero temperatures. The gas is then loaded onto specialized insulated carriers and transported overseas, where it is either transferred, stored, or re-gasified for injection into a local pipeline system. This process allows natural gas to flow freely, like oil, connecting to consumer and producer natural gas markets.
Differentiating LNG emissions
LNG, like all gas, has wide-ranging industry emissions, which vary by a nearly two-fold difference for equivalent volumes. Moreover, the remaining responsibility falls on different supply chain segments, as shown below. Emissions from natural gas production and transport average 72 percent of industry responsibility emissions and go up to 85 percent for high-emitting assets. Operating practices (like venting gas), complex infrastructure (with numerous equipment leaks), or contaminants in the gas (like native CO2) can drive these differences.
LNG plants may implement strategies to prevent leaks, but the risk of higher natural gas leakage increases with reduced corporate governance and oversight. Transportation of LNG is also an important factor. With the increasingly arbitraged nature of the LNG trade, shipping distances can be much longer than simple point A-to-point B routes, amplifying the risk of transportation emissions with increased shipping distances by more than two-fold. While LNG operators are looking at strategies to reduce these leaks, including electrification or combined cycle power generation, these measures alone have limited impact unless emissions from both oil and gas production and LNG transportation are addressed. OCI+ highlights the uncertainties of these dynamics and illustrates how different factors differentiate LNG emissions.
Super-emission events highlight the non-routine
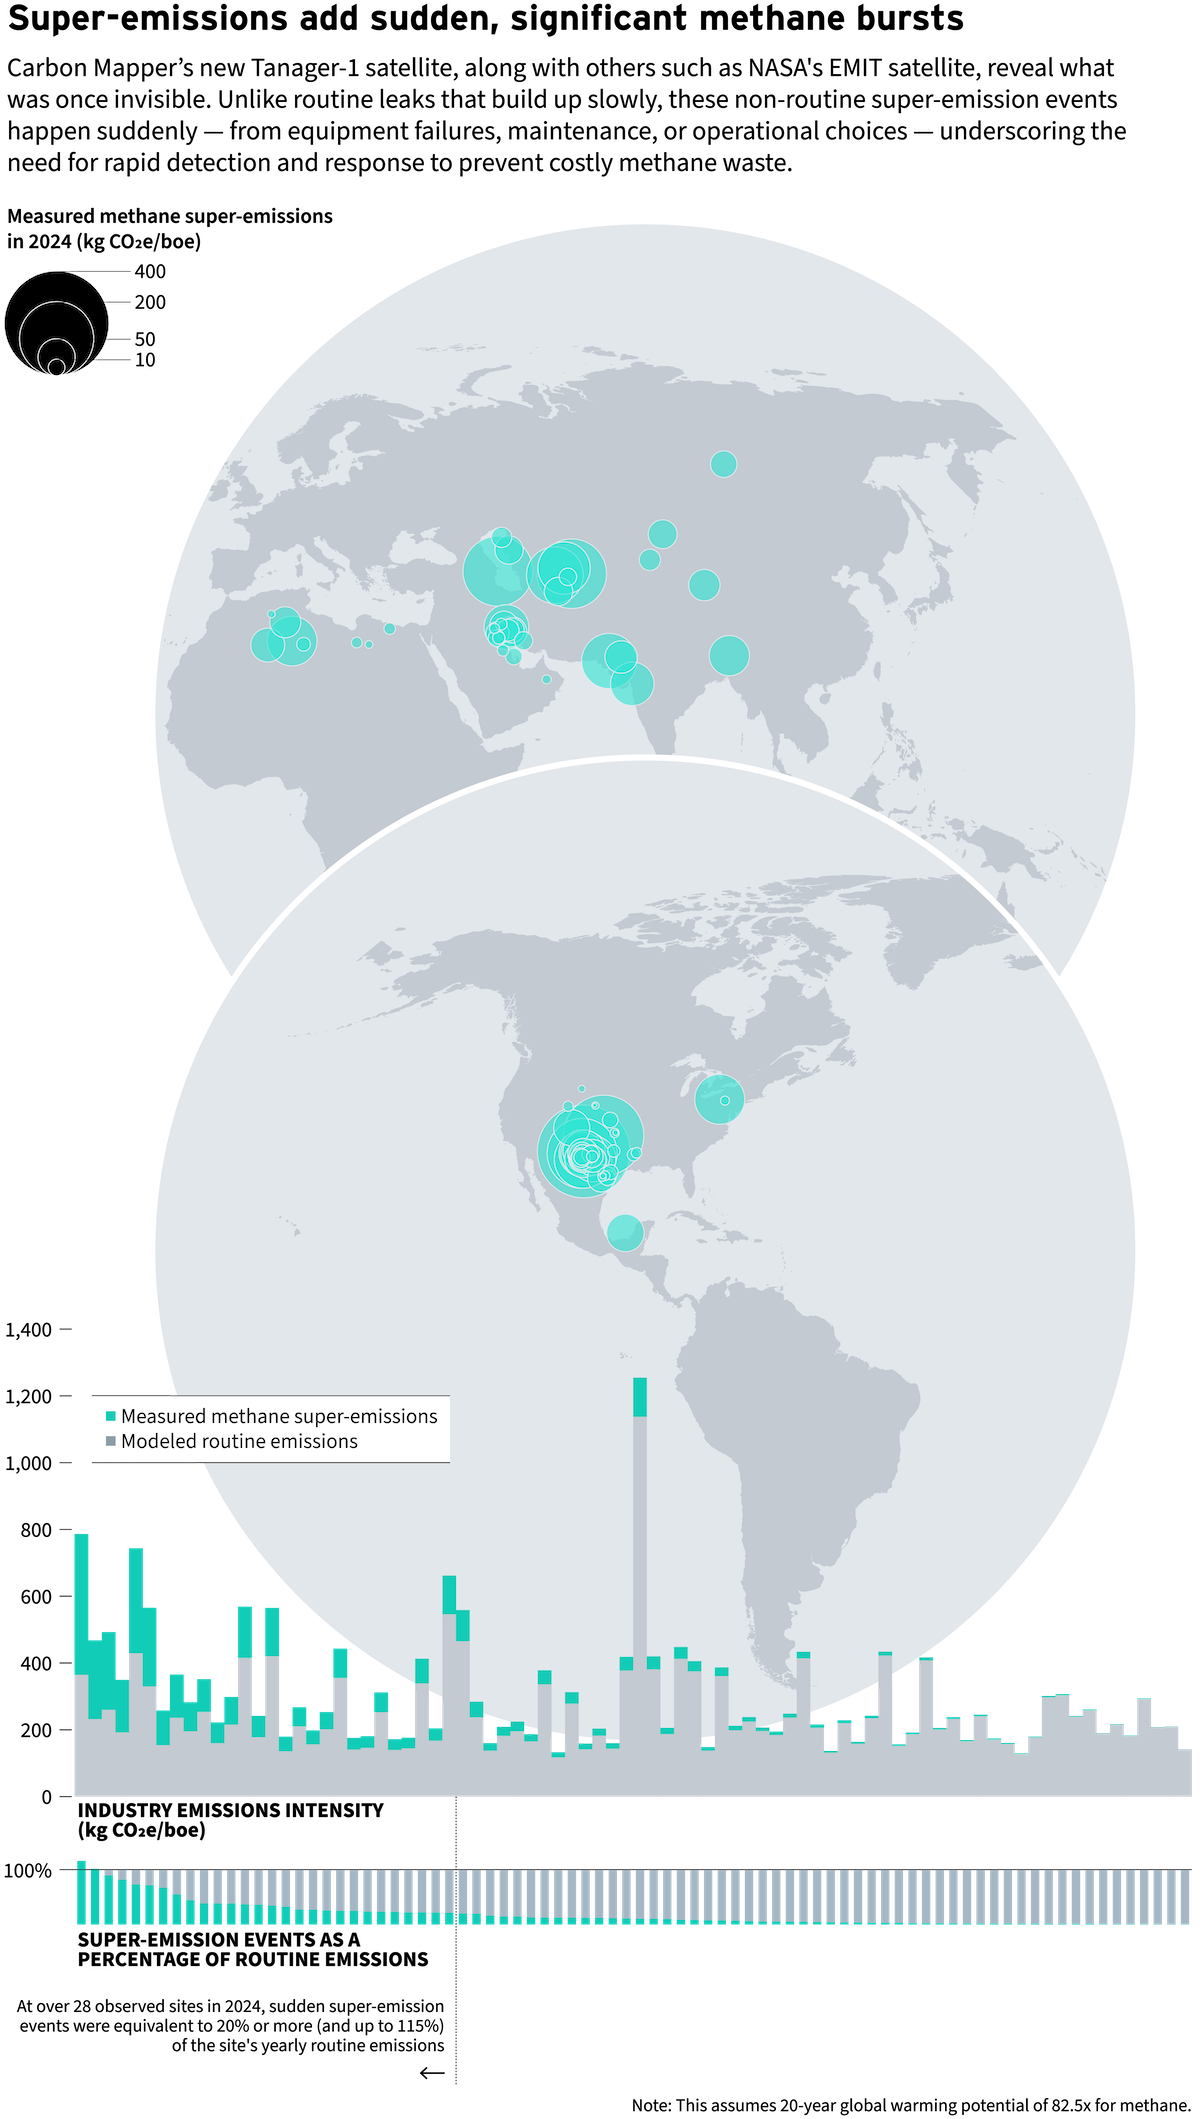
With the launch of Carbon Mapper’s Tanager-1 satellite in August 2024, this OCI+ relaunch incorporates satellite-observed super-emissions for the first time. Satellite observations enable a combination of modeled methane estimates with additional detected measurements.
The OCI+ map tab charts estimated “routine” methane plus any additional “non routine” super-emitting observations, underscoring the variability across assets and regions. Tanager-1 can detect emissions above 70 kg/hour, which is often above small fugitive leaks during routine operation. Satellite detection data can show non-routine gas losses from equipment failures (such as a blown thief hatch), maintenance activities (such as facility blowdowns), and operational decisions (such as purposeful venting due to price or offtake sensitivities). Super-emitting events can release more methane in a few hours than routine activities might over weeks or months. The large number of satellite observations shows the additional impact of super-emission events; with just partial global coverage, super-emitters increased oil and gas methane intensity from those observations by over 20 percent in 2024.
Scenarios for emissions reduction
There are numerous avenues for mitigating oil and gas industry emissions and preventing energy loss. The OCI+ scenario tab models strategies that can help companies, investors, and others that set net-zero targets for their oil and gas industry Scope 1 and 2 emissions. Different resources respond to different mitigation approaches for the production, processing, transport, and end-use segments. The scenarios tab, for example, shows potential ways to prevent venting, flaring, and fugitive loss of valuable gas commodities. Other scenarios explore using renewable electricity instead of diesel to run motors, using solar energy for generating steam, reinjecting carbon from acid gas, and replacing hydrogen made from gas with green hydrogen from water. These changes can reduce emissions intensities by about one-third, while also mitigating wasted energy. The full list of scenarios can be explored on the OCI+ website. And the aggregated benefit of absolute emissions reductions is showcased on Climate TRACE.
By showcasing the benefits of emission reduction strategies, OCI+ underscores the critical role of targeted, resource-specific strategies in cutting oil and gas emissions and making the impact of emission reduction implementation more transparent for decision makers.
The case for action
OCI+ was built to differentiate equivalent barrels of oil and gas so that industry, policymakers, investors, and researchers can target waste and reduce emissions. The visibility offered by OCI+ showcases which assets (by resource type and location) are leading on effective management, and which are falling behind. Accounting for waste and emissions by supply chain strengthens accountability and lowers financial, safety, and reputational risks.
As more data becomes available, RMI will continue to update OCI+. This will further rightsize the opportunity for reducing gas loss and mitigating methane. Yet, too much data remains hidden or biased toward US operations, leaving large gaps in the picture. OCI+ was designed to drive transparency, moving from invisible to securable energy delivery.
The OCI+ models and results are open and accessible. RMI invites you to explore results, compare scenarios, and dig deeper into methodologies. The project is also collaborative — if you have expertise, feedback, or underlying data, your contributions are welcome. The future of oil and gas will be shaped not by what remains hidden, but by what is made visible.
This article was informed by the contributions of Sasha Bylsma, Marissa DeLang, Kevin Gauthier, Shannon Hughes, Amanda Sessler, Jake Stagner, Adrienne Tezca, and RMI’s entire Oil and Gas Solutions Initiative team.

