Learn how we are working to transform how we use and produce energy.
New Zero-Energy Homes Almost to Cost Parity, While Codes & Incentives Help Cross the Finish Line
Why we share this work for free
RMI is an independent nonprofit working to accelerate the clean energy transition. We publish research like this to inform decision-makers and drive real-world impact.
Our work is supported by philanthropy as well as partnerships, including fee-for-service engagements. This support makes it possible for us to share our independent insights for free.
If you find this work valuable, you can support it anytime.
Get more insights like this
Stay up to date with the latest research, analysis, and tools from RMI by opting in to receive occasional emails below. You’ll get new reports, event invitations, and practical insights to help us all accelerate the clean energy transition.
Loading form...
Your download should start automatically. If it doesn’t, click the download button below.
This work is made possible by philanthropy
RMI is a nonprofit supported by donors and partners. Philanthropy enables us to produce independent research and make resources like this freely available.
If you find this report valuable, please consider supporting our work. You can also explore how we partner with organizations to drive impact.
Jump to Section
If you had a choice between building new homes that meet basic standards and building comfortable, healthy homes that dramatically cut energy bills, which would you prefer? How about if the low-energy homes cost the same (or nearly the same) as a standard home to build? If the cost is relatively equal, shouldn’t every new home be built this way?
A recent Rocky Mountain Institute report, The Economics of Zero-Energy Homes: Single-Family Insights, makes the case that not only is this vision becoming achievable, in some locations in the United States the economics are in place today to make cost parity (almost) a reality. And in one New England location—thanks to progressive incentives and energy codes—it is a reality.
In our report, we analyzed four cities—Houston, Atlanta, Baltimore, and Chicago—to determine the current incremental cost to build a zero-energy (ZE) or zero-energy ready (ZER) home in climate zones 2 through 5 (where 90 percent of new construction homes are built) to determine the most cost-optimal energy upgrade package. ZE homes produce or procure as much renewable energy as they consume over the course of a year. ZER homes are designed to achieve ZE levels of efficiency but don’t yet have solar photovoltaics. We found that the cost increase to build a ZE or ZER home is modest in all four zones, with incremental costs averaging 7.3 percent for ZE homes and 1.8 percent for ZER homes—far less than consumers, builders, and policymakers may realize.
To scale the results of our four-city analysis across the country, we used RSMeans to adjust the labor and material costs, PVWatts to adjust the solar resource, EnergySage to adjust the solar cost, and the Pacific Northwest National Laboratory’s analysis of the International Energy Conservation Code (IECC) to adjust incremental costs in relation to local energy codes. We did not factor in local incentives. Using this approach, we approximated the incremental cost in the 47 most populous US cities (see Figure 1). At a 1.1 percent incremental cost, many cities on this list may have incentives available that could result in cost parity for ZER homes. This is exciting because ZER homes can be built anywhere regardless of solar resource and roof design, and so are incredibly scalable.
[table id=1 /]
The Importance of Codes and Incentives
Our research uncovered a basic truth: Not all cities are created equal in terms of the cost to build ZE and ZER homes. Even the exact same home with the exact same energy upgrade package can result in significantly different costs in a different city.
Why?
Robust local building energy codes (like IECC 2015), better solar resources, lower labor and material costs, and comprehensive incentives all make it easier to build ZE and ZER homes at a lower cost. Therefore, cities with these features get closer to ZE/ZER cost parity, and those without are farther from parity.
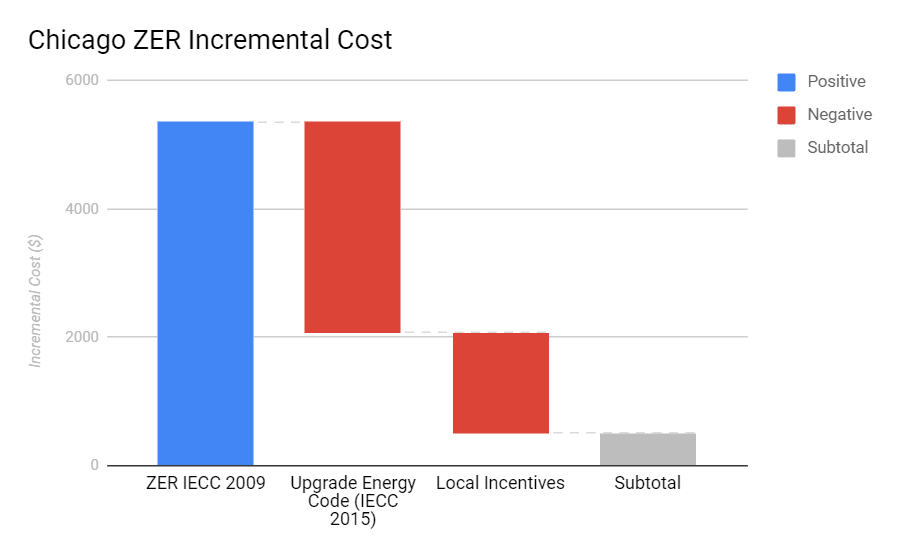
For example, Chicago has a stronger building energy code than the modeled baseline (IECC 2015 versus 2009, respectively). ComEd, the utility that serves Chicago, offers incentives for appliances, smart thermostats, heat pump systems, and hot water heat pumps. The combination of stronger energy codes and solid local incentives brings the incremental cost of a ZER home in Chicago from $5,368 to $495, as seen in Figure 2. At this incremental cost, ZER homes would pay back in less than a year through utility bill savings.
One city is already proving that building cost-parity ZER homes is a reality, thanks to a forward-thinking program from Mass Save, a collaborative of Massachusetts’ natural gas and electric utilities and energy efficiency service providers, including Berkshire Gas, Blackstone Gas Company, Cape Light Compact, Columbia Gas of Massachusetts, Eversource, Liberty Utilities, National Grid, and Unitil. The program offers performance-based incentives that offset the entire estimated incremental cost of $1,837, meaning that the cost barrier to ZER homes is eliminated in Boston.
Building ZE Homes at ZER Prices
While ZER homes are nearing and, in some cases, even achieving cost parity, ZE homes appear to have a long way to go before cost parity is achieved. But what if we could build ZE homes at ZER prices?
Enter third-party-owned solar financing. There are two types of third-party-owned solar financing methods: a solar lease and a solar power purchase agreement (PPA). In a solar lease, the customer pays a specified amount every month, regardless of the system’s energy production. In a solar PPA, the customer pays a specified amount per kilowatt-hour of generation, so the amount paid varies monthly as a function of generation. In 2017, 41 percent of residential solar was third-party owned, so this is a common model. By utilizing third-party-owned solar financing, builders can build ZER homes and at no additional upfront cost turn it into a ZE home.
Further, in some locations, solar PPA or loan providers can offer contracts that provide homeowners with cheaper electricity rates than those available through utilities. Notably, Lennar, the second largest builder in the United States, recently created a PPA that sets the solar price 20 percent below utility rates for 20 years. This means homeowners will pay lower utility bills than living in a ZER home, and all their energy consumption will be offset by solar.
Getting Over the Finish Line
Many cities are close to achieving cost parity for ZER and ZE homes, and city policymakers can take action to help push them across the finish line. Stronger energy codes will bring the bar higher for all new construction homes, and therefore lower the incremental cost of ZER. Additionally, city policymakers can work with the local utility to provide comprehensive incentives for homes that are performing significantly better than code baseline. Finally, to help ZE homes achieve cost parity, city policymakers can encourage businesses to offer PPAs and solar loans by working with utilities to offer favorable interconnection and net-metering policies and by providing clarity around any legal or regulatory requirements for third-party solar ownership models.
To learn more about The Economics of Zero Energy Homes: Single Family Insights report, check out the Zero-Energy Homes Are Ready for Mainstream Markets blog or this webinar summarizing the report. Stay tuned for an update that includes climate zones 6 and 7 and a similar report featuring multifamily buildings coming out in the first quarter of 2019.
Authors

Alisa Petersen
Related Insights

What Michigan’s Clean Community Financing Ecosystem Can Teach Other US Regions
Help build the clean energy future. Donate today.
Independent research. Real-world solutions. Supported by donors.
RMI can pursue the highest-impact climate and energy solutions because we’re supported by people who believe change is possible. Every gift helps advance the work needed to make clean energy the default choice worldwide.
For other ways to give to RMI, including checks or gifts of stock, please visit Other Ways to Give.
