Learn how we are working to transform how we use and produce energy.
Introducing WasteMAP: A New Tool to Track and Reduce Waste Methane Emissions
This open-access web tool aims to create greater transparency on methane emissions data from solid waste while providing waste authorities — and the public — with actionable insights to reduce methane emissions in their communities.
Why we share this work for free
RMI is an independent nonprofit working to accelerate the clean energy transition. We publish research like this to inform decision-makers and drive real-world impact.
Our work is supported by philanthropy as well as partnerships, including fee-for-service engagements. This support makes it possible for us to share our independent insights for free.
If you find this work valuable, you can support it anytime.
Get more insights like this
Stay up to date with the latest research, analysis, and tools from RMI by opting in to receive occasional emails below. You’ll get new reports, event invitations, and practical insights to help us all accelerate the clean energy transition.
Loading form...
Your download should start automatically. If it doesn’t, click the download button below.
This work is made possible by philanthropy
RMI is a nonprofit supported by donors and partners. Philanthropy enables us to produce independent research and make resources like this freely available.
If you find this report valuable, please consider supporting our work. You can also explore how we partner with organizations to drive impact.
Jump to Section
Methane is a potent greenhouse gas that has contributed to 30 percent of global warming since pre-industrial times. Its warming impact is more than 80 times that of carbon dioxide over 20 years. The waste sector, including solid waste and waste water, is the third largest contributor to methane emissions, responsible for almost 20 percent of the global total. Mitigating this short-lived climate pollutant is critical not only to limiting near-term warming, but also to improving human health and environmental quality.
That’s why we’ve launched the Waste Methane Assessment Platform (WasteMAP), a new, open, online platform that aggregates and maps reported, modeled, and observed waste methane emissions data. It also features a decision support tool based on this data for policymakers, landfill operators, and other stakeholders, allowing them to establish baseline methane emissions and model alternative scenarios with improved waste management practices. WasteMAP aims to help decision makers deploy effective strategies for emissions mitigation while taking into account the unique local context of different countries and regions.
WasteMAP was unveiled at the COP28 conference on December 1 and represents a collaborative effort between RMI and Clean Air Task Force (CATF), with funding support from The Global Methane Hub and Google.org. In a race to limit near-term warming, its launch marks a pivotal moment in the fight against methane emissions, and a recognition of the importance of addressing emissions from the waste sector.
How it works
1. Map Layers:
WasteMAP features three map layers: a country-level choropleth, city-level, and site-level layers. These layers present waste data, such as generation and characterization, and emissions data from municipal solid waste treatment and disposal, including satellite-observed methane plumes where available.
a. Country-Level Data:
WasteMAP includes 2021 emissions data from the Emission Database for Global Atmospheric Research (EDGAR) and the most recently reported emissions of Annex I countries and non-Annex I countries under the United Nations Framework Convention on Climate Change (UNFCCC), offering both total and per capita emissions figures. (Exhibit 1) 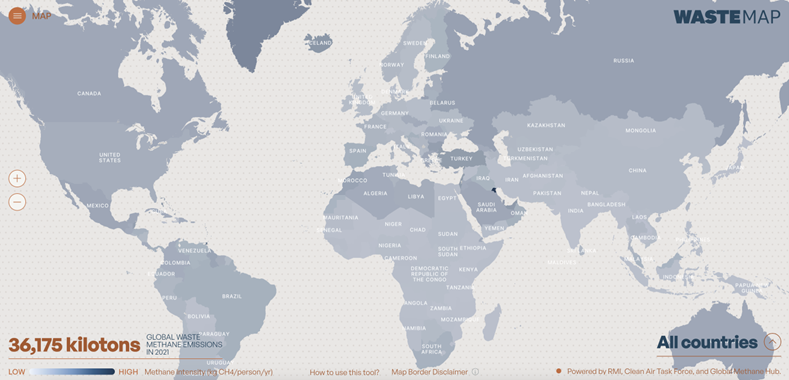 Exhibit 1. Choropleth layer based on per capita solid waste methane emissions (EDGAR 2021).
b. City-Level Estimations:
City-level methane emissions are estimated based on waste generation, characterization, existing diversion practices, disposal site design, and other factors. The WasteMAP team adapted the Solid Waste Emissions Estimation Tool (SWEET) developed by the US Environmental Protection Agency to develop an open-source python model (available on GitHub) that generates these estimates. 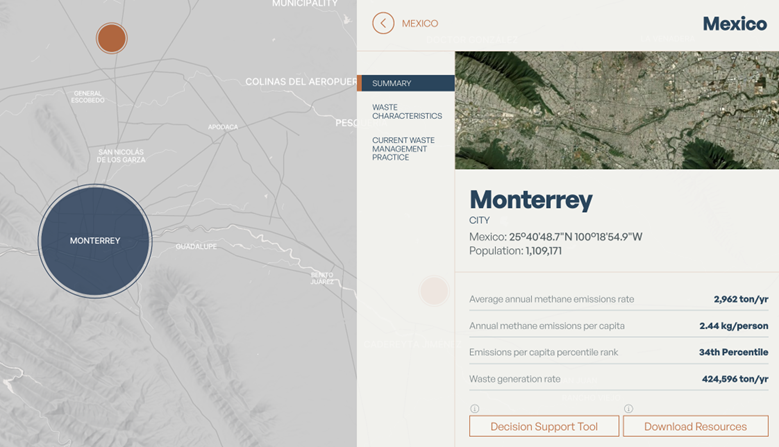 Exhibit 2. A snapshot of the DST that allows users to toggle different waste diversion scenarios to understand the methane mitigation potential of various interventions.
c. Site-Level Insights:
WasteMAP provides detailed information about solid waste disposal sites, including satellite and flyover observed methane emission rates, by aggregating data from sources such as Climate TRACE, GHGSat, SRON, and Carbon Mapper. 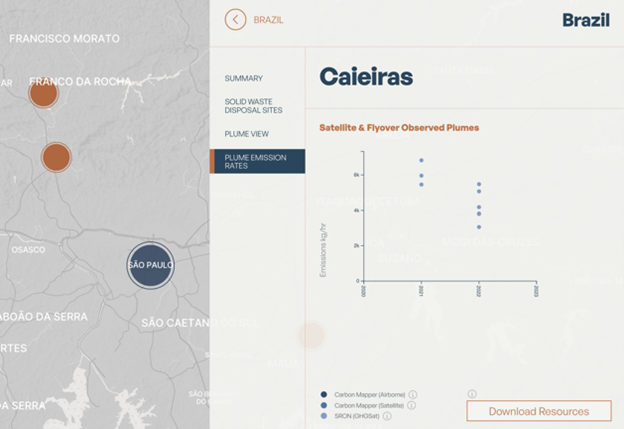 Exhibit 3. Example of a facility information card that contains plume observations from different satellite providers.
2. Decision Support Tool (DST):
A standout feature of WasteMAP, the DST, allows users to visualize methane emissions projections from current waste management conditions (referred to as “baseline”) and compare those with alternative scenarios with improved waste management practices such as organic waste diversion. This python tool, developed by RMI based on U.S EPA’s SWEET, enables users to explore and compare methane mitigation potential of different interventions. Users can model various scenarios by altering waste diversion rates, such as increased composting, recycling or anerobic digestion, thus decreasing the final disposal volume. For cities that are considering rehabilitating dumpsites to landfills, or installing gas capture systems, the impact of these measures can also be modeled by adjusting waste site distributions. The DST allows users to perform this customized scenario modeling for all cities in the WasteMAP database, or in future platform updates, any city in the world if population and average annual precipitation information is provided. Our database of cities will continue to expand as more data becomes available in the coming years.
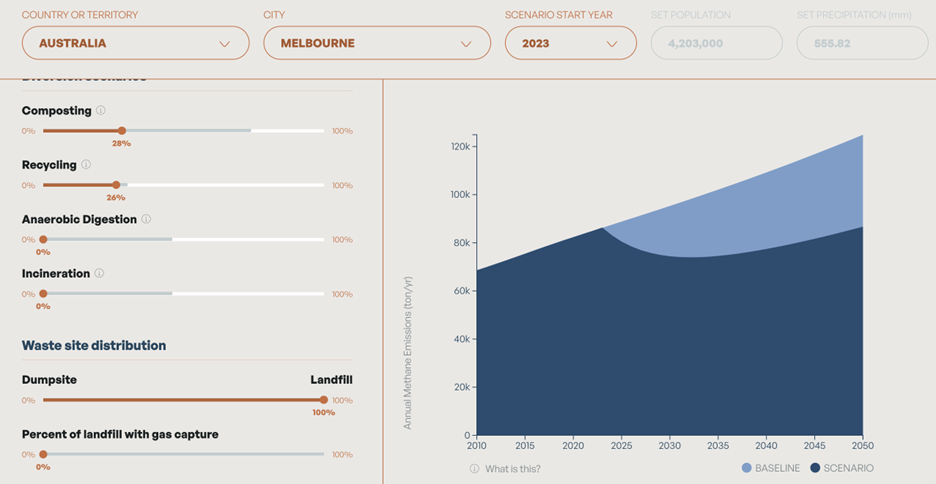
Exhibit 4. A snapshot of the DST that allows users to toggle different waste diversion scenarios to understand the methane mitigation potential of various interventions.
3. Resources:
WasteMAP hosts a library of content to inform and support waste methane abatement, which will be expanded over time. As users view country, city, and site-level information, the map highlights regionally relevant studies and mitigation strategies. The resources on the platform reflect insights from countries where RMI and CATF are collaborating with national and regional governments to provide technical assistance and capacity building. Additional resources including case studies and technical assessments will be shared as country engagement progresses. Workshops for decision makers, like the one recently hosted in Nigeria, help inform these insights, and socialize resources with waste professionals.
4. Citizen engagement:
While WasteMAP has consolidated and analyzed many disparate data sources, not all solid waste disposal sites are known or tracked. WasteMAP’s citizen engagement tool allows citizens to submit and geotag photos of sites, which the WasteMAP team will vet, analyze, and incorporate into its database of known solid waste disposal sites. This informs more accurate inventory of solid waste disposal sites around the world. With this collective effort, all contributors can play an important role in improving waste sector methane emissions estimation and supporting methane reduction efforts.
The Path to a More Sustainable Future
WasteMAP is more than just a platform; it helps create a pathway to achieve the objective of the Global Methane Pledge, to collectively reducing methane emissions by 30% from 2020 levels by 2030, and other national greenhouse gas reduction targets through collaboration. WasteMAP leverages data from various partners, including Carbon Mapper, Climate TRACE, SRON/GHGSAT, and data from other publicly available sources such as World Bank What A Waste.
The platform already has a set of users ready to leverage the data and resources to meet their climate commitments. As a Lowering Organic Waste Methane Initiative (LOW-Methane) partner, RMI is helping communities and national governments access critical data for decision making through WasteMAP. The platform empowers participants by establishing a baseline for emissions and pinpointing emission hotspots, helping guide resource deployment. The participating jurisdictions can also use the decision support tool to support policy implementation and operational improvements to reduce methane. Additionally, WasteMAP can serve as a resource hub for other partners and organizations to share their data with key decision makers.
The WasteMAP launch at COP28 was a testament to the relentless work of teams and organizations dedicated to a more sustainable future — the partners and data providers mentioned above, as well as Earth Genome, a non-profit technology provider specializing in earth observation and conservation. The platform’s potential for global waste methane mitigation underscores the importance of collaborative effort and innovation in tackling non-CO2 greenhouse gases. As more data and resources are added to WasteMAP, we are convinced it will become a pivotal tool to inform methane reduction in the waste sector.
Authors

Rose (Yuan) Wang
Manager
Yuchen Wu
Associate
John McGrath
Director
Tom Frankiewicz
Principal
Ebun Ayandele
Manager
Hugh Runyan

Andre Scheinwald
Senior Data ScientistRelated Insights
The World Wastes More Gas Each Year Than the Strait of Hormuz Supplies
Help build the clean energy future. Donate today.
Independent research. Real-world solutions. Supported by donors.
RMI can pursue the highest-impact climate and energy solutions because we’re supported by people who believe change is possible. Every gift helps advance the work needed to make clean energy the default choice worldwide.
For other ways to give to RMI, including checks or gifts of stock, please visit Other Ways to Give.