Learn how we are working to transform how we use and produce energy.
The Map Is Not the Territory: New Routes to a 1.5°C Future
Why we share this work for free
RMI is an independent nonprofit working to accelerate the clean energy transition. We publish research like this to inform decision-makers and drive real-world impact.
Our work is supported by philanthropy as well as partnerships, including fee-for-service engagements. This support makes it possible for us to share our independent insights for free.
If you find this work valuable, you can support it anytime.
Get more insights like this
Stay up to date with the latest research, analysis, and tools from RMI by opting in to receive occasional emails below. You’ll get new reports, event invitations, and practical insights to help us all accelerate the clean energy transition.
Loading form...
Your download should start automatically. If it doesn’t, click the download button below.
This work is made possible by philanthropy
RMI is a nonprofit supported by donors and partners. Philanthropy enables us to produce independent research and make resources like this freely available.
If you find this report valuable, please consider supporting our work. You can also explore how we partner with organizations to drive impact.
Jump to Section
Explorers use maps intensively, but they take the information recorded in the charts they use with a few grains of salt, knowing that the map is not the territory. After all, sometimes maps present a consensus view of reality that is disastrously wrong.
For more than 100 years, beginning in the mid-16th century, legions of European mapmakers depicted California as an island, separated from the rest of North America by a waterway connecting the Sea of Cortez in the south to the Strait of Juan de Fuca in the north. Spanish missions launching expeditions inland from California’s coast equipped their teams with shipbuilders to be prepared to build the vessels they knew would be needed to cross the fabled Gulf of California on the other side of the Sierras. Imagine their surprise to find instead a vast desert stretching before them to the east.
The explorers, of course, adapted to the reality they encountered. But the real difficulty came in changing the minds of the mapmakers, who persisted tenaciously in their error despite a growing mountain of evidence to the contrary. If the explorers found a desert, they must have been in the wrong place, European mapmakers asserted. The idea of California as an island became an entrenched dogma that withstood contradictory evidence from explorers well into the 18th century.
In the context of today’s increasingly urgent conversation about climate change and the global energy system, the maps of the future that most policymakers and experts turn to are drawn with the help of complex energy-economic models that have been decades in the making. The centerpiece of these models has long been their forecasts of “business-as-usual” (BAU) futures, in which the world remains heavily dependent on fossil fuels through the middle of the 21st century.
For decades, alternative visions of the energy future have been kept at the edges of the modelers’ worldview, nipping at the heels of the BAU frameworks that are at the center of the legacy models’ architectures. A low-carbon future is possible, the modelers conceded, but highly improbable absent heavy-handed policies from national governments to shift the course of history.
But change is afoot. Mounting evidence of the competitiveness of renewable energy, the shift toward electrification of energy end-uses, the enormous size of the energy efficiency resource, and other opportunities has begun to dramatically shift the landscape of the possible future described in long-term energy scenarios. On top of recent positive surprises in renewable energy development, COVID-19 has created further disruption this year, driving a downturn in petroleum demand that could mark a long-term pivot in the energy industry’s trajectory.
Emerging Maps Show Rapid Transformation
In recent months, new energy scenarios created by the long-term energy forecasting fraternity—DNV GL, BP, and the International Energy Agency (IEA)—describe pathways to transform the energy system to reduce carbon emissions. While not all of these studies provide pathways to limit global average temperature change to 1.5°C, all three provide new evidence for how the energy system could change rapidly in the decades ahead.
Two of the studies (BP and DNV GL) suggest that that 2019 may have been the peak year for global fossil fuel use, something that many analysts would have been considered highly improbable just a few years ago. The DNV GL and BP scenarios both indicate that fossil fuel demand has already begun its long-term decline and will almost certainly never again reach 2019 levels. The IEA’s assessment is less clear, but the forthcoming World Energy Outlook 2020, due out next week, could confirm that IEA has also come to the same conclusion.
The first of the new batch of studies arrived in early September from DNV GL, a Norwegian energy services company whose latest analysis takes a deep dive on assessing the long-term implications of the COVID-19 pandemic. The firm’s new forecast pulls forward the timetable for peak fossil fuels by several years from previous estimates. It also shows the long-term impact from COVID-19 and other forces in global markets leading to significant further declines in fuel use and emissions (Exhibit 1).
DNV GL sees the long-term impact of COVID-19 as significant, reducing world final energy demand through 2050 by 8 percent. While this scenario still falls short of what would be needed to limit global temperature change to less than 2.0°C, DNV GL’s analysis adds one more influential voice to others calling attention to the significance of the peak in fossil fuel demand and the underlying forces driving it. (For more analysis of why peak oil demand matters and what it is likely to mean going forward, see further analysis from Carbon Tracker here, here, and here.)
Exhibit 1: DNV GL Forecast of World Energy-Related CO2 Emissions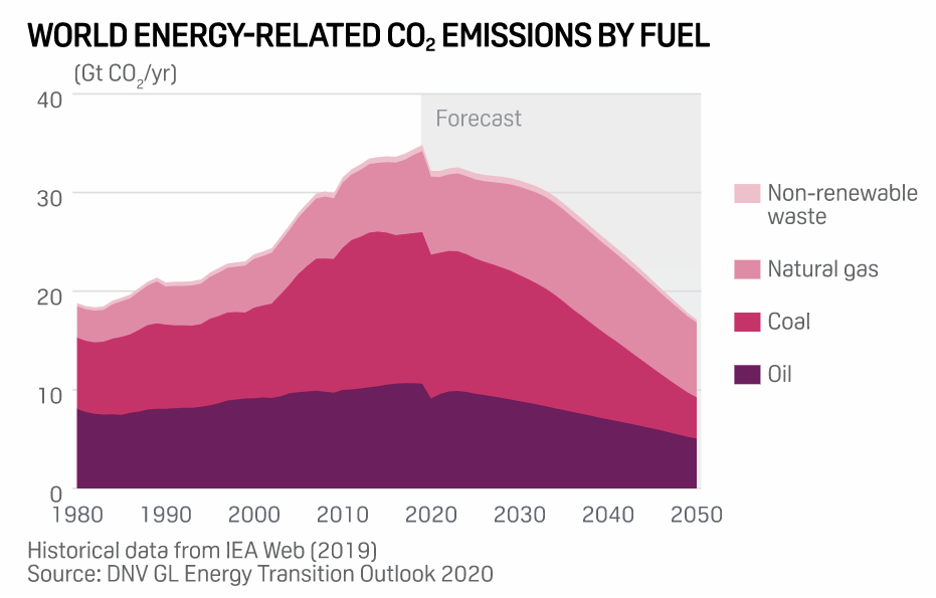
In the weeks following the publication of the DNV GL report, BP and the IEA also released new net-zero emission scenarios. BP’s scenario is 1.5°C compatible while IEA’s scenario is a more ambitious, technology-focused version of its 1.8°C compatible Sustainable Development Scenario.
With these and other analyses now emerging, the center of gravity of mainstream views of the energy transition is shifting to encompass more rigorous consideration of low-carbon pathways, including plausible routes to achieve 1.5°C. While 1.5°C emerged from the Paris Agreement as an aspirational goal with vaguely understood implications, there is now increasing alignment around 1.5°C as the key benchmark for climate action planning among public and private institutions.
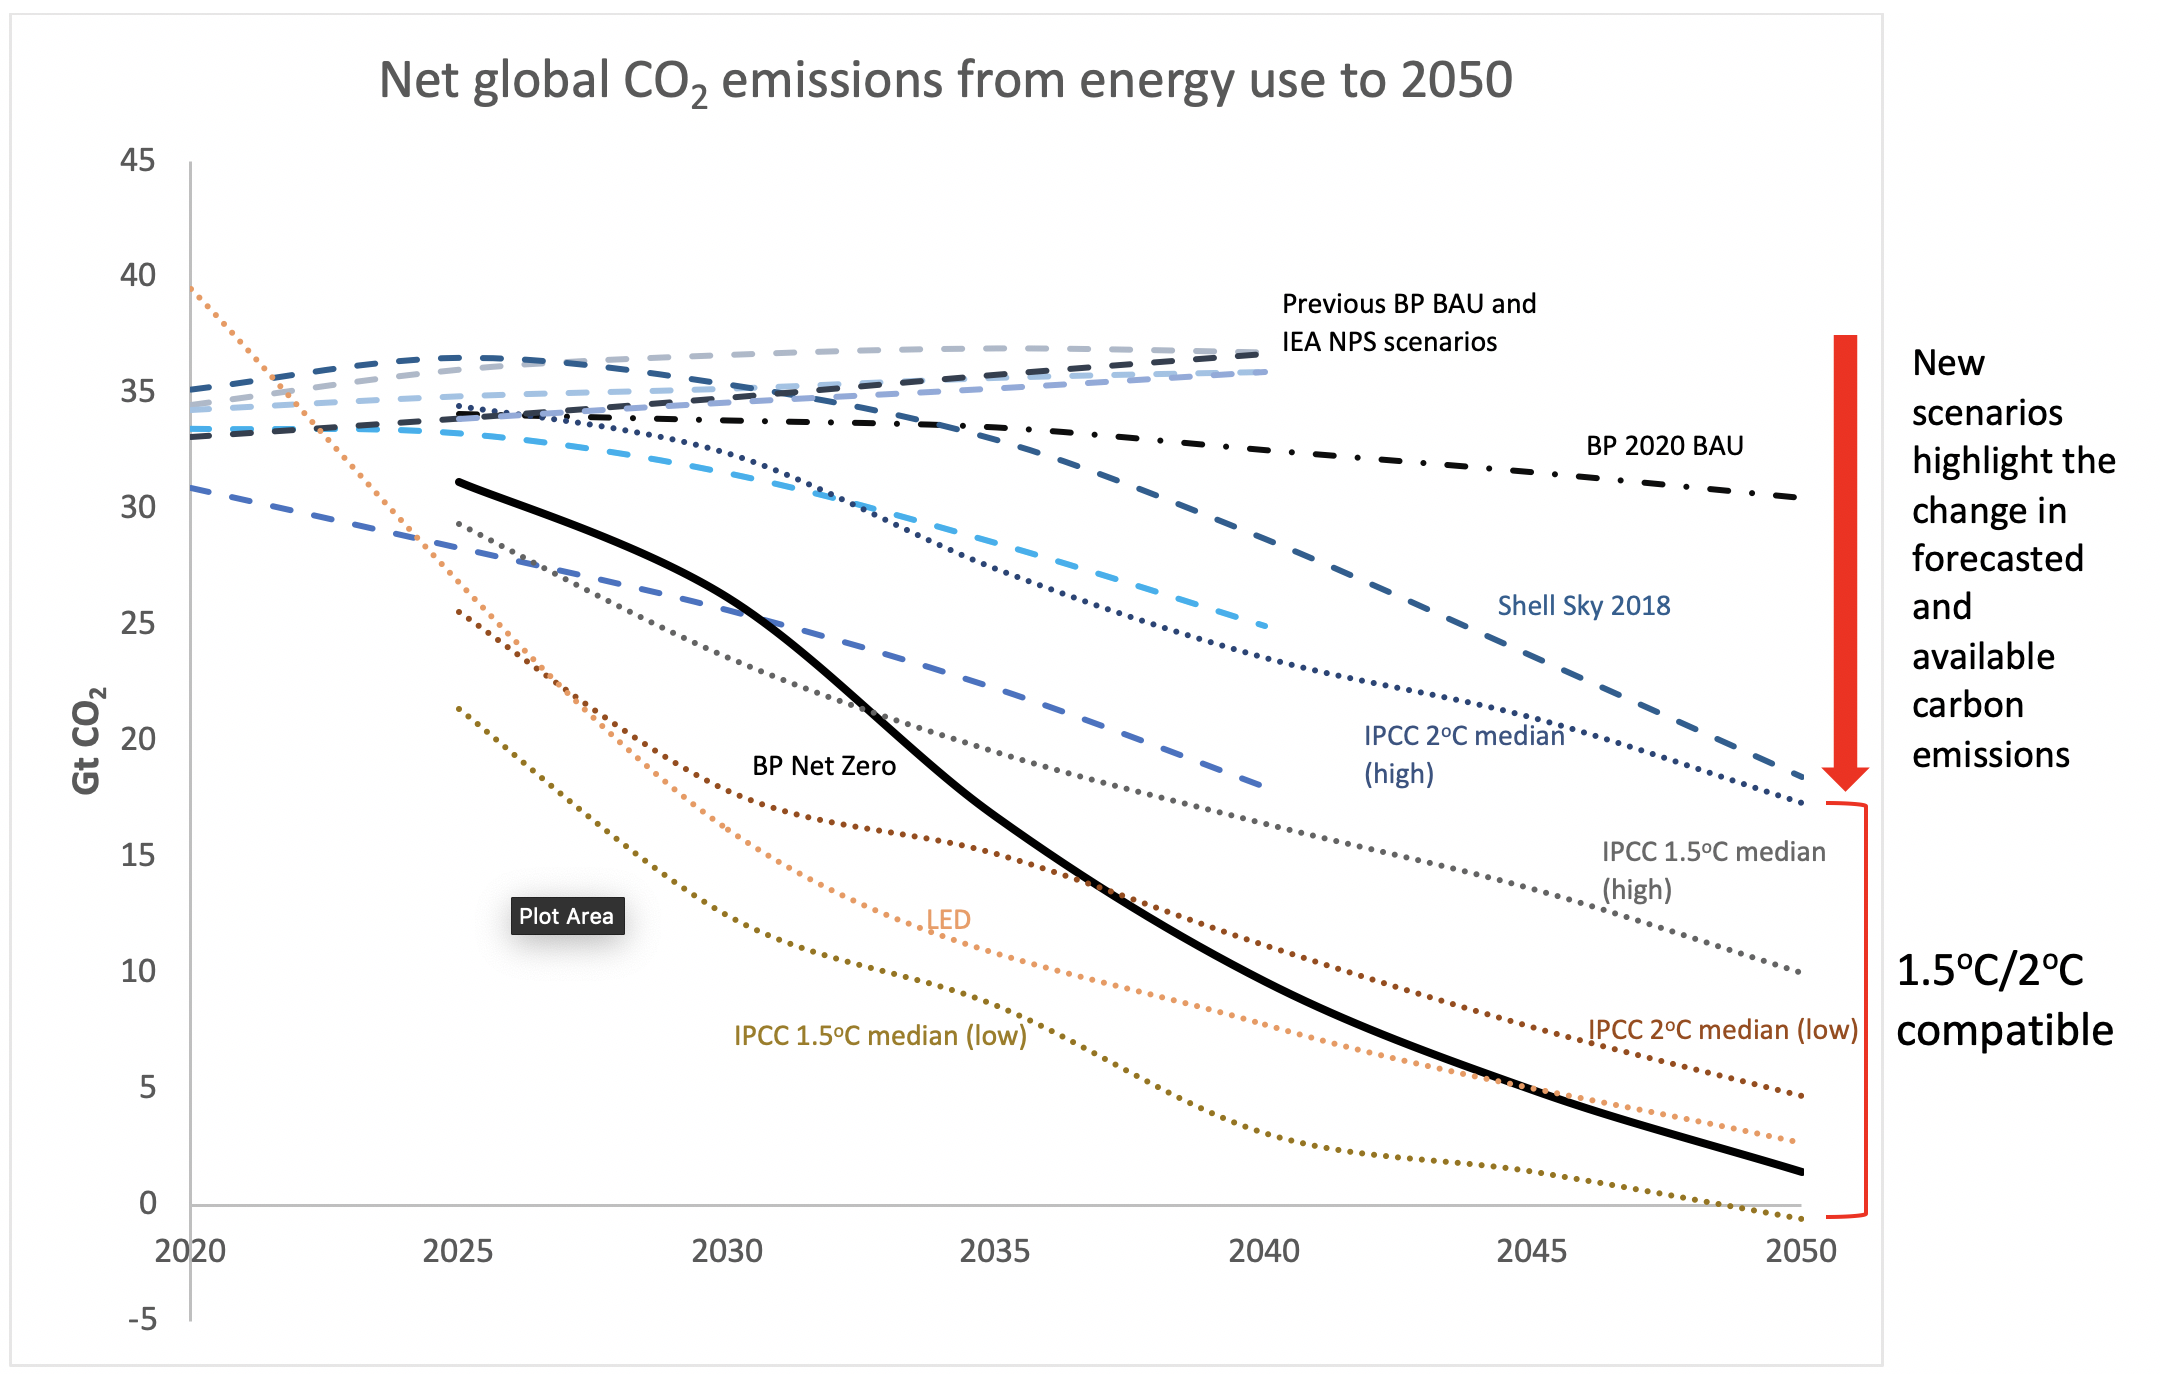
BP’s 2020 energy outlook is an extraordinary departure from previous outlooks, and an outlier relative to most other major oil companies, insofar as it contemplates the real possibility of a steep decline in fossil fuel use by 2050. BP’s newly released “Rapid” and “Net Zero” scenarios imply that oil demand peaked in 2019. Even the more conservative business-as-usual scenario pulls forward peak fossil fuel demand and global energy emissions by several years and significantly reduces projected demand between now and 2040 relative to earlier scenarios. (Exhibits 2 and 3).
In BP’s Net Zero scenario, oil and gas demand is projected to decline so precipitously that the cumulative use between now and 2050 would be about half of today’s proven reserves. The projected drop in fossil fuel demand is accompanied by a tremendous increase in the share of solar and wind in global electricity generation, rising from 9% in 2019 to over 60% in 2050.
Exhibit 2: Long-Term Energy Scenarios: Total Primary Energy and Non-Fossil Share of Energy in 2040
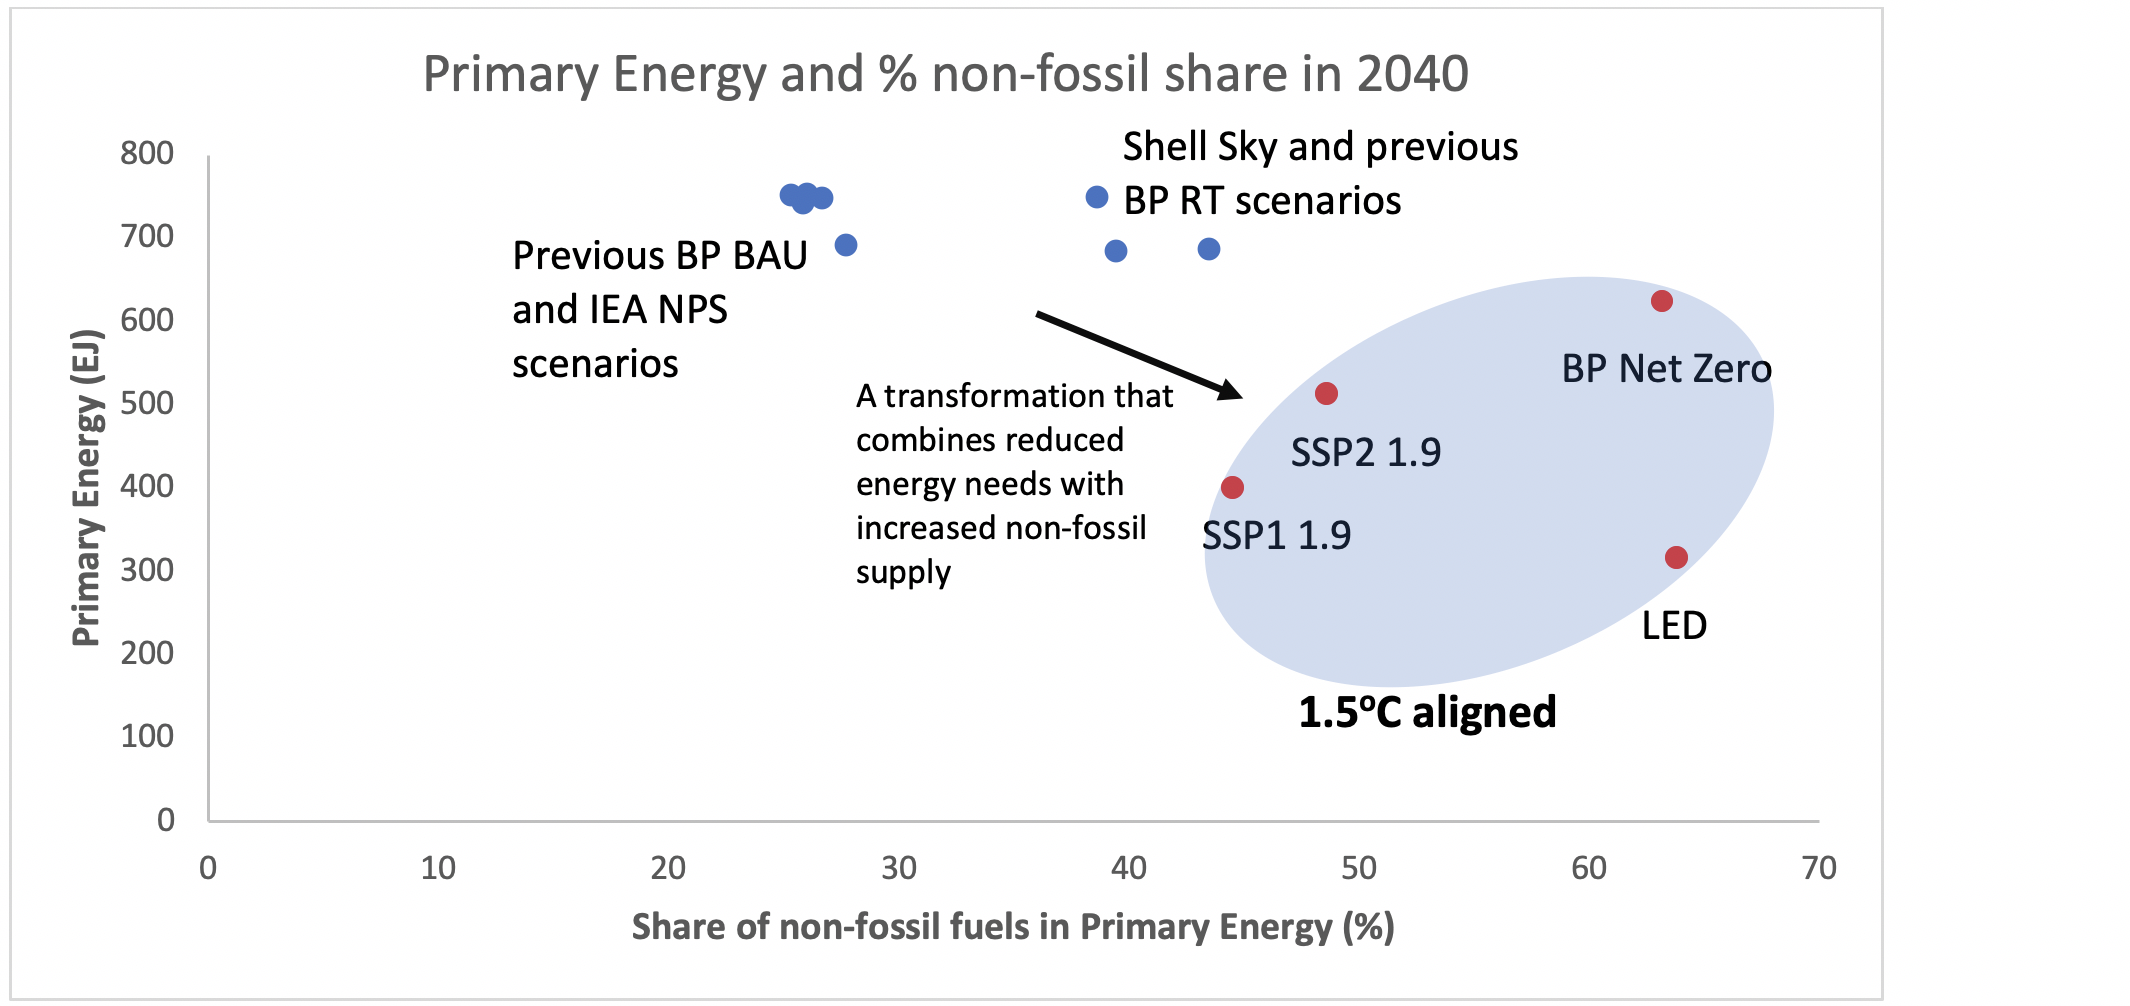
Exhibit 3: Net Carbon Dioxide Emissions from Energy Use to 2050
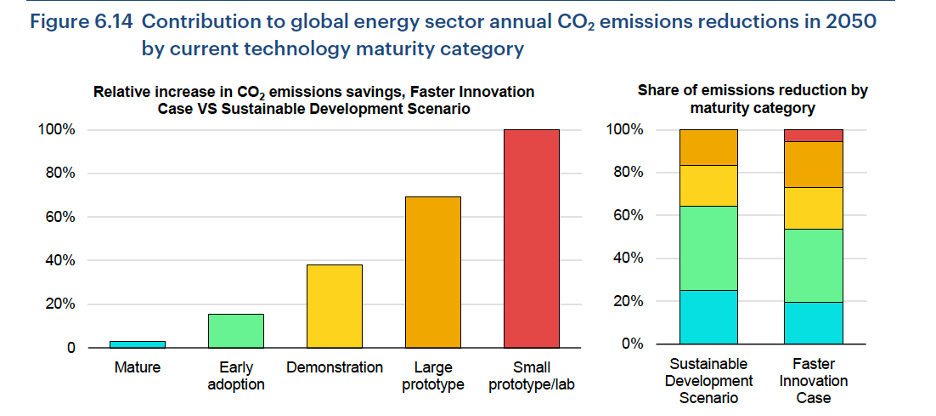
Finally, the IEA’s Faster Innovation Case, one of a pair of scenarios developed to explore sustainable development pathways, explores the energy technologies needed to achieve net zero emissions globally by 2050. Among the advanced technologies envisioned to play key roles are new high-energy density battery chemistries, large-scale high-temperature industrial electric heating, hydrogen-based steel plants, and new bioenergy technologies.
Under this scenario, the time to market introduction for pre-commercial technologies is reduced by 40 percent compared to the IEA’s Sustainable Development Scenario (which is 2oC compatible). Almost half the emission reductions to achieve this scenario would come from technologies that are currently in the demonstration stage or earlier stages of the technology cycle (Exhibit 4).
Exhibit 4: IEA Faster Innovation Case: Contribution to Global Energy Sector Annual CO2 Emissions Reductions in 2050 by Current Technology Maturity
The Future Belongs to the Explorers
The shifting perspectives about the future energy landscape described in the newest reports are having far-reaching consequences for investment and strategy across the entire energy sector. This is especially true for oil and gas companies, who have been hit hard by the short-term consequences of the COVID-19 pandemic.
In recent months several of the oil and gas majors have signaled plans to chart bold new strategic visions for their future. BP’s strategy to reinvent itself as an integrated energy company includes a 40 percent reduction in oil and gas production in the next decade, a 10-fold increase in renewables investment in the same timeframe, and an increased focus on electricity generation. This shift is a massive departure from the status quo and clearly differentiates BP from its peers, most of whom have been unwilling to acknowledge the prospect of such large reductions in fossil fuel production.
BP is not alone in considering fundamental shifts in strategy. Shell is in the midst of its own major restructuring process, called Project Reshape, that would reportedly reduce the company’s oil and gas spending by 30–40 percent to enable an increased focus on renewable energy and power markets. Eni has also announced a major strategy overhaul in order to “pivot to the energy transition” with the creation of a new renewable energy focused business unit. Notably, BP, Shell, and Eni are all European companies.
At the end of the day, the energy transition strategies adopted by the world’s largest companies, from Shell and BP to Amazon, Google, WalMart, and Apple, will reshape the landscape of possibilities for the energy transition. The best mapmakers, including those working now to describe the long-term global energy futures, are constantly learning from the explorers on the frontiers, who are finding new ways to do what previously seemed impossible.
The route to 1.5°C, if we can achieve it, will be created by the innovators, not by the backroom analysts. In this spirit, the year 2020 will stand out as a year of discovery and disruption, in which the mapmakers must race to keep up with new realities and cascading events that are reshaping our worldviews.
Editor’s note: Kingsmill Bond, energy tracker, with CarbonTracker contributed to this blog.


Related Insights


Help build the clean energy future. Donate today.
Independent research. Real-world solutions. Supported by donors.
RMI can pursue the highest-impact climate and energy solutions because we’re supported by people who believe change is possible. Every gift helps advance the work needed to make clean energy the default choice worldwide.
For other ways to give to RMI, including checks or gifts of stock, please visit Other Ways to Give.
