Learn how we are working to transform how we use and produce energy.
From Global to Local: Climate TRACE Helps Prioritize Emissions Reductions from the Oil and Gas Industry
Updated inventory reveals the biggest opportunities to cut methane in this critical sector
Why we share this work for free
RMI is an independent nonprofit working to accelerate the clean energy transition. We publish research like this to inform decision-makers and drive real-world impact.
Our work is supported by philanthropy as well as partnerships, including fee-for-service engagements. This support makes it possible for us to share our independent insights for free.
If you find this work valuable, you can support it anytime.
Get more insights like this
Stay up to date with the latest research, analysis, and tools from RMI by opting in to receive occasional emails below. You’ll get new reports, event invitations, and practical insights to help us all accelerate the clean energy transition.
Loading form...
Your download should start automatically. If it doesn’t, click the download button below.
This work is made possible by philanthropy
RMI is a nonprofit supported by donors and partners. Philanthropy enables us to produce independent research and make resources like this freely available.
If you find this report valuable, please consider supporting our work. You can also explore how we partner with organizations to drive impact.
Jump to Section
There is increasing urgency to immediately address the climate impacts of oil and gas, a major yet easy-to-abate source of methane worldwide. Following a year of mounting climate catastrophes, methane — and especially methane satellite data — took center stage in shaping COP28 negotiations.
Improved inventories and advances in emissions monitoring are playing a growing and important role in making emissions visible and actionable. Climate TRACE is a perfect example. At COP28, Climate TRACE unveiled updates to its open emissions database — an inventory that includes every country and territory in the world, every major sector of the economy, and nearly every major source of greenhouse gas emissions encompassing more than 352 million assets.
This data, which is free and publicly available, is designed to help enable action and accountability at a massive scale. One way Climate TRACE makes this possible is by providing data at different layers of granularity. This allows decision makers to gather the intelligence that they need to make more informed choices — from a statesman who can use emissions data to shape bilateral climate negotiations to a corporation that wants to reduce emissions across their entire supply chain.
As a member of the Climate TRACE coalition, RMI leads data and analysis in the oil and gas sector, utilizing direct observations and multiple sources of data plus advanced modeling to break down emissions across oil and gas production and transport, refining, and — new this year — petrochemicals to advance the visibility of emissions in this historically obtuse and currently expanding sector.
In this post, we’re covering some of our key takeaways from the Climate TRACE emissions inventory this year from the oil and gas industry, starting with a wide lens then zooming in closer to explore how different layers of data reveal useful and actionable insights.
Global: A small fraction of oil- and gas-producing countries have an outsized impact on emissions from oil and gas production.
According to the Climate TRACE inventory, just five countries are responsible for nearly 60 percent of total greenhouse gas (GHG) emissions from oil and gas production and transport.
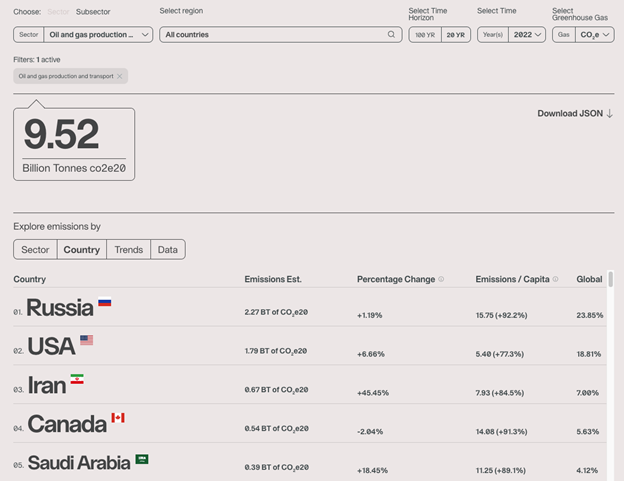
Exhibit 1: Climate TRACE screenshot of GHG emissions by country.
Country: The United States and Russia have a particularly disproportionate methane impact.
In 2022, these two countries were responsible for 43 percent of the world’s emissions from oil and gas production and transport when looking at CO2e on a 20-year time horizon.
One reason for these countries’ high absolute emissions is the sheer volume of production. According to the U.S. Energy Information Administration (EIA), the United States and Russia account for 31 percent of the world’s oil and gas production, jointly producing on average over 30 million barrels per day. While these two countries couldn’t be more different in their political structure, political climate, operations, and global commitments to address oil and gas GHGs, digging into the data reveals some surprising similarities that underlie their emissions.
But that’s just half of the story. These two countries also have high gas leakage that results in excessive methane emissions from the oil and gas sector.
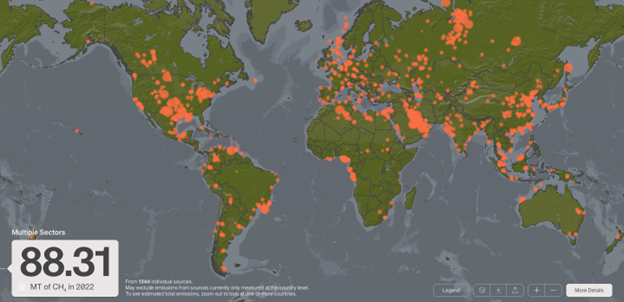
Exhibit 2: Methane emissions from the oil and gas sector, US and Russian emissions highlighted.
Source: Climate TRACE 2023, https://climatetrace.org/explore/oil-and-gas-production-and-transport-oil-and-gas-refining-other-e8b357e8266a1c48772a233d286ca1ed
The remainder of methane from oil and gas sources comes from sources around the globe as indicated in the map above. Thanks to advances in remote sensing technologies like satellites, emissions that were previously ‘out of sight and out of mind’ are more visible. This data can help shape policies and regulations to target super-emitters in these areas and hold producers more accountable for methane leaks.
Field: More granular data reveals near-term priorities
If you zoom into the United States where RMI has the most granular data, you’ll see that the oil and gas produced, processed, and transported from various fields from the Permian Basin in New Mexico and Texas to the San Joaquin Valley in California to the Marcellus Shale in Pennsylvania varies significantly in its climate impacts. The figure below shows that the industry’s share of methane intensity of US oil and gas assets can vary more than six-fold (excluding end uses). This can be due to a variety of factors including — but not limited to — equipment, technology, and operational and management practices.
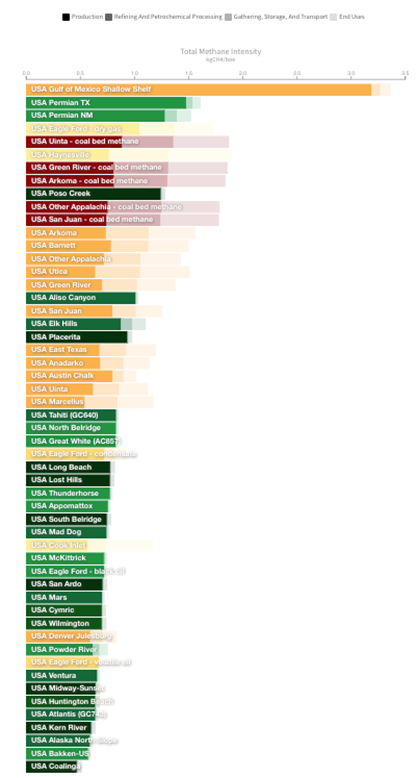
Exhibit 3: The wide variation in the methane emissions intensity of U.S. oil and gas fields, sorted for industry methane emissions from production, processing, and transport.
Notes: The lightest bars represent methane leakage from appliances and other end uses; green bars represent majority oil assets and yellow-orange bars represent gas assets.
Source: RMI, OCI+, updated 2023, https://ociplus.rmi.org/supply-chain?metric=methane
In gas supply chains, recent RMI analysis has shown that methane leakage is far greater and more frequent than assumed in certain regions, and that super-emitter events like major pipeline leaks that release tons of methane per hour are not being accounted for in self-reporting on emissions. But many methane releases go unnoticed unless a methane-detecting satellite or sensor happens to make them visible. Once we know about them, interventions to cut methane in the gas supply chain are relatively simple and cost-effective, like prohibiting venting and routine flaring, and incorporating routine equipment fixes and upgrades into maintenance plans can significantly cut methane emissions from production sites.
Explore Climate TRACE
We encourage you to explore Climate TRACE and dig into the data to see what insights you can glean! In future posts, we’ll dig into further insights on oil and gas refining and petrochemicals.


Related Insights


Help build the clean energy future. Donate today.
Independent research. Real-world solutions. Supported by donors.
RMI can pursue the highest-impact climate and energy solutions because we’re supported by people who believe change is possible. Every gift helps advance the work needed to make clean energy the default choice worldwide.
For other ways to give to RMI, including checks or gifts of stock, please visit Other Ways to Give.
