Learn how we are working to transform how we use and produce energy.
Distribution-Scale Solar Goes Big in Texas
Why we share this work for free
RMI is an independent nonprofit working to accelerate the clean energy transition. We publish research like this to inform decision-makers and drive real-world impact.
Our work is supported by philanthropy as well as partnerships, including fee-for-service engagements. This support makes it possible for us to share our independent insights for free.
If you find this work valuable, you can support it anytime.
Get more insights like this
Stay up to date with the latest research, analysis, and tools from RMI by opting in to receive occasional emails below. You’ll get new reports, event invitations, and practical insights to help us all accelerate the clean energy transition.
Loading form...
Your download should start automatically. If it doesn’t, click the download button below.
This work is made possible by philanthropy
RMI is a nonprofit supported by donors and partners. Philanthropy enables us to produce independent research and make resources like this freely available.
If you find this report valuable, please consider supporting our work. You can also explore how we partner with organizations to drive impact.
Jump to Section
Texas has long been known as the capital of oil and gas. And over the past decade it added so much wind power that if Texas were a country, it would be the world’s fourth-largest wind producer. Looking back at the past few years, a fourth energy trend can be added: the growth of solar photovoltaics (PV).
Texas has added 1.8 GW of solar to date, more than 80 percent of that in the past two years, ranking it third in the nation by new capacity. The Texas solar industry now employs about 10,000 people, more than double the number of people employed three years ago.
Astonishing even to solar power proponents, Texas’s main grid operator, Electric Reliability Operator of Texas (ERCOT), forecasted that solar would be the only economically viable new power source from now to 2031 in six of eight potential scenarios, forecasting between 15 and 28 GW of new solar PV.
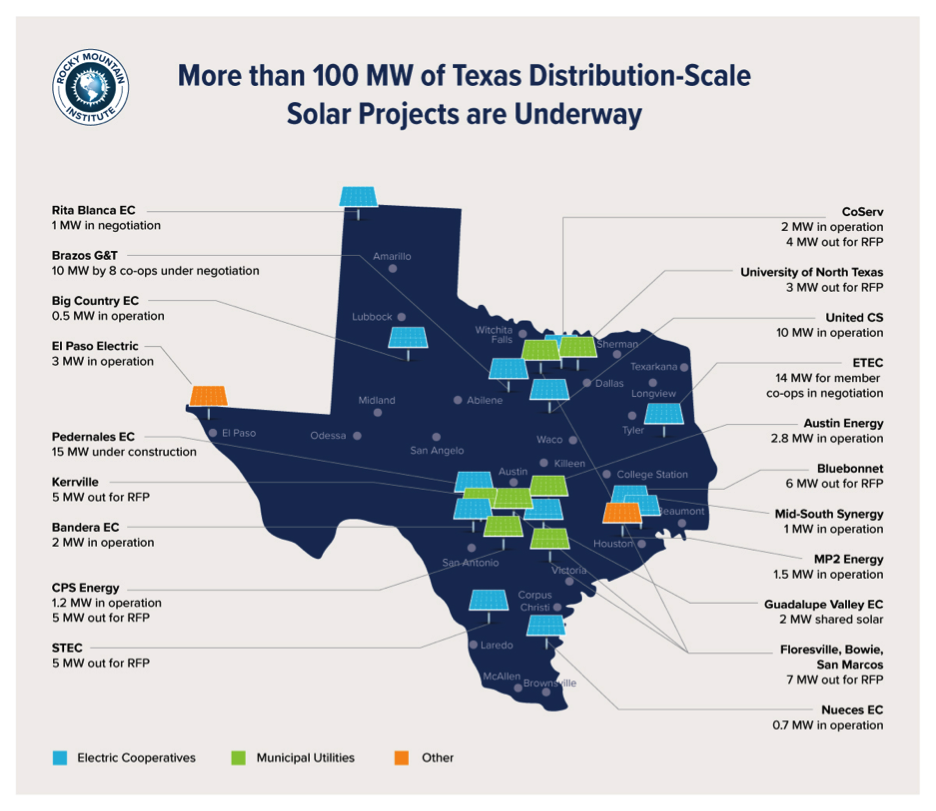
Most of Texas’s solar installations have been utility-scale: large arrays installed on vast swaths of arid land, transported by high-voltage transmission lines to cities like Dallas, Houston, Austin, and San Antonio. Yet now a different revolution is picking up steam. This revolution is driven by local electric cooperatives (co-ops) and municipal utilities (munis) buying “distribution-scale” solar—1 to 10 megawatt (MW) arrays installed on the distribution grid, in or on the outskirts of cities. More than 20 small Texas utilities have pursued distribution-scale solar, now totaling about 100 MW, the equivalent of a small natural gas plant.
Offsetting Grid Infrastructure Costs
The main reason for this surge in distribution-scale solar is favorable economics. A single 1 MW solar array can save small utilities up to 50 percent of their power procurement costs, achieving net present values (NPV) of about $1.5 million per array on 20-year power purchase agreements (PPAs) in West Texas (or between $250,000 and $1 million in Central Texas, due to lower insolation and more expensive land).
What causes these favorable economics? On the one hand, costs have come down dramatically. Costs for 1–10 MW systems have decreased by more than 50 percent in five years, from $4.50/W in 2011 to $2.20/W in 2016—and today’s prices in Texas are likely half that.
But lower costs are only part of the story. The other part is the growth in the value of solar. Is the grid electricity that solar avoids getting more expensive? No, quite the contrary. Texas wholesale energy prices have been low in recent years due to cheap natural gas and an oversupply of generating capacity. Average energy wholesale costs in Texas have dropped from $53/MWh to $25/MWh from 2011 to 2016, a 54 percent decline, and power futures markets don’t indicate a changing tide.
If the power that solar avoids is becoming cheaper, how can solar become more valuable? The key is that distribution-scale solar not only avoids wholesale energy costs, it also saves on non-energy costs related to distribution networks, generation capacity, and, in particular, transmission.
Texas Transmission Costs
Texas’s main grid, ERCOT, covers about 60 percent of the state and serves about 90 percent of its population. ERCOT’s transmission costs have increased from below $20/kW in 2006 to above $53/kW (proposed) in 2018, equal to a 168 percent increase over a dozen years, for an average annual rate of increase of 9 percent. Many Texans believe that the Competitive Renewable Energy Zone (CREZ) transmission lines built to bring low-cost power (primarily wind) from the west and northwest (Panhandle) of Texas are the only culprit for growing transmission costs.
But this is not the case. Even before CREZ investments were amortized, ERCOT transmission costs grew 6 percent per year on average.
Transmission cost growth in Texas is not an ERCOT-only matter. The Southwest Power Pool (SPP), the grid operational zone covering most of the U.S. Great Plains and 20 percent of Texas, has seen similarly high transmission cost growth. Golden Spread Electric Cooperative, a Texas-based transmission-level utility serving both ERCOT and SPP territory, reports transmission cost increases of 12 percent per year (60 percent from 2012 to 2016).
A National Story
The growth of infrastructure costs as a part of energy costs—a key driver for distribution-scale solar—is not only happening in Texas.
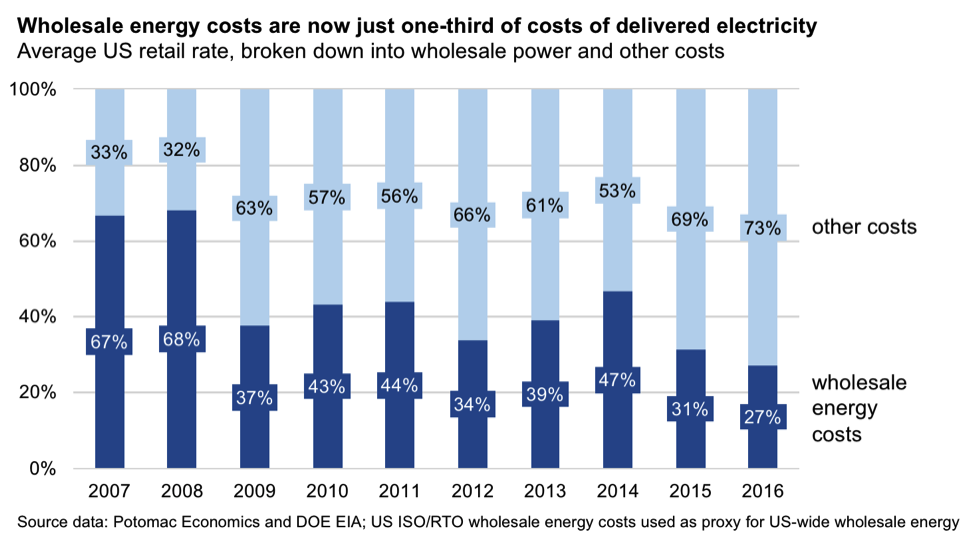
The graph below shows how wholesale energy (excluding generation capacity amortization) is now responsible for less than 30 percent of the cost of delivered electricity. This is a complete flip of the cost structure we saw just 10 years ago, when wholesale energy accounted for about 70 percent of the cost of delivered electricity. The vast majority of electricity costs are now for “cold metal”: wires, poles, transformers, substations, and generation assets (even when not generating), along with some fees, upkeep operations, and taxes thrown in on top.
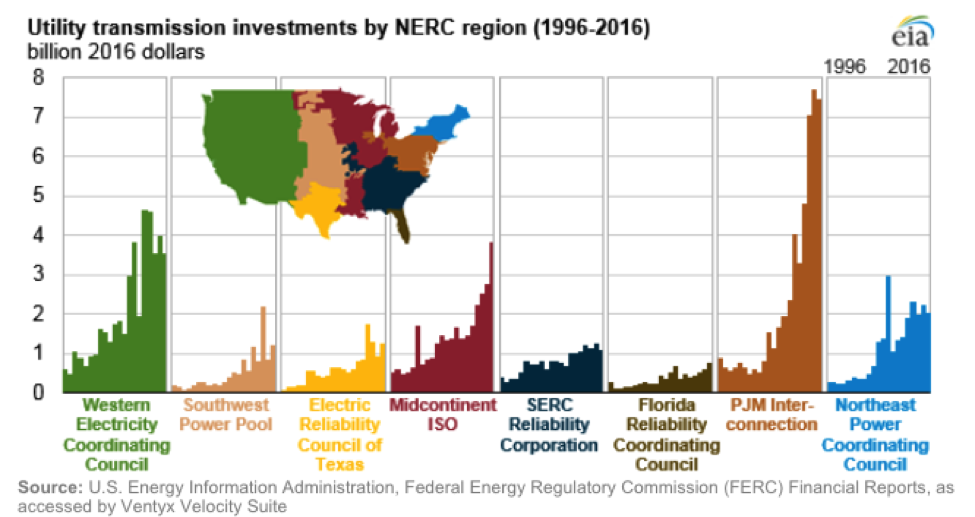
What explains this trend of transmission spending growing from $8 billion per year in 2007 to $21 billion in 2016, a 160 percent increase over a decade?
Increased transmission spending is caused by several factors, including catch-up after underinvestment in the early 2000s; requirements in transmission security and communications systems; new transmission lines to connect low-cost renewables with load centers; and, potentially the most significant, utilities with regulated (i.e., guaranteed) returns shifting their investments from electricity generation to transmission infrastructure due to sufficient generation supply.
Coincident with increased transmission spending, U.S. electricity use has been flat since 2007, thanks to impressive propagation of energy efficiency measures. When growing infrastructure costs are divided over a fixed number of kilowatt hours, costs go up per kilowatt hour. Indeed, despite reduced energy generation costs, the average U.S. retail rate has increased from 9.1¢ /kWh in 2007 to 10.3¢/kWh in 2016.
How the Savings Works in Texas
Distribution-scale solar avoids using the transmission grid because electricity is produced close to load. There is basically no use of transmission or transmission-level generation capacity. It’s like renting office space close to home, so that you can skip use of toll-road highways and limit yourself to local roads. You don’t use the toll road, and thus you should not need to pay.
Of course, these savings accrue to the driver only when the mechanism is fair—in the case of toll roads, you pay when you use. Fortunately, most Texas utilities face tariff structures with their generation and transmission (G&T) utility and/or the wholesale power grid that accurately reflect the value of solar to the grid.
The transmission and generation capacity tariffs are based on a utility’s load during system peak, as designing to manage peak is what fundamentally drives power infrastructure sizing and cost. System peaks in Texas typically happen on hot summer weekday afternoons. Distribution-scale solar, especially when it tracks the sun, is typically producing solar electricity during these system peaks, offsetting the transmission and generation capacity costs.
ERCOT does not credit distributed generation above 1 MW–AC with the same tariffs. This is why most of the projects in Texas are 0.99 MW–AC in capacity. Twin projects are sometimes installed in close proximity with two separate 0.99 MW connections, for a total of 1.98 MW–AC.
Eating Multiple Slices of the Value Pie
Solar peak production often offsets the peak on the local utility substation, and thus can meaningfully extend the life of current substation transformers if substations are chosen that are approaching peak limits.
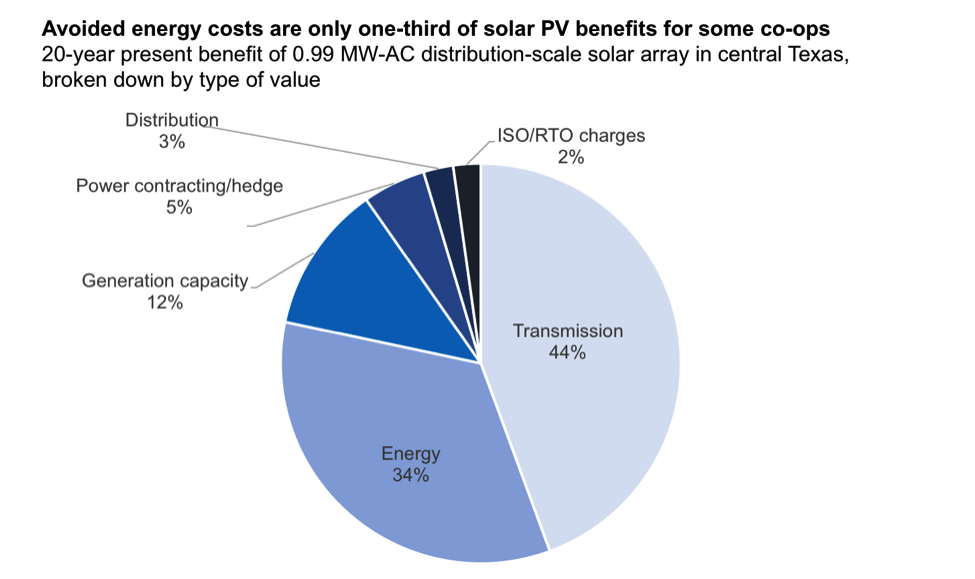
The chart below shows the economic benefit (i.e., avoided cost) of a 0.99 MW-AC distribution-scale solar array in Central Texas. The absolute and relative value of different values varies between utilities. The chart makes it clear that distribution-scale solar produces a stack of values.
Texas utilities can evaluate their specific benefits by augmenting a public model offered by Rocky Mountain Institute.
Further Growth Ahead
Based on a number of recent Texas deals (growing from 0 to 100 MW over the course of four years), as well as the bottom-up analysis of substantial net present value, it’s clear these deals are very compelling for many Texas co-ops and munis. And these utilities don’t need to have large cash reserves to access distribution-scale solar. In most cases, the utility signs a PPA for the electricity produced by the solar array.
This trend is taking place not just in Texas. The aforementioned rise in national transmission and other non-energy costs have driven other utilities to pursue these deals. As a result, NRECA reports that more than 200 co-ops have now installed distribution-scale solar arrays.
Specific to Texas, in the past three months, San Antonio’s municipal utility, CPS, asked for bids for 5 MW of solar PV, while three additional municipal utilities issued a request for proposals (RFP) for up to 7 MW of solar PV. And RMI’s own Shine™ team brought together three energy buyers, two cooperative utilities, and a university located within a municipal utility’s territory, for an RFP for 13.25 MW of solar and solar-plus-storage bids.
So is Texas distribution-scale solar growing quicker than you can shake a stick at? Sure’nuff!
Are you working with a small utility, or is your power provided by a co-op and muni? Share your story with us. Contact us at shine@rmi.org.
Authors

Dan Seif
Titiaan Palazzi
Related Insights


Help build the clean energy future. Donate today.
Independent research. Real-world solutions. Supported by donors.
RMI can pursue the highest-impact climate and energy solutions because we’re supported by people who believe change is possible. Every gift helps advance the work needed to make clean energy the default choice worldwide.
For other ways to give to RMI, including checks or gifts of stock, please visit Other Ways to Give.
