Learn how we are working to transform how we use and produce energy.
Bring in the Billions
How states can capture the economic potential of clean energy incentives.
Why we share this work for free
RMI is an independent nonprofit working to accelerate the clean energy transition. We publish research like this to inform decision-makers and drive real-world impact.
Our work is supported by philanthropy as well as partnerships, including fee-for-service engagements. This support makes it possible for us to share our independent insights for free.
If you find this work valuable, you can support it anytime.
Get more insights like this
Stay up to date with the latest research, analysis, and tools from RMI by opting in to receive occasional emails below. You’ll get new reports, event invitations, and practical insights to help us all accelerate the clean energy transition.
Loading form...
Your download should start automatically. If it doesn’t, click the download button below.
This work is made possible by philanthropy
RMI is a nonprofit supported by donors and partners. Philanthropy enables us to produce independent research and make resources like this freely available.
If you find this report valuable, please consider supporting our work. You can also explore how we partner with organizations to drive impact.
Jump to Section
This article includes a previous version of RMI’s IRA funding analysis. For the most up to date methods, data, and visuals please visit our IRA Funding Potential webpage.
US states are currently in a race to the top to grow their economies. States across the political spectrum recognize that many of the fastest growing sectors are in the clean energy economy. But do they see the scale of the potential? Are they doing enough to secure those benefits? What are they leaving on the table?
States can take different tactics, but the path is the same across the United States: by helping residents, businesses, and organizations take advantage of clean energy incentives, states can create an investment engine that secures federal and private investments and keeps local dollars in the local economy.
This will have tremendous results for communities if they focus on the right areas and capture their full potential. State-specific insights can help them set course in the right direction.
Earlier this year we released the Clean Growth Tool to help regions identify their best potential for manufacturing and industry expansions specific to their resources. While eye-popping investments are important, it’s equally critical to focus on the many opportunities that make things better for individual homes and businesses.
You can view these as federal investments, or you can view them as dollars that stay local instead of being sent to the federal government.
Most of these opportunities come through tax credits. You can view these as federal investments, or you can view them as dollars that stay local instead of being sent to the federal government.
Where is the potential for each state?
Last year, our article “The Economic Tides Just Turned for States” showed the overall potential benefits by state for dollars of federal investment, improved health, and increased jobs, if they ambitiously adopt clean technologies. How much progress have states made in realizing their potential?
States have a long way to go in reaching their full investment potential, but if they focus on the sectors with the most opportunity, they can increase their chances of winning the race to the top. Use of the tax credits is just getting started, so it makes sense that these numbers are (for almost all states) low right now. But most states are also not on track to achieve the full potential, and more work will be needed to realize it.
Nonetheless, data just released from the IRS about the residential tax credits already show that they are popular and have been used by four times more households than predicted.
We’ve now updated the numbers from last year’s analysis of the potential for each state, based on new data, and broken it out by sector to clarify the opportunity.
We’ve also highlighted below the sector with the most federal investment potential for each state. This may help focus states’ efforts on the top potential, although there’s good potential in each of these sectors for most states.
States can access some of these incentives directly (thanks to the new direct pay policies that make tax credits available to governments and tax-exempt organizations), but most of the potential lies with private actions. States interested in securing this investment have numerous options to reach their potential. These include launching administrative programs to support adoption of clean technologies, passing policies that create demand for these technologies to add certainty to the market, and using the convening power of governments to educate and inspire targeted sectors.
States can further assess their own gaps and needs, both in terms of policy contexts and financial stacking potential, as RMI has done for several states. Resources on conducting a stacking analysis and identifying federal funding options can further support these efforts. States have a lot of opportunity to custom build their own financing tools, make it easier for the public to adopt clean technologies, and secure the economic benefits they seek.
For those who already work in a specific sector, this breakdown of the potential by sector can clarify the opportunity in each state.
Here are additional resources to help secure these investments:
- Supportive administrative programs
- One-Stop Shops – guidance to make it easier for residents and businesses to access funding and take action, whether supporting nonprofits, low-income homes, both homes and businesses, or other audiences.
- State Energy Finance Institutions – to help finance cleantech investments.
- Aggregate purchasing programs – to lower costs and encourage time-bound participation, such as Michigan’s extended purchasing program or this guidance for local government renewable energy aggregate purchasing.
- Demand pull policies
- High impact policies for each sector – the economics of cleantech are more accessible than ever, allowing room for state policies to help create demand pull for new markets and reap a host of benefits. This article outlines key policies for each sector to boost market demand.
- Stacking analysis to determine incentive gaps – This can help clarify the existing economic opportunities as well as where some additional incentives may help spur market activity. It can also help inform one-stop shops.
- Convening targeted sectors
- Measure-specific guidance – RMI’s “Maintaining Momentum” article explores building capital stacks and a variety of funding sources for the most common pollution reduction or clean technology measures that 45 states identified in their climate pollution action plans.This excellent resource from the Convener’s Network lists a wider array of measure and other federal funding sources for each.
- Coordinate with GGRF recipients – The Greenhouse Gas Reduction Fund GGRF (GGRF) has put $20 Billion into financial institutions across the country to support cleantech adoption.
Every state wants to build its economic future, and the next few years will determine who is able to best race to the top and bring in the billions.
This work was made possible by generous support from the Rockefeller Brothers Fund and Bloomberg Philanthropies. The opinions and views of the authors do not necessarily state or reflect those of our funders.
Methodology:
This analysis includes the lower 48 US states, and does not include Alaska, Hawaii, and US territories.
CBO Estimates:
The Congressional Budget Office (CBO) released initial estimates of federal spending on IRA provisions in 2022. The first version of this analysis, which was published in 2023, used this data as a baseline. The updated version of the analysis uses data from JCT, released in May 2023, to replace the estimates of certain provisions. The updated government estimates are 71 percent higher than the original estimates. To find state-level estimates for CBO values, we downscaled using state-level data for each provision.
We used government spending projections from 2024 to 2031 to find spending on projects from 2023 to 2030.
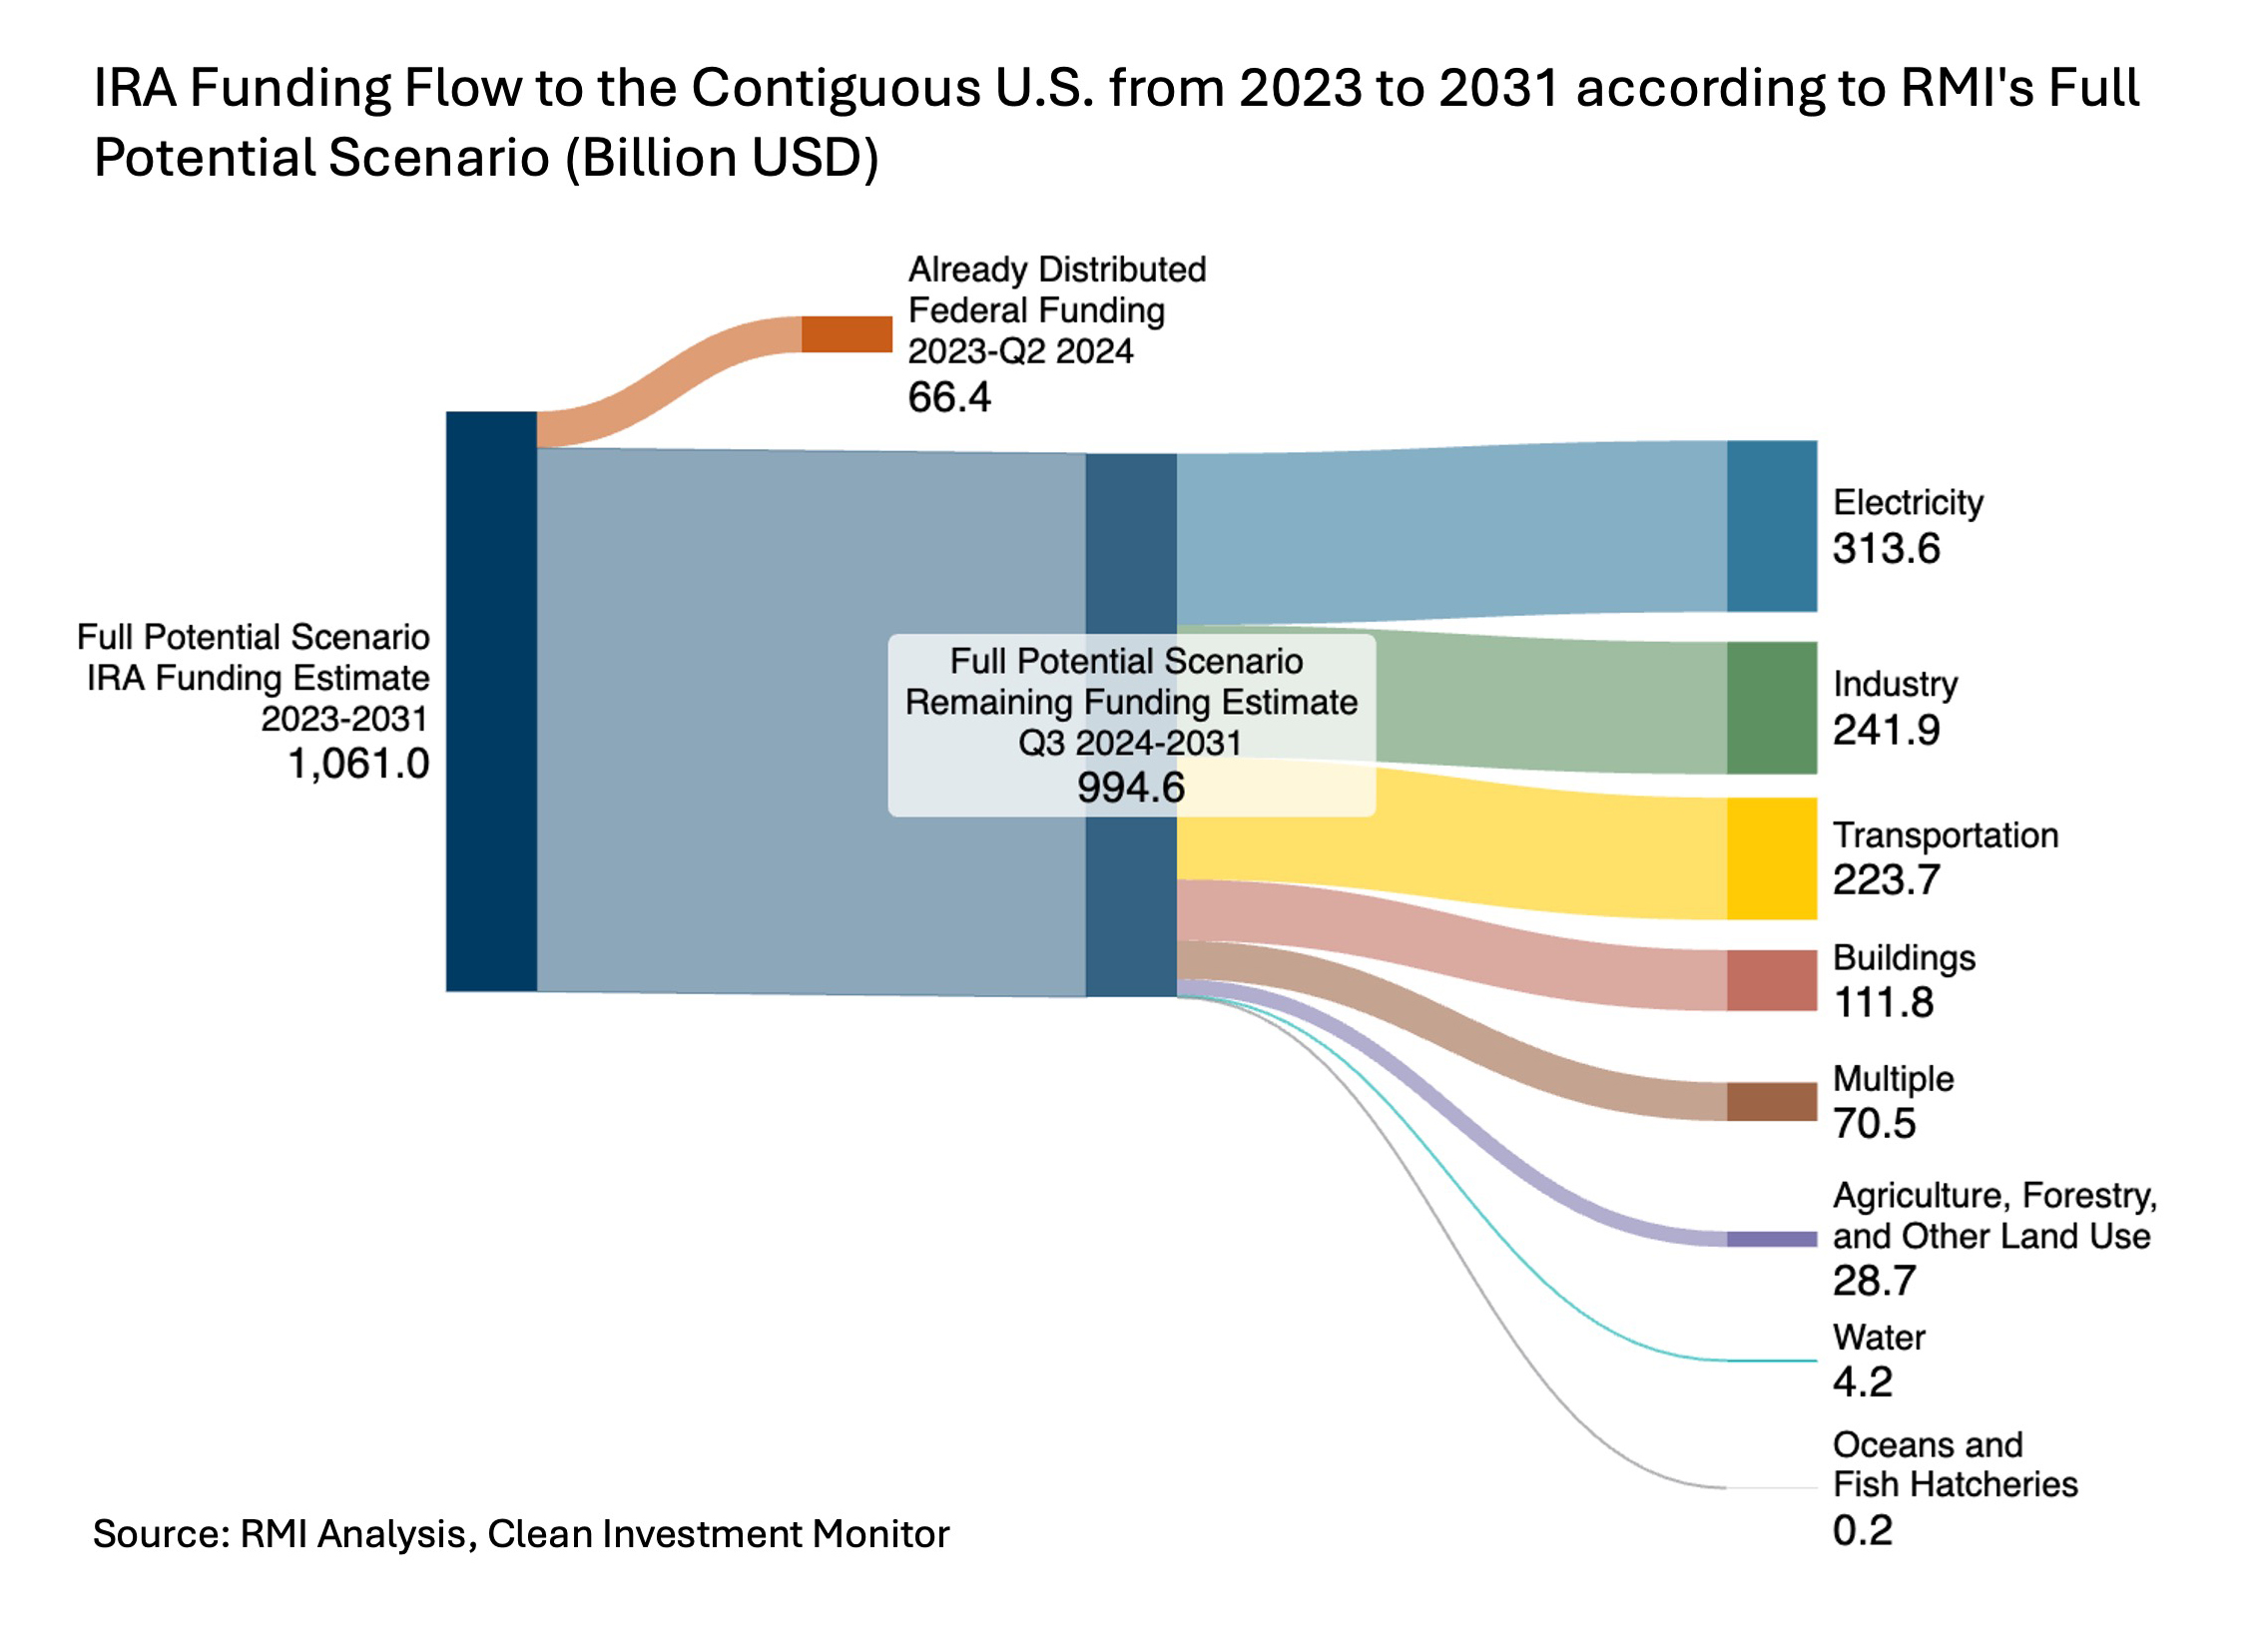
Full Potential Scenario Estimates:
For tax credits, which are not capped, we estimated how much funding would be required if states are on track in 2030 to meet clean energy targets. These values rely on external modeling and internal analysis to determine the number of units required for alignment and the fraction of IRA uptake. If state-level data was unavailable we assumed that clean energy estimates were 1.2 times higher than the updated CBO estimates.
Federal funding so far:
The Clean Investment Monitor tracks federal investments by state and segment, and has released data up until Q2 2024. We used this data to estimate how much funding each state has received compared to our estimates for potential federal funding. We did not include IRA funding that has been announced but not yet dispersed in this analysis. Clean Investment Monitor also tracks quarterly actual investments and has released data from Q1 2018 to Q2 2024. We used this data in aggregate for annual investment numbers.


Related Insights


Help build the clean energy future. Donate today.
Independent research. Real-world solutions. Supported by donors.
RMI can pursue the highest-impact climate and energy solutions because we’re supported by people who believe change is possible. Every gift helps advance the work needed to make clean energy the default choice worldwide.
For other ways to give to RMI, including checks or gifts of stock, please visit Other Ways to Give.
