
Batteries in Phoenix, Heat Pumps in Houston: Here’s Where Cleantech Industries Are Best Poised to Thrive
States and localities want to raise their chances of attracting clean energy investment. Industry leaders want to find the places best suited for scaling their technologies. The Clean Growth Tool helps with both.
The federal Inflation Reduction Act (IRA) has triggered an explosion of clean energy investment in the United States, strengthening the nation’s position in the global clean technology and manufacturing race.
But this race is still in its early stages. To improve America’s long-term outlook in this competition and turn nascent clean energy industries into lasting sources of growth and shared prosperity, incoming investment must be directed to the regions best positioned to prosper from it. This means taking a “place-based approach” to economic policy and presents a huge opportunity to revitalize communities left behind by prior economic and technological transformations.
RMI and the Brookings Institution have developed a free resource — the Clean Growth Tool — that maps out the places where clean energy industries of different kinds are most likely to thrive. This resource shows where clean energy industries can most feasibly grow in communities across all 50 states, given existing workforce strengths and related economic capabilities. It likewise shows the workforce gaps every community must bridge to improve their long-term industrial competitiveness.
Place-based industrial strategy and the American clean energy investment boom
The growth of clean energy investment in the United States in the wake of the Inflation Reduction Act has been unprecedented. Hydrogen projects and battery and solar manufacturing are growing especially quickly thanks to a coordinated “green industrial strategy” that offers powerful investment subsidies, local content requirements, and low-cost financing to domestic producers.
Already, these investments are reaching almost every region of the country. Whether it’s the “battery belt” extending from Michigan to Alabama, hydrogen investments along the Gulf Coast, electric vehicles and solar manufacturing in the Southeast, or sustainable fuels in corn country, the energy transition is offering glimpses of opportunity nationwide.
Yet this boom may be just the beginning. In the United States alone, transitioning to an economy powered by clean energy will require billions of solar panels and battery cells, hundreds of millions of residential heat pumps, and enough transmission lines to go to the moon and back. By matching clean energy industries with their most suitable locations, the United States can improve its competitiveness while bringing economic benefits to communities across the country.
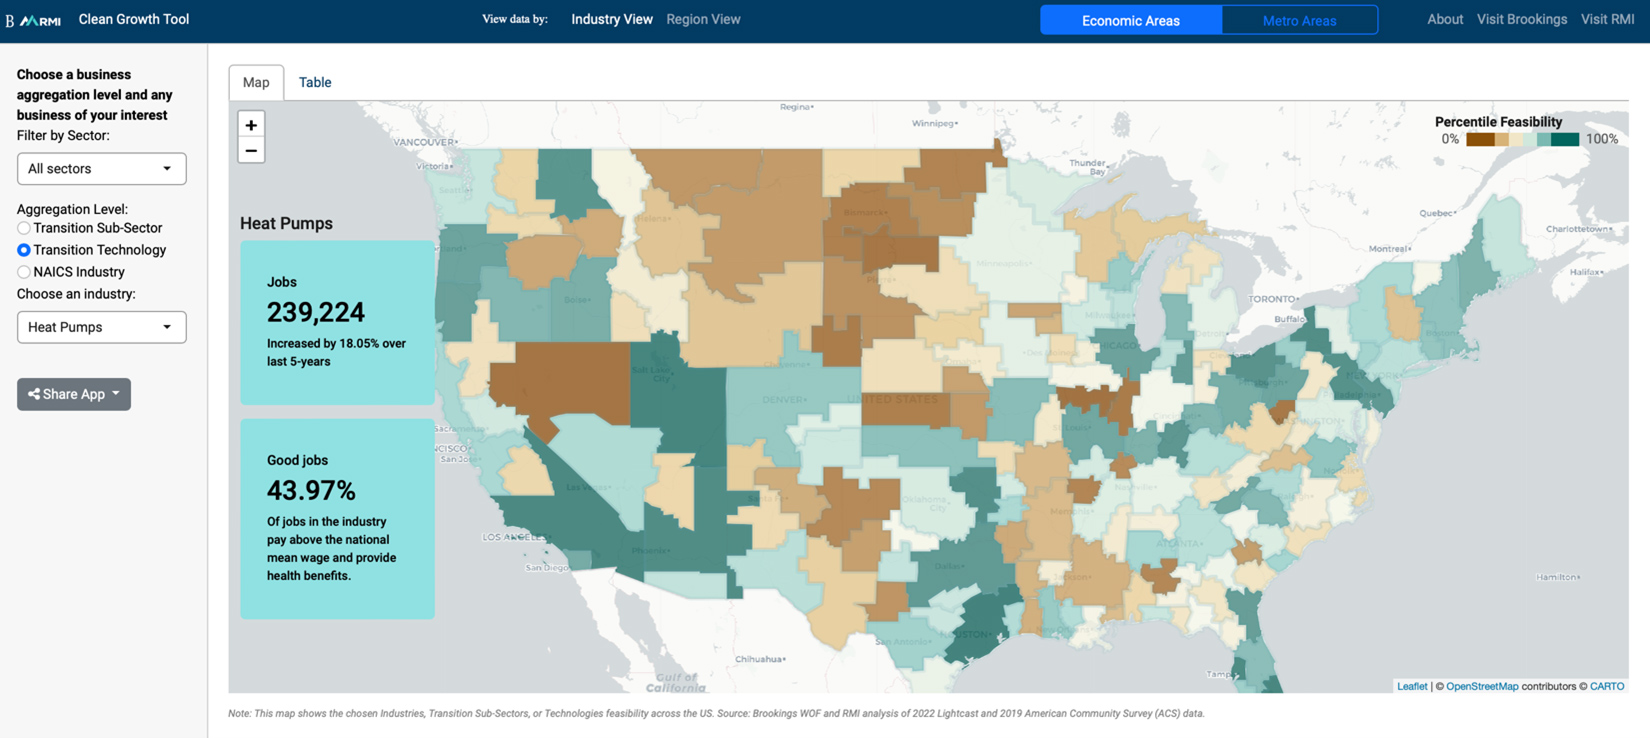
The Clean Growth Tool maps the most feasible places for different industries
The Clean Growth Tool calculates the feasibility of every clean energy industry for each location by noting that if two industries historically tend to locate in the same areas then they must require similar local capabilities. This measure — think of a region’s “feasibility” as similar to an individual’s “transferable skills” — is highly predictive of the industries that will thrive in a location.
With this data, it is possible to highlight the most feasible regions for investment in a range of clean energy industries. The map below shows the top 25 regions (out of 179 total “economic areas” as defined by the Bureau of Economic Analysis) in 12 different clean energy industries.
It is important to note here that while the feasibility metric can predict where industries can thrive from a long-term economic competitiveness standpoint, it measures some factors more directly than others. For example, an area’s feasibility in wind energy production (“wind electric power” in the Clean Growth Tool’s labeling system) is a function of the implicit economic capabilities of a region, especially its local workforce. If there is a high prevalence of industries that typically co-locate alongside wind production, it is likely the area has many of the economic capabilities needed to compete in this sector. However, feasibility in the Clean Growth Tool is not a direct function of natural resource information and, therefore, does not say directly if an area is naturally windy.
The Clean Growth Tool shows that some regions are extremely well-poised to compete in a wide array of industries — where for others, a single or few key sectors loom especially large. Consider the map below (hover over different areas to see different feasible industries for each region):
Encouragingly, most clean energy investment is flowing to the places where these industries are most likely to thrive, as seen below. Two-thirds of clean energy investment flows (including announcements) since 2018 have gone toward the top two quintiles of regions by economic feasibility. This suggests that most clean energy investment is going to be able to tap into the local workforce, supply chains, and know-how of these communities, not only providing a robust source of economic development but also putting these industries in the best position to be competitive globally.
Regional industry feasibility is especially important in the context of advanced manufacturing. Regions with strengths in advanced manufacturing and technological innovation that apply their talents to the energy transition can drive down technology costs, enable productivity spillovers, and open new export opportunities. That’s why the United States can successfully compete in manufacturing — not just in emerging technologies such as clean steel but also in widely deployed ones such as solar, as there’s still ample room for innovation.
By directing the right investments to the right places, we can enable this growth. The map below highlights post-IRA cleantech manufacturing investments located in high-feasibility regions for the relevant technology.
The Clean Growth Tool reveals economic potential in energy and disadvantaged communities
There is also a question of whether clean energy investment goes not only to where it’s most feasible but also to where it’s most needed. Many federal government clean energy initiatives explicitly direct public spending and private investment toward communities that suffer from inequities of place, race, and class. Although more investment is going toward these communities since the passage of the IRA, it remains a relatively low share overall.
One way these communities can reduce the gap is through industry prioritization based on economic feasibility, as outlined in the Clean Growth Tool. For example, at least two-thirds of the $6 billion Advanced Energy Project Credit (48C) must be allocated to energy communities that have disproportionately suffered from the transition away from fossil fuels. Using the Clean Growth Tool, these communities can identify the 48C-eligible industries to which they have the strongest feasibility of transitioning their existing economic capabilities, as shown below for heat pump manufacturing.
The regional view: workforce development
Attracting and retaining companies requires all sorts of proactive investments in built infrastructure, clean electricity, site preparation, and, perhaps most importantly, workforce development. The Clean Growth Tool’s regional view can help communities identify their priorities and skills gaps.
The regional view captures strategic opportunities for a particular economic area (EA) or metropolitan statistical area (MSA). Economic developers, policymakers, and community leaders across the country can choose their region in the Clean Growth Tool, identify the most feasible industries for that area to transition into and build a workforce development plan in target industries.

The workforce development plans highlight key occupations in different industries and the relevant presence of those occupations in an area, as shown below for the Grand Rapids-Muskegon-Holland region in Michigan, for battery and components manufacturing.
Example: Planning for regional industry clusters
Economic developers can use the tool to better understand what sort of industrial cluster could progress in their region. Parts of South Carolina and Georgia, for example, have seen some of the most cleantech investment in the country, relative to their local economies, thanks to a series of major new manufacturing projects in the solar and EV supply chains.
The region performs relatively well across these industries in the feasibility measure, with the Charleston, S.C, area ranked 19th nationwide in the feasibility of manufacturing low-carbon vehicles and the Columbia, S.C. area 23rd for producing batteries and related components out of 179 nationwide. This suggests these projects will be able to draw on the expertise and capacities of related industries in the region. As a result, it is more likely these investments will lead to greater job growth and productivity spillovers.
On the other hand, a region that has yet to experience significant clean energy investment can use the tool to see where they should be targeting future economic development activities. For example, Charleston, W.Va., has seen only $14 million worth of clean energy investment announcements over the past two years, which is 139th among the 179 economic areas.
The Charleston area specializes in, among other things, iron and steel manufacturing, aluminum processing, pipelines, and basic chemical manufacturing. The Clean Growth Tool shows Charleston outperforming in its feasibility to transition into industries like low-carbon chemical production, green hydrogen, low-carbon iron and steel, and carbon dioxide removal, and may therefore benefit over the longer term from early investments and policy reforms targeting these sectors.
The industry view: transition feasibility in a national context
While many users will only be interested in their own city or region’s prospects in the energy transition, other stakeholders are more likely to have an industry-specific perspective. The Clean Growth Tool’s industry view shows comparative feasibility scores for all 283 industries relevant to the clean energy transition, as well as aggregated categories for 62 clean energy technologies and 26 subsectors.
The tool also provides other indicators that may be useful for investment siting decisions, such as the region’s “complexity,” an indicator of state-level climate policy stringency, the generosity of state-level economic development incentives, and a variety of economic development and socioeconomic variables. A project developer, site selector, or policymaker can use the tool to better understand where related capabilities are distributed across the United States when deciding on an investment or policy decision related to a given industry and download the entire database to support their own site selection decisions.
Industry transition feasibility is just one of many factors an investor or policymaker may want to consider when planning policy or investment decisions. Feasibility is more likely to be of interest to policymakers considering longer-term economic development impacts, since it is predictive of overall job growth in a region, while an investor is more likely to consider factors impacting short-term profit margins, such as labor, land, and electricity costs, or the size of local tax incentives.
Unfortunately, these two sets of motivations often lead to a very different set of results. To illustrate this, the Clean Growth Tool includes a Policy Index that captures policy-relevant indicators such as feasibility, climate policy, poverty, household income, and renewable energy production; as well as an Investor Index that uses data on local specialization, tax incentives, tax rates, and labor, land, and energy costs.
The figure below shows the roughly $100 billion in battery manufacturing investments made or announced since 2018, plotted against these two indices, showing that there is sometimes a tension between short-term private investment incentives and long-term economic development goals. Another way to think about it is that we are more likely to maximize the efficiency and equity of clean energy investments if they are in places that perform well on each index for a given industry, denoted by the green quadrant in the figure.
However, only 29 percent of battery investments have gone into one of 28 regions that perform in the top-half for each index, showing the need for more equitable and efficient place-based approaches. Regions outside the green quadrant can still develop robust battery manufacturing hubs but have broader challenges in terms of improving their overall competitiveness and/or policy landscape.
Breaking down information barriers
The Clean Growth Tool can play a role in breaking down the information barriers that inhibit clean energy investment. With this data, policymakers can better understand their own opportunity landscape and target the emerging clean energy industries that could drive growth and workforce gains into the future, while identifying investment barriers that need to be addressed to take advantage of those opportunities. Meanwhile, investors and their advisors can use this information to better assess the medium-term economic impacts of their location decisions. Each side of this equation has a critical role, and considering multiple factors and motivations when making decisions can create better opportunities for everyone.
Additional charts and graphs (new charts added August 1, 2024)
For more on the Clean Growth Tool, visit the Clean Growth Tool resources.