Learn how we are working to transform how we use and produce energy.
The Value of Green Hydrogen Trade for Europe
How the EU can get its hydrogen market started on the front foot.
Why we share this work for free
RMI is an independent nonprofit working to accelerate the clean energy transition. We publish research like this to inform decision-makers and drive real-world impact.
Our work is supported by philanthropy as well as partnerships, including fee-for-service engagements. This support makes it possible for us to share our independent insights for free.
If you find this work valuable, you can support it anytime.
Get more insights like this
Stay up to date with the latest research, analysis, and tools from RMI by opting in to receive occasional emails below. You’ll get new reports, event invitations, and practical insights to help us all accelerate the clean energy transition.
Loading form...
Your download should start automatically. If it doesn’t, click the download button below.
This work is made possible by philanthropy
RMI is a nonprofit supported by donors and partners. Philanthropy enables us to produce independent research and make resources like this freely available.
If you find this report valuable, please consider supporting our work. You can also explore how we partner with organizations to drive impact.
Jump to Section
The EU will soon be the first global market to demonstrate how importing hydrogen (H2) can help accelerate decarbonization and promote energy security — if it can mobilize additional support for procurement and end use while strategically deploying green fuel to areas where it’s most needed.
Introduction
The EU set one of the most ambitious hydrogen deployment targets in the world in March 2022 when it published REPowerEU. To rapidly transition away from Russian fossil fuels, the European Commission (EC) announced its strategy to import 10 million tons of renewable hydrogen by 2030, for use in heavy industry and transport sectors that are traditionally reliant on coal, natural gas, and oil. In setting this goal, the EU recognized the value of importing green hydrogen — derived from international renewable energy resources — to complement its domestic supply and free up renewable power resources for direct electrification. Later, by requiring in its Renewable Energy Directive that 42.5% of all hydrogen used by industry be green in 2030, the EU signaled that firm demand for green products will rise rapidly over the next half decade.
Project developers all over the world took notice. First movers — including many EU-headquartered developers seeking to capitalize on export opportunities — are planning green hydrogen production facilities on nearly every continent, targeting off-take agreements with European end-users. Gigawatt-scale projects designed to supply Europe with green hydrogen imports are getting closer to final investment decisions (FIDs) — but a few crucial policy gaps are stalling the activation of green hydrogen trade.
To meet its decarbonization targets, the EU should strengthen regulatory signals that it will take advantage of renewable hydrogen import opportunities and continue to leverage imports in its long-term energy transition strategy. The EU has made substantial progress establishing support mechanisms for global hydrogen suppliers, setting targets for green fuel deployment in industry and transport, and instituting programs to offset green premiums for end-users. But it needs to further fund these incentive schemes to accelerate fuel switching.
The EU has committed to procuring and distributing renewable hydrogen imports for European end-users, but it needs to ramp up infrastructure investments at ports and around industrial sites while clarifying rules governing infrastructure access. The EC has set clear rules on how hydrogen products can qualify as “renewable” within the bloc, but it needs to rapidly endorse clear certification schemes and synchronize verification conditions with its carbon market requirements to mitigate uncertainty and bureaucratic burden for prospective suppliers.
1. The Value of Imports
The EU — especially Northwest Europe — will need hydrogen imports to meet green fuel demand in 2030 and beyond. Several key trading partners are well positioned to deliver competitive early supplies.
The EU has advanced its green hydrogen policy since the passage of REPowerEU, rallying Member States to mobilize funding to support early procurement. Imports remain crucial to the EU’s hydrogen strategy, with good reason: although Europe has the motivation and funds to deploy new renewables within its borders, development can be stalled by land use restrictions and long grid-connection queues. New renewables that do come online are needed to enable direct electrification of the EU’s power grid, buildings, and road transport. To reduce domestic demand for renewables from heavy industry and heavy transport, the EU can tap into cheap and abundant renewable energy produced abroad — by importing and distributing green hydrogen to industrial end-users clustered around ports. Via imports, European manufacturers gain access to a secure, reliable green energy supply, enabling fuel switching without disruption and without needing to siphon off constrained renewable power from the region.
An assessment of green hydrogen supply projections for Europe confirms that in 2030, many renewables-constrained Member States will not be on track to meet local demand with local supply. Exhibit 1 shows that when evaluating projected hydrogen demand of EU Member States against their respective domestic project pipelines, nearly all countries will fail to meet demand via domestic production alone in 2030. Even if intra-European trade develops, significant supply gaps will remain. Heavy industry and transport players will be pressed to meet decarbonization targets, requiring them to source products from outside their borders.
Exhibit 1: Gap between projected demand for green hydrogen in EU Member States and expected supply (based on announced projects) in 2030
Megatons per year (Mt/y)
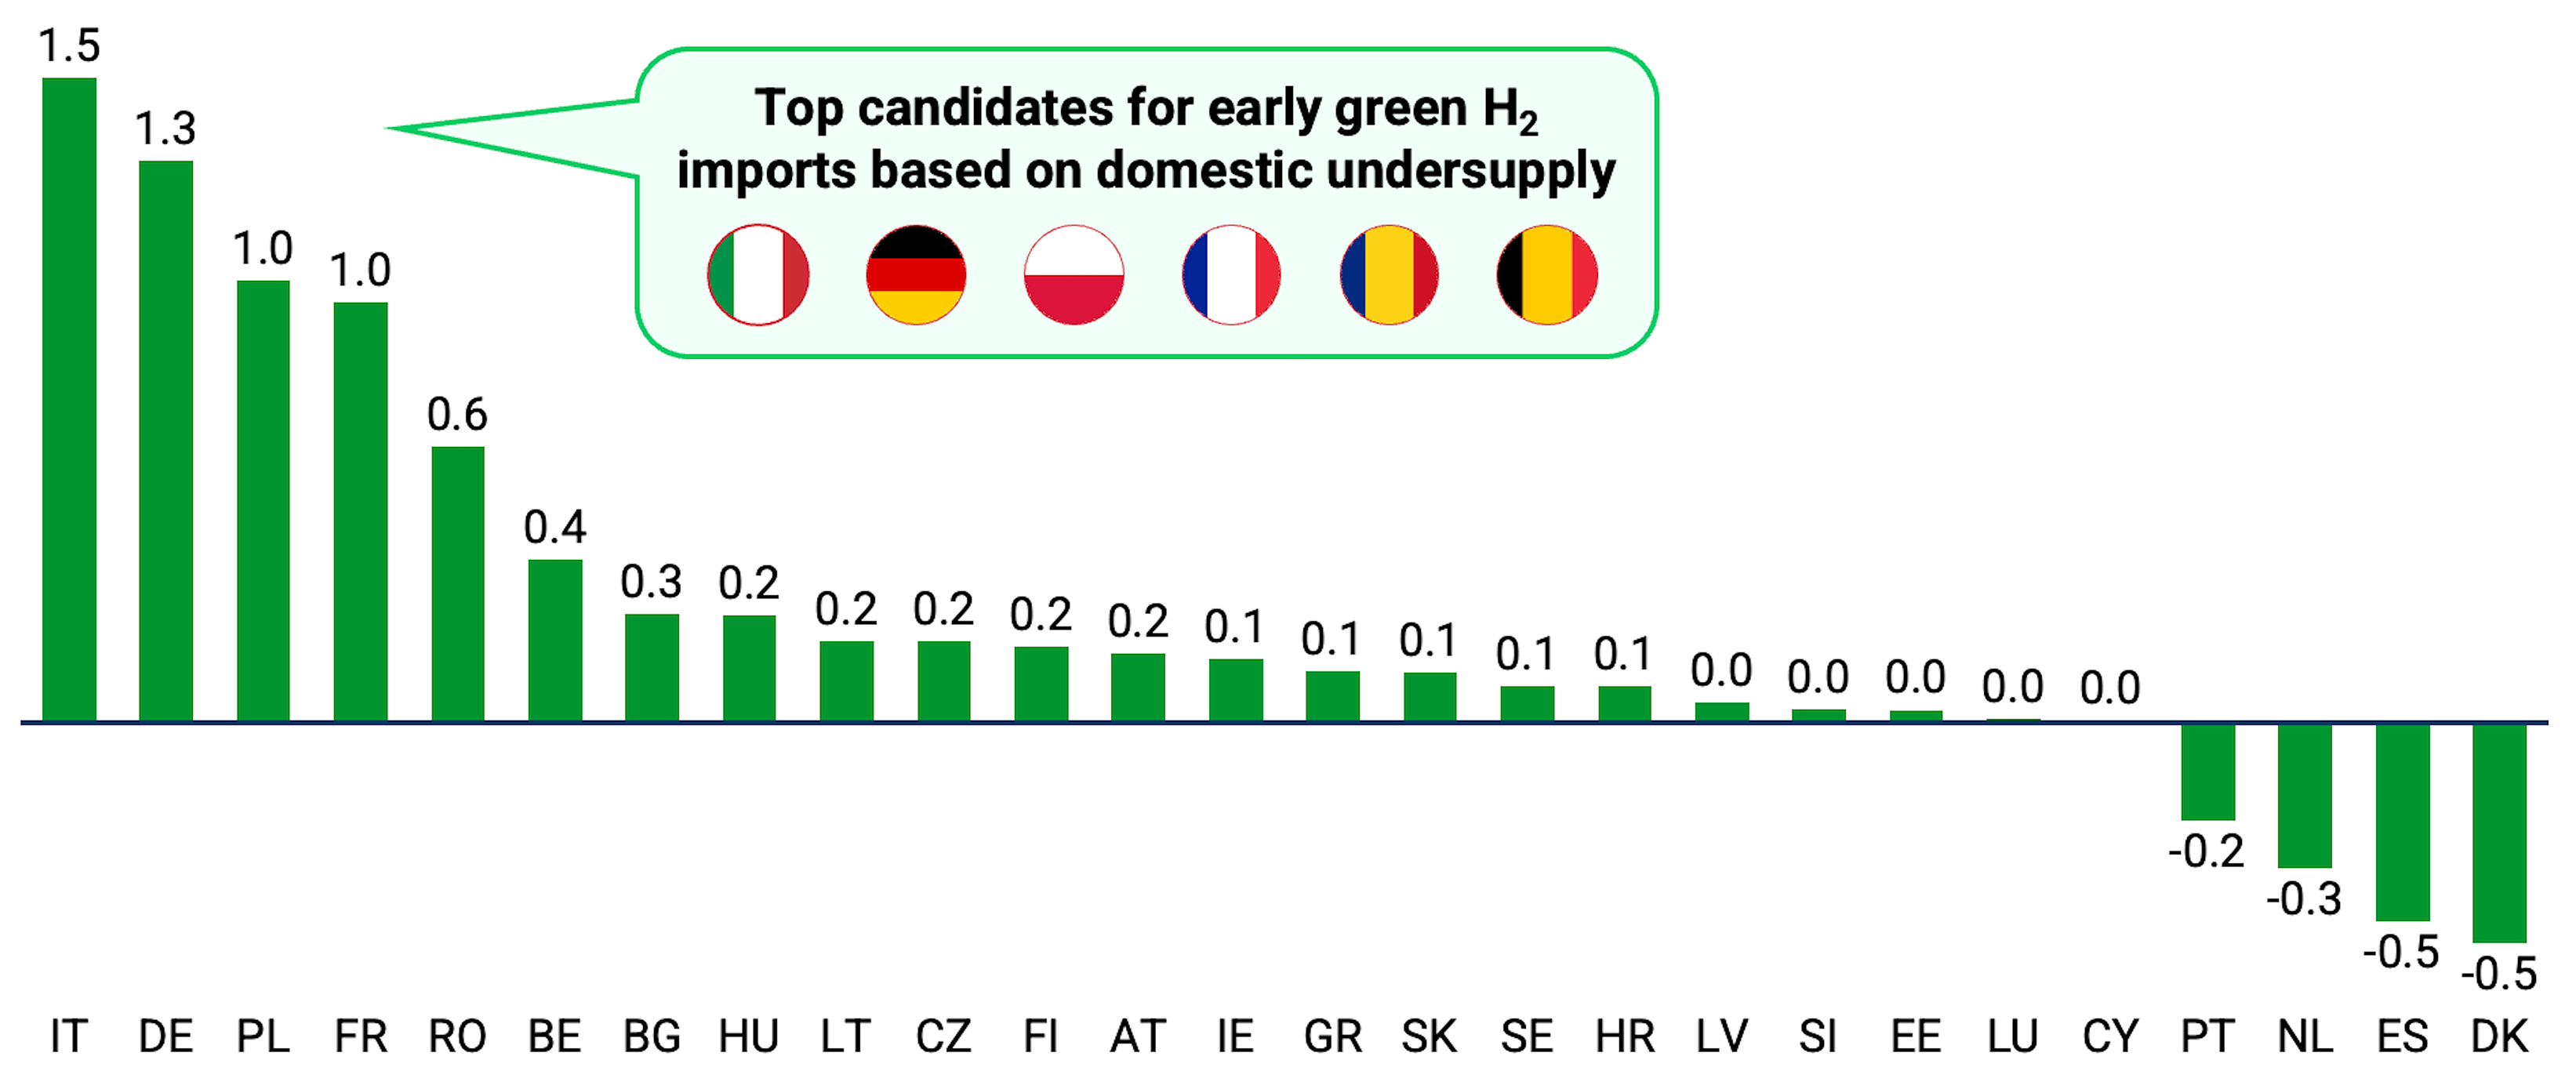
Note: Demand and supply projections adapted from Rystad (2023) “mean” demand scenarios (which project 12.96 Mt/y hydrogen demand across the EU 27 by 2030) and IEA hydrogen project pipeline (2022) (which projects 6.77 Mt/y hydrogen supply from projects in advanced planning stages by 2030).
RMI Graphic. Source: Rystad Hydrogen Cube, IEA Hydrogen Production and Infrastructure Projects Database, RMI analysis.
The EU will have its choice of international suppliers, given the range of interested parties developing export-oriented projects in Australia, Southeast Asia, Africa, the Middle East, and North and South America. Several countries have formally agreed to provide green hydrogen to specific EU Member States through early exports, and the EU can diversify its energy import reliance by working with multiple prospective suppliers to procure renewable fuel.
Prospective supplier countries share a common characteristic: inexpensive renewable power will drive down the cost of hydrogen production within their markets to levels competitive with the cost of domestic production in Europe. Because hydrogen production costs are primarily determined by levelized electricity costs (LCOE), countries like Chile and Australia with optimal solar and wind conditions can offer Europe a supply at very low base costs. Parts of the United States with similarly optimal conditions will also benefit from government support for renewable hydrogen production, allowing suppliers to ship green hydrogen (converted first to ammonia) to Europe at the lowest base cost globally.
Production costs of green hydrogen abroad will not translate directly to end-user cost of hydrogen in Europe. Storage, ammonia (NH3) conversion, transportation, offloading, and re-conversion costs will stack with production costs, resulting in a “landed cost” for renewable hydrogen arriving in EU ports. These costs can be reduced by achieving economies of scale across ammonia transport, synthesis, and cracking processes.
Exhibit 2 maps the base landed cost of green hydrogen sourced from prospective supplier countries against hydrogen market “readiness” within these countries. Candidate suppliers vary in their readiness to move: companies in Saudi Arabia, for example, are already constructing an export-oriented project and have partnered with European off-takers and owners of existing ammonia export infrastructure. In contrast, Algeria has not yet advanced concrete hydrogen production projects, despite its stated aspiration to provide hydrogen to Europe. Market export readiness combined with landed product costs will determine which suppliers can provide the most secure and least expensive supply to European end-users by 2030.
Exhibit 2: Green hydrogen exports targeting EU markets in 2030
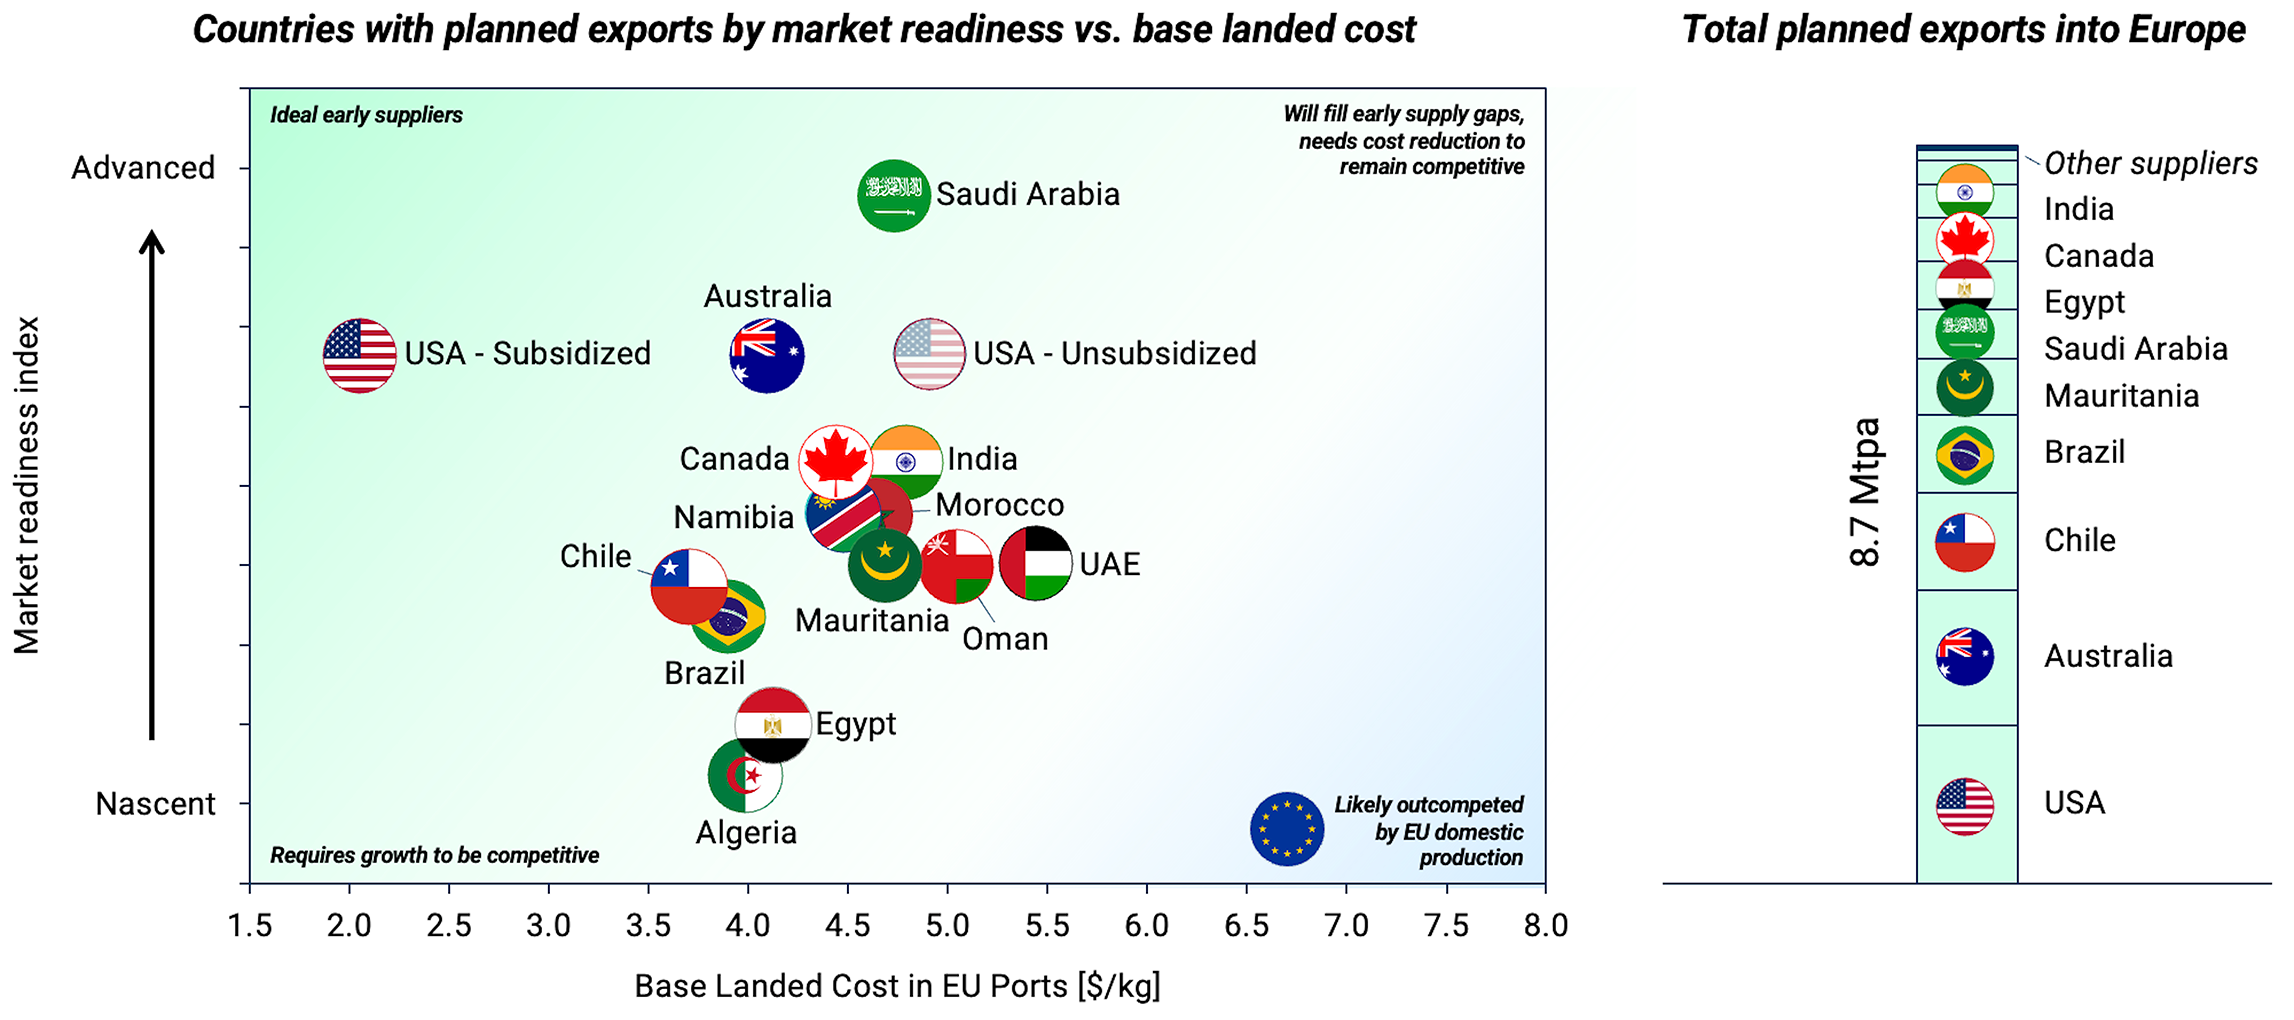
Note: Market readiness evaluated using an index based on most advanced project status, existing and planned export infrastructure, and the presence of bilateral agreements between countries. Export volumes based on analysis of individual projects in each country’s project pipelines and evaluation of country-level export ambitions. Base landed costs do not account for margins incorporated across the hydrogen value chain. Algeria’s bubble is for representation only; it has no planned projects as of Q3 2023.
RMI Graphic. Source: RMI analysis, IEA Hydrogen Production and Infrastructure Projects Database, analysis of planned project press releases
Notes on Hydrogen Cost Modeling
This paper presents technoeconomic analysis and top-down modeling on costs across green hydrogen trade value chains. Our analysis considers hydrogen production systems that will reach FID around 2030, once the green hydrogen industry has matured significantly. The levelized costs of hydrogen production, storage, transport, and conversion calculated here will vary from the costs realized by project developers, especially while the industry remains in the early stages of development.
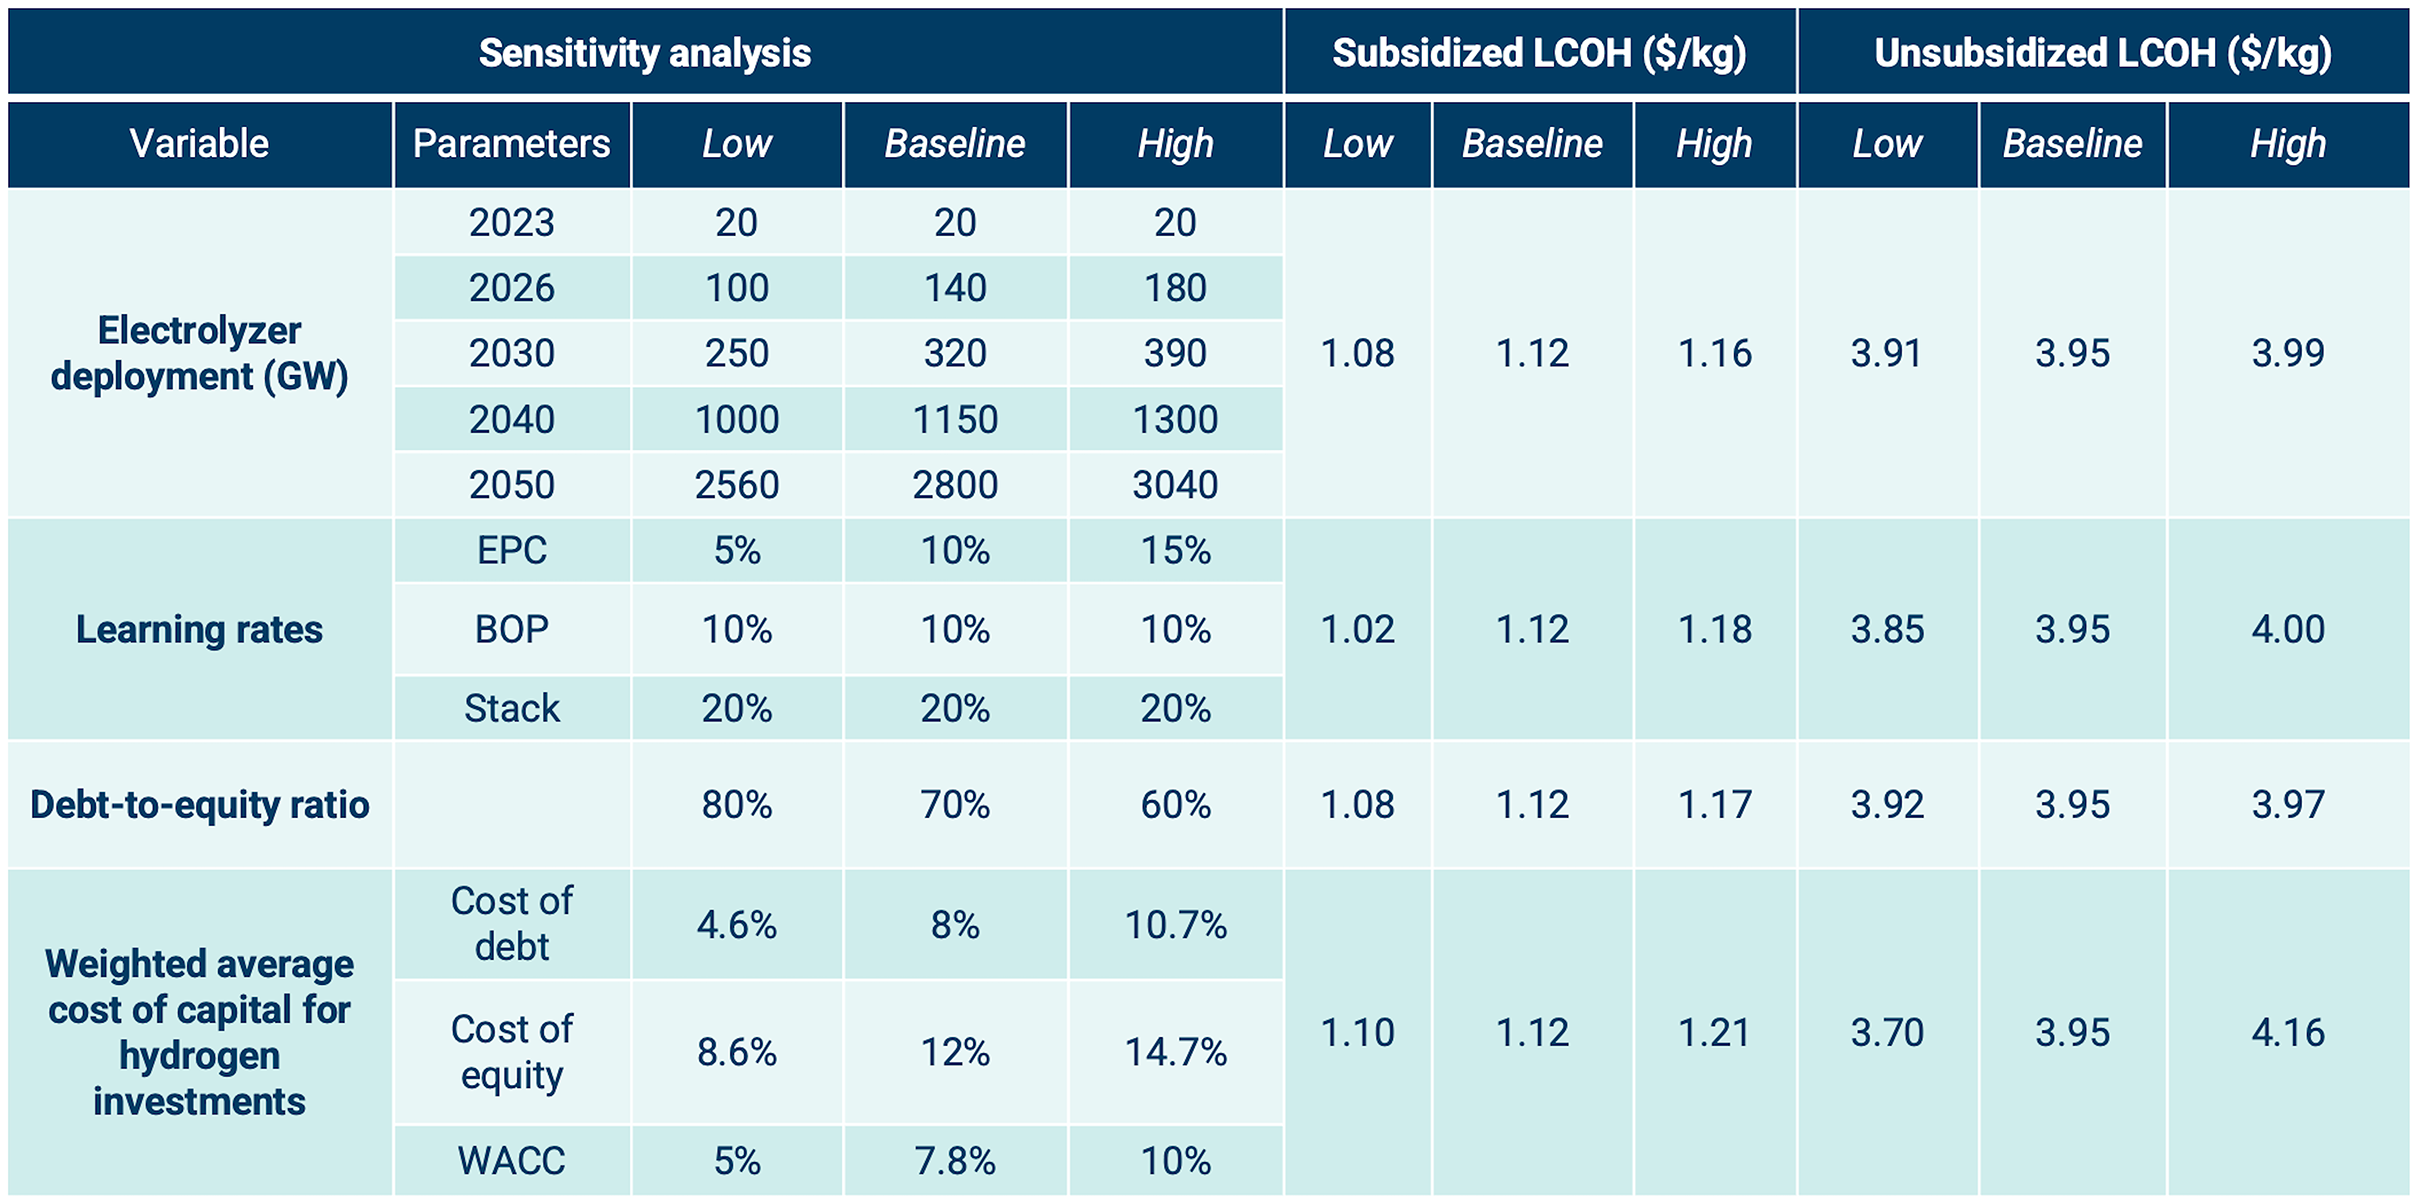
Learning rates for electrolyzer systems will largely determine how quickly the landed cost of hydrogen (LCOH) falls over time. Pace of learning and cost decline will in turn depend on the quantity of electrolyzers installed over time. Exhibit 3 shows how different assumptions on electrolyzer capacity buildup and learning rates can affect final LCOH calculations.
Our model does not account for dynamic project financing parameters that will affect the final cost of hydrogen for producers and consumers. We’ve calculated landed costs by assuming a steady, baseline set of financial parameters that will determine how project developers secure access to capital, ultimately determining the LCOH they can achieve. But different project financing structures will yield different costs of hydrogen. Exhibit 3 also shows the impact on LCOH of different debt-to-equity ratios and weighted average cost of capital (WACC) assumptions for electrolyzer projects.
Exhibit 3: Levelized cost of hydrogen sensitivities across technological and financial parameters for an archetypical production plant in the Port of Houston, 2030
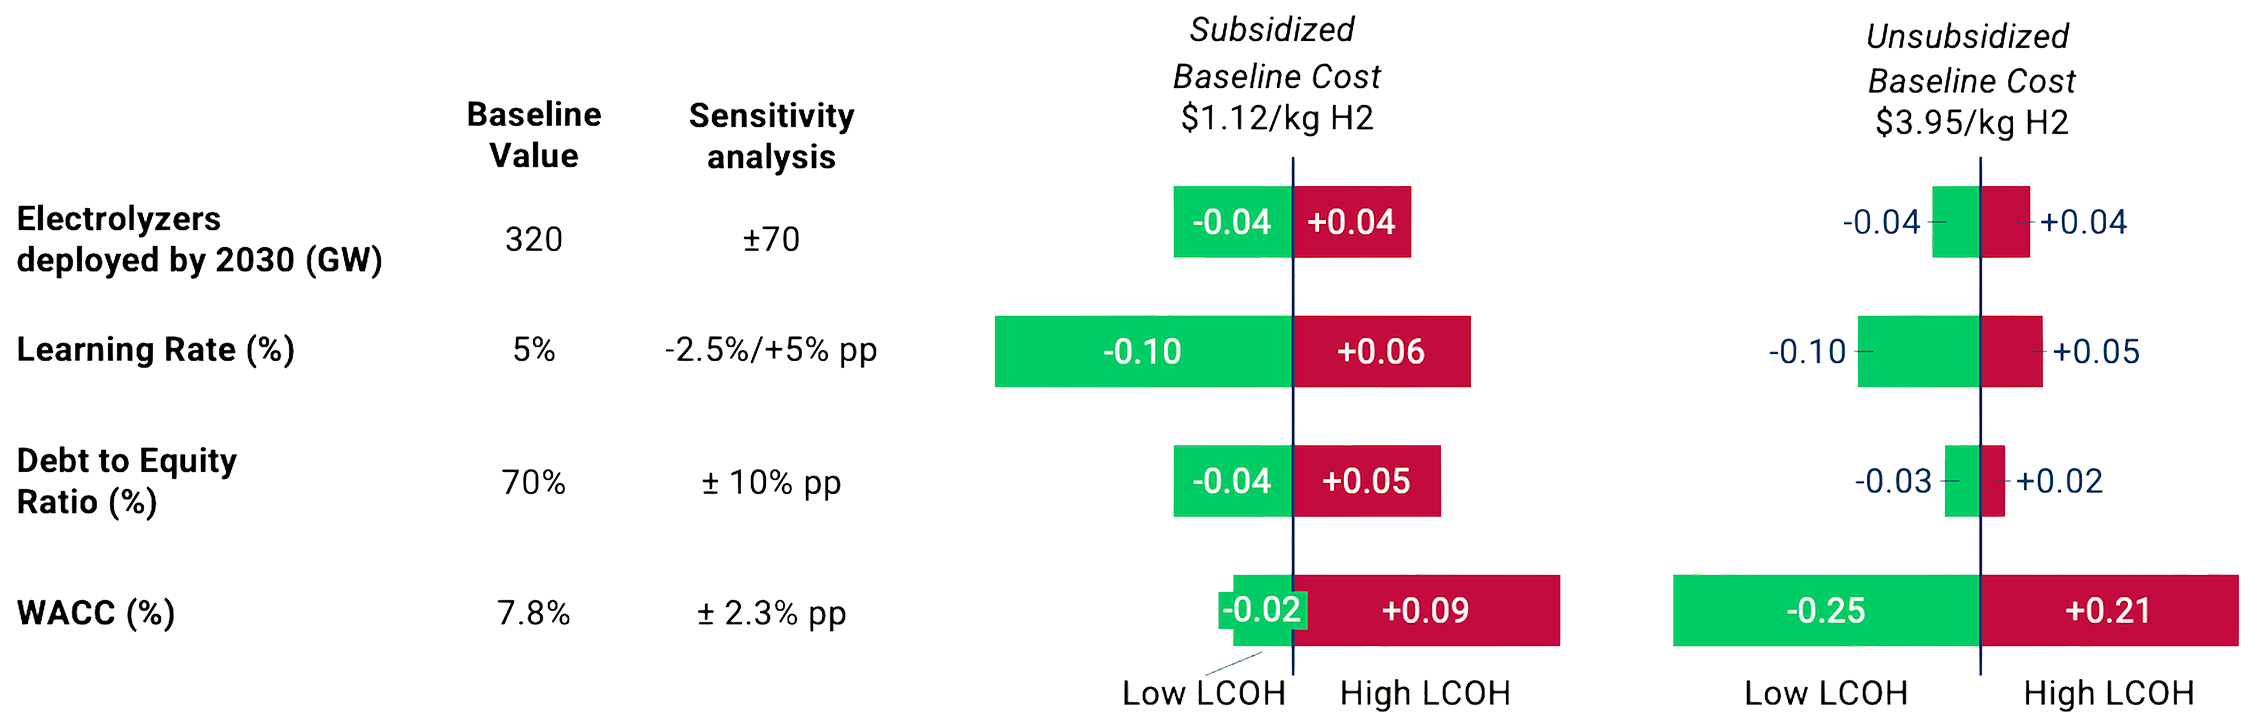
Further details on this sensitivity analysis and on our cost modeling are included in the Appendix. The model analyzes the dynamics of a behind-the-meter plant (not connected to grid power) that is required to produce a constant supply of green hydrogen. This constraint drives plants to build up renewables and storage sufficient for continuous production over the course of a typical year.
Our model does not consider margins that will be incurred across the hydrogen supply chain from the region of production to the country of import in the EU. Realized costs will include profit margins largely dependent on supply and demand dynamics that are still evolving and therefore difficult to estimate. And the model does not capture project-specific implementation costs, like the costs of complying with regulation or legal fees, or the costs of drawn-out permitting processes. The cost of delivered electricity for a project will depend on site location and commencement date and can cause the levelized cost of electricity for hydrogen production to vary widely. Similarly, engineering, procurement, and construction (EPC) costs will vary by project and will evolve as green hydrogen deployment scales.
Although electrolyzer deployment is still nascent, technology integration cost risks will persist for first-mover projects. First-mover developers are still managing risks by leveraging custom contract structures and EPC warranties, which directly affect the point-of-sale costs they can achieve. Policymakers can help mitigate price risks for developers and off-takers by allocating public support dynamically, recognizing that product costs will fall over time as global hydrogen markets reach economies of scale.
Ultimately, the EU will need to import renewable hydrogen from multiple partners to ensure a secure supply of green energy for heavy industry and transport. The most ambitious potential suppliers, such as the United States and Australia, are mobilizing to export about 2 Mt/y to Europe in 2030, indicating that supplies from other markets will prove critical in meeting expected demand. By importing renewable hydrogen from a range of suppliers with high degrees of market readiness, the EU can procure a steady supply of green fuel without risking its energy security, while benefiting economically from lower-cost international imports. As green hydrogen markets mature in Africa and South America, Europe can further diversify its fuel imports by working with new suppliers closer to home.
In the short term, the United States is well positioned to supply Europe with low-cost green hydrogen by 2030. The US Gulf Coast, notably, is investing in hydrogen storage and conversion infrastructure to enable trade, leading to a high degree of export readiness. Meanwhile, tax credits recently passed under the Inflation Reduction Act (IRA) — for production of clean hydrogen (Section 45V) and for clean electricity production (Section 45Y) — will provide substantial rewards to US producers. Combined credits will effectively decrease the levelized cost of green hydrogen over the lifetime of a new plant that reaches FID in 2030 by an estimated $2.83/kg, according to our analysis. As a result, US exports that arrive in select European ports by 2030 will be cheaper than local production, even compared with projects that receive EU subsidies from schemes like the European Hydrogen Bank (EHB) (see Exhibit A1 in the Appendix).
Exhibit 4 shows that in 2030, green hydrogen imported into undersupplied European ports from the US Gulf Coast will be cheaper than locally available products. A reliable supply of lower cost green hydrogen from the United States (and other supplier countries) will incentivize faster fuel switching in heavy industries clustered around ports, solidifying demand and necessitating expanded investment in new infrastructure for hydrogen storage and distribution. These investments will drive down costs for local European hydrogen producers, which can build up their operations while industry and transport players capitalize on early lower-cost imports.
While domestic hydrogen production scales, renewable power prices in Europe will stabilize and electrolyzer costs will fall. Imported hydrogen can then be deployed strategically across the bloc as a low-cost complement to domestic products, procured according to regional need.
There are several European countries — Germany, the Netherlands, and Belgium — where imports will remain competitive with local green hydrogen products and could play a strong role in addressing supply gaps. Imports will continue to represent a reliable green fuel supply for industrial hubs clustered around ports in Northern Europe, where land constraints will generate ongoing competition for renewable power. The region will benefit from developing green hydrogen import infrastructure so it can consistently leverage international products to bolster long-term energy security for its industries, which will drive some of the highest levels of demand for green hydrogen in Europe.
In contrast, Southern Europe will benefit significantly from local hydrogen market scaling and technology cost reduction over time. Spain and Portugal, by exploiting low-cost solar and wind power, will produce domestic green hydrogen at lower costs by the mid-2030s, outcompeting even subsidized imports by 2040. Their products can be deployed to meet local demand or be transported via pipeline to reach nearby EU markets where green hydrogen supply gaps are expected to persist.
Exhibit 4: Cost difference between domestically produced and imported green hydrogen from the US Gulf Coast to select EU ports, 2030–40
$/kg
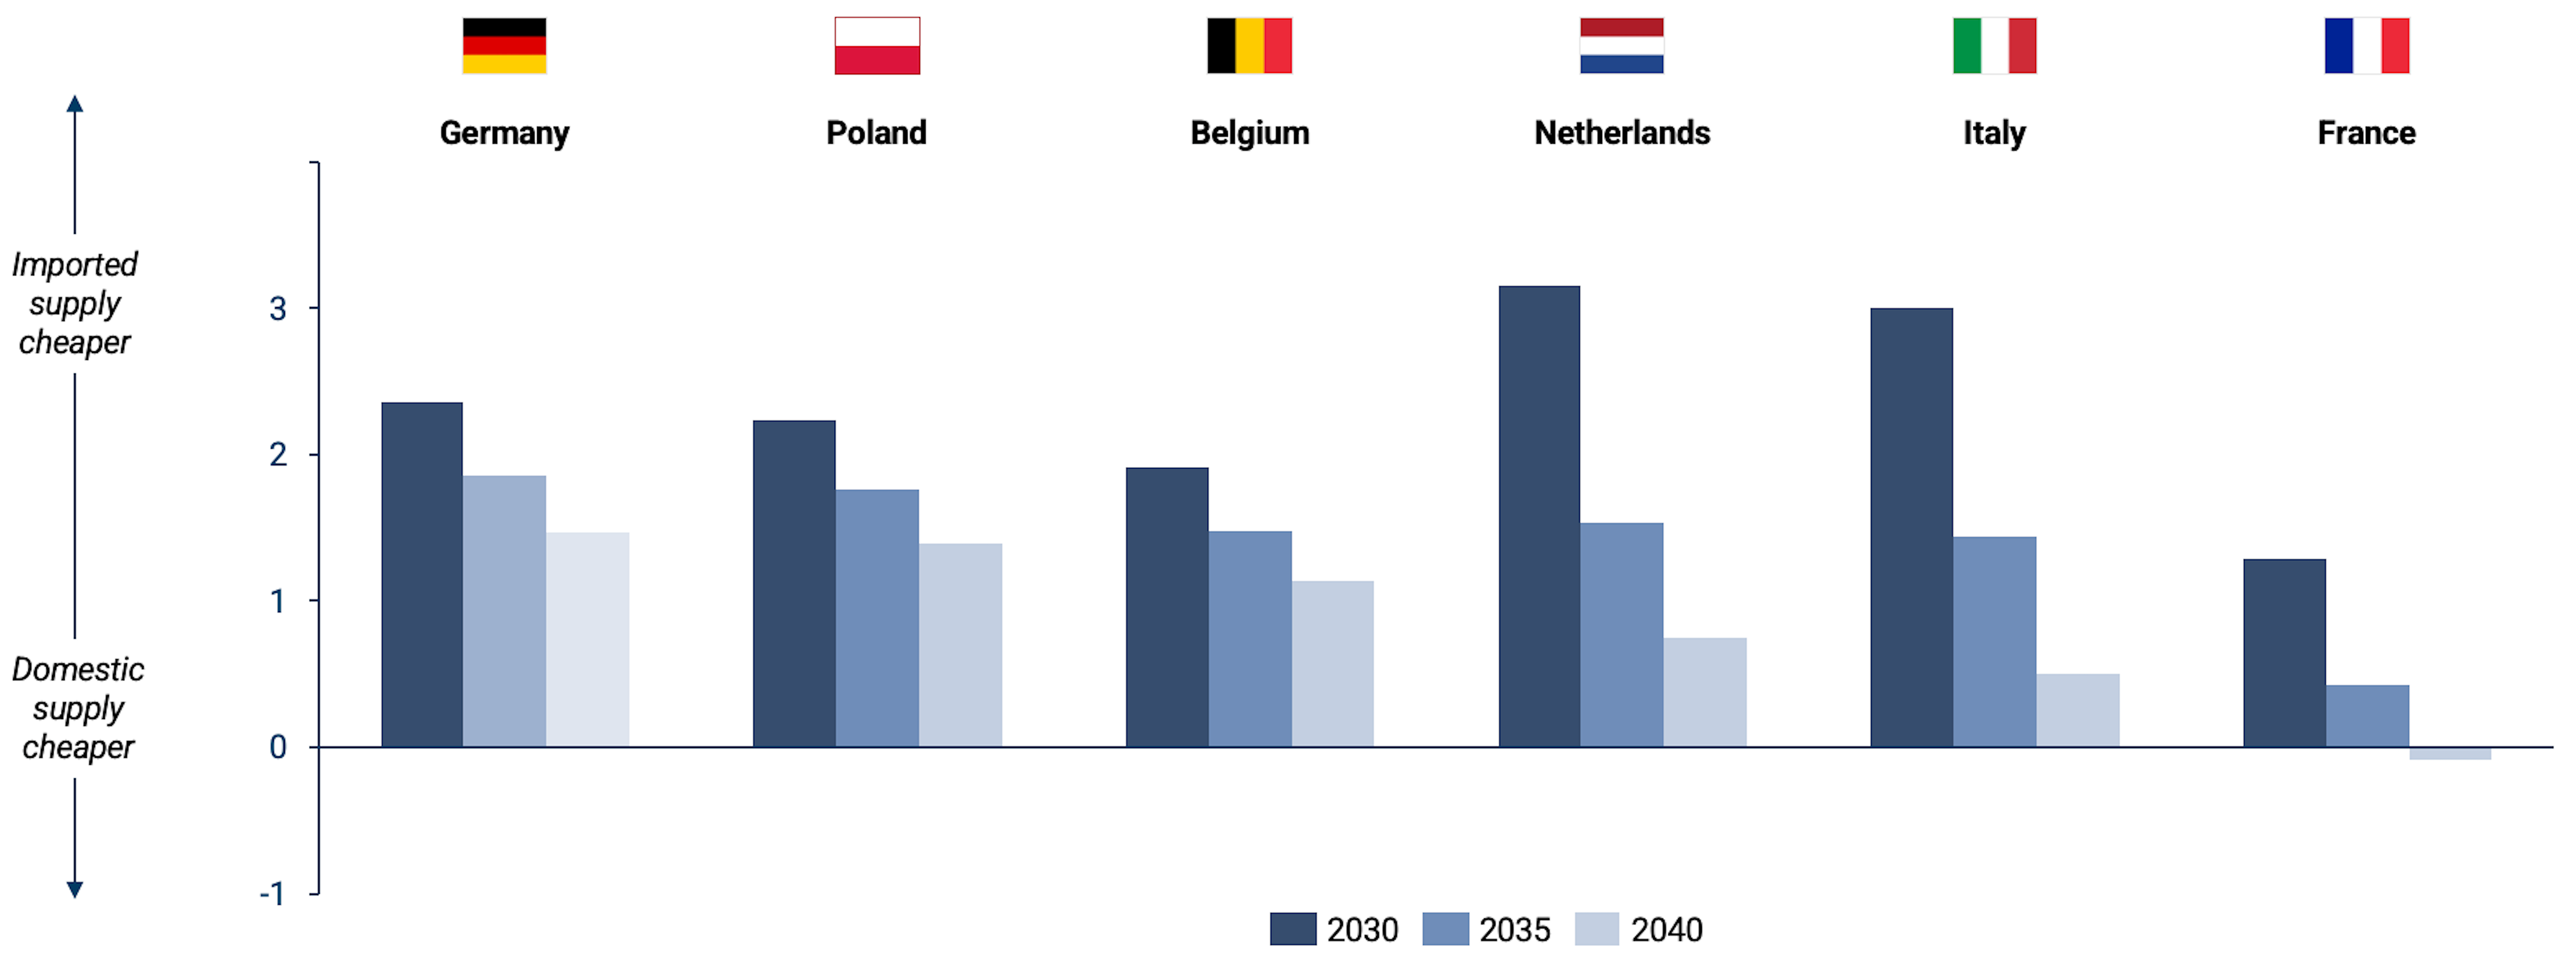
Note: Costs account for the impact of subsidies in the United States (IRA) and in the EU (early EHB auctions). Archetype for US exporter: production plant of 200,000-tons of H2/year, geologic salt cavern for storage, with a 30-year lifetime, receiving full benefit of IRA Sections 45Y and 45V for a 10-year operational period, weighted average cost of capital of 7.8% to calculate the value of captured hydrogen production tax credit (45V).
RMI Graphic. Source: RMI analysis based on data collected from HyDelta, BNEF, IEA, Rystad, Deloitte, and NREL
European policymakers can account for these market differences across Member States by directing investments toward regions that will benefit most from green hydrogen imports, in 2030 and longer term. Allocating public support to specific ports can enable symbiosis between markets better served by imports from third countries and those better served by local production or intra-European hydrogen trade.
Ports will be key drivers of the EU’s hydrogen market development, serving as gateways to the industrial hubs that will drive demand for green fuel as they decarbonize. Infrastructure at ports — ammonia import capacity, storage facilities, ammonia crackers, and hydrogen pipelines — will critically enable early imports. Exhibit 5 shows how ports in Europe can be assessed and ranked as potential nexuses of the green hydrogen trade. The index factors in economic attractiveness (determined by the anticipated cost differential between imported and domestic products), expected supply gap (determined by weighing forecast hydrogen demand against project pipelines), and existing country-wide ammonia import capacity (in kilotons per year, as most early green hydrogen will arrive to the EU as ammonia). Leveraging this type of index would allow for the regular, dynamic evaluation of trade nexuses as international markets develop.
Data on current and planned ammonia import capacity, also shown in Exhibit 5, indicates that for imports to help meet expected supply gaps across most markets, countries will need to ramp up investment in ammonia import capacity and critical pieces of infrastructure around ports like crackers, storage facilities, and hydrogen pipelines. All EU Member States with import ambitions still lack the requisite infrastructure for procuring sufficient international hydrogen to meet their expected supply gaps.
Exhibit 5: Country readiness/attractiveness to facilitate hydrogen trade in 2030
[1] Index calculated based on subsequent cost differential, supply gap, and import capacity values. The index ranges from 0 to 1 based on a normalization and weighted average of the variables.
[2] Port cluster represents ideal area for imports and centralization of infrastructure such as cracking plants, based on hydrogen demand, and existing and planned ammonia import infrastructure. Major ports within cluster are shown on table – smaller surrounding ports may be included.
[3] Negative supply gap value indicates oversupply.
[4] Calculated using existing and announced terminal capacity. Import capacities are shown as hydrogen from cracked ammonia accounting for conversion losses.
Note: Analysis is focused on archetype ports in each Member State to calculate cost differentials between imported and domestic green hydrogen supply, and to gauge readiness for ammonia offtake. This framework does not reflect the full range of ports in the EU that have expressed interest in hydrogen trade, nor does it consider how ports in neighboring countries will be used as likely centers of import for industrial clusters, especially in Northern Europe.
RMI Graphic. Source: RMI analysis based on data collected from HyDelta, BNEF, IEA, Rystad, Deloitte, and NREL
For the EU to meet its ambitious hydrogen deployment targets, it must enable imports as a part of a comprehensive energy strategy, promoting energy security and giving domestic industry a runway to mature. Importantly, for Europe to meet its decarbonization targets, these imports must be fully decarbonized themselves.
2. The Value of Renewable Hydrogen
The EU needs green hydrogen imports to fulfill its decarbonization objectives. Mobilizing more funding now to procure green (rather than “blue”) fuel will save the EU money and bureaucratic hassle in the long run.
The EU has strongly committed to supporting renewable (green) hydrogen over gas-derived (blue) hydrogen as it moves away from fossil fuels. The EU has set strict requirements for hydrogen products to qualify as “renewable.” The Renewable Energy Directive sets green fuel deployment targets for industry and transport, and only green hydrogen producers will be eligible for funding from EU-wide subsidy programs like the EHB. Still, there is a risk that early off-takers in the EU will opt for cheaper, “low-carbon” blue hydrogen over green in the short term, while natural gas prices and carbon prices remain low.
Green hydrogen projects are capital-intensive and, due to higher levels of perceived risk, will be subject to high interest rates while renewable electricity systems and electrolyzers remain expensive. Renewable hydrogen production is nascent, and all supplier facilities need to be newly built. Interruptions and constraints across the green hydrogen value chain could limit installations, delaying cost reductions. In contrast, blue hydrogen facilities can take advantage of low gas prices in countries targeting export to Europe, exploiting existing natural gas supply chains and deeper balance sheets of incumbent oil and gas companies to reduce their project financing costs.
But it’s critical that Europe not lock itself into future reliance on blue hydrogen, as it could jeopardize the successful decarbonization of heavy industry and transport. It will be difficult to verify the emissions intensity of fuels imported from abroad, and there’s a risk that blue hydrogen produced at lower effective carbon-capture rates on heavily emissive extraction sites will exceed the EU’s official threshold for “low-carbon” hydrogen altogether. If blue hydrogen were to become dominant in the short term, any failure of certifying and pricing emissions correctly will risk sinking funding and capital into projects that do not deliver on the carbon reduction promised, negating climate benefits and making the supply of “clean” hydrogen redundant. Exhibit 6 shows the emissions intensity risk of procuring blue hydrogen over green hydrogen imports.
Exhibit 6: Estimated emissions intensity for landed hydrogen imports by source region and transport method
kg CO2 equivalent (CO2e)/kg H2e
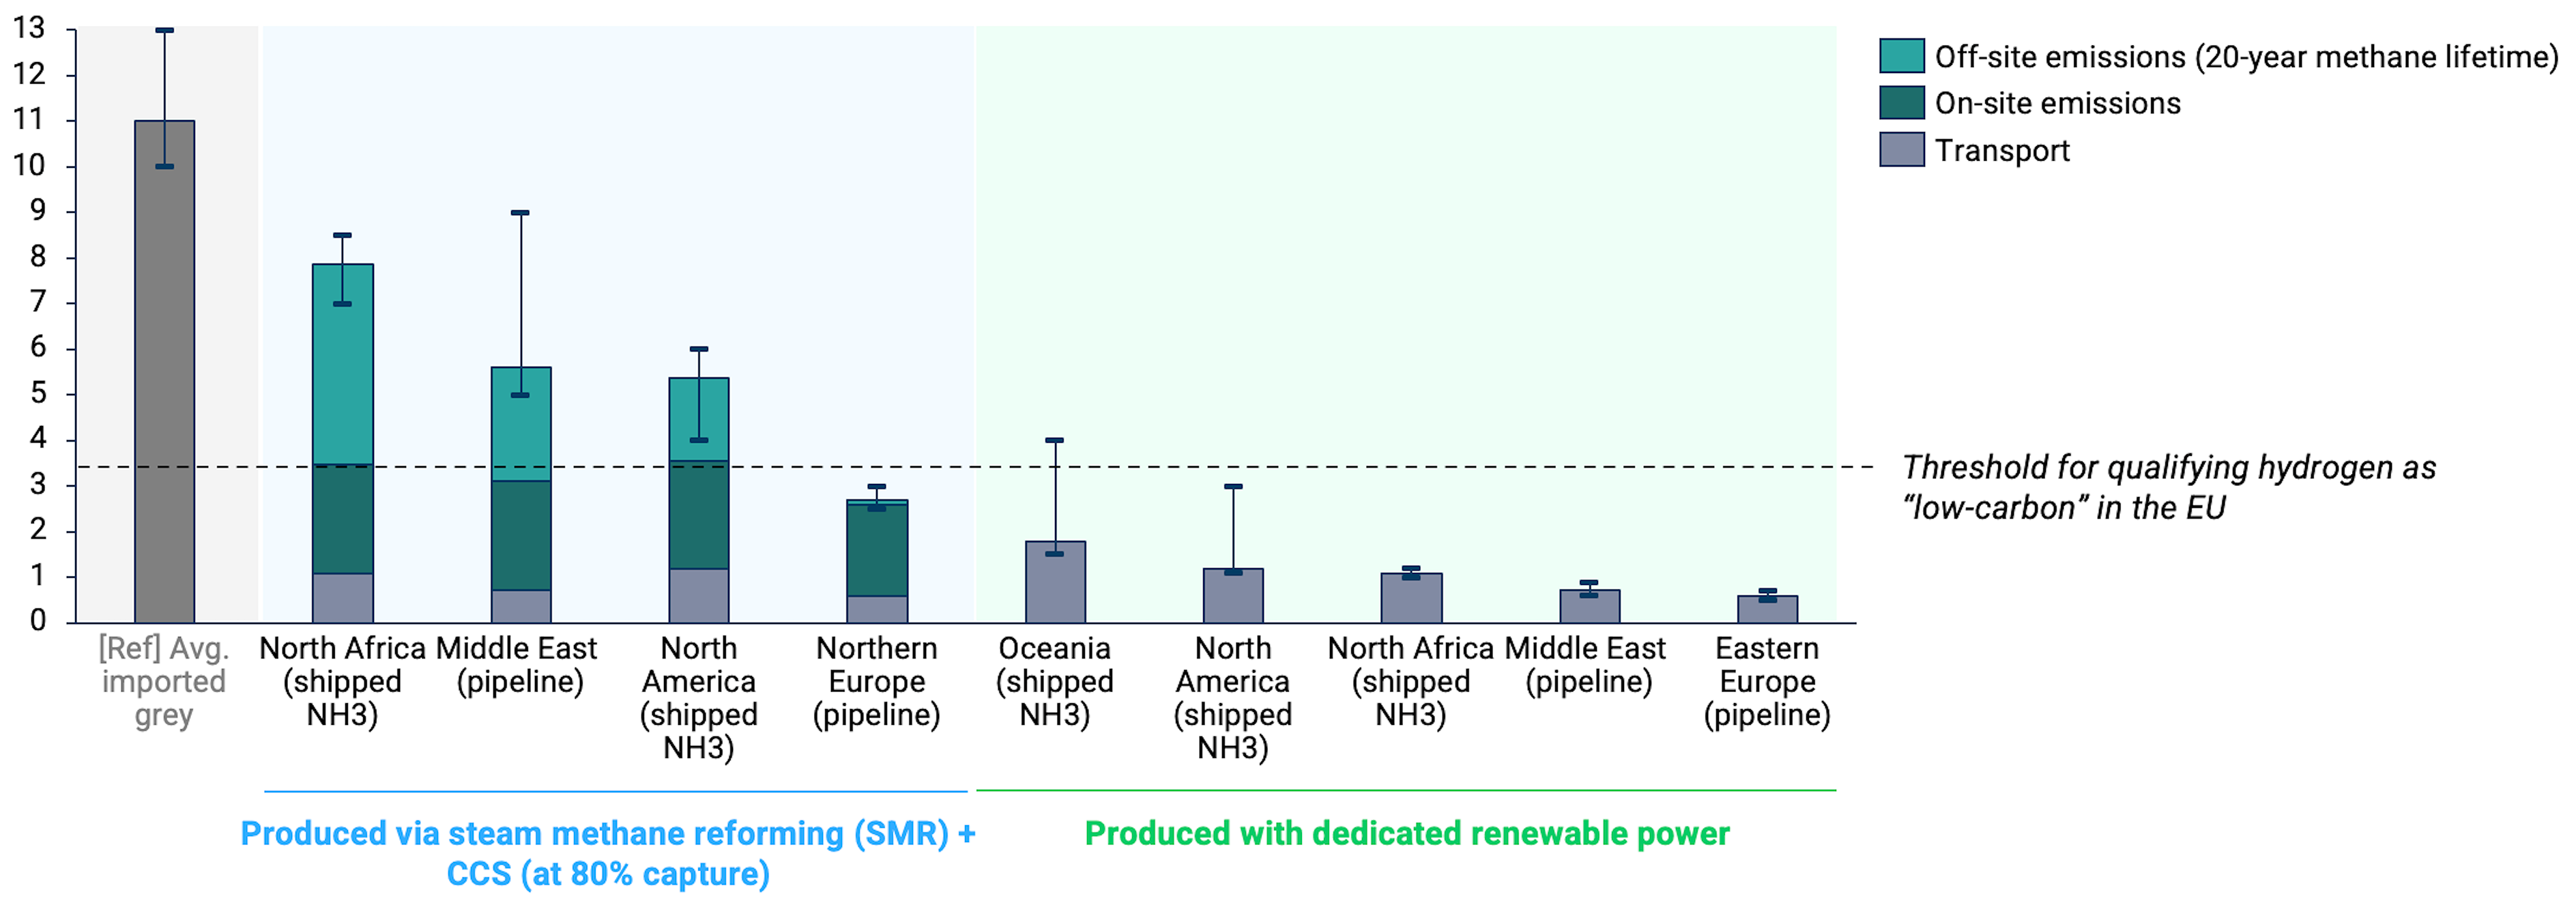
Note: Emissions calculations do not consider impact from ammonia cracking or distribution from ports, which would drive emissions intensity even higher. Emissions for SMR-derived hydrogen could be further reduced at higher capture rates. Transport emissions for shipped ammonia could be further reduced if ships are powered with zero-carbon fuels.
RMI Graphic. Source: Oxford Institute for Energy Studies, Measurement, Reporting, and Verification of Methane Emissions from Natural Gas and LNG Trade, 2022; IEA Methane Tracker, 2022; RMI analysis
Green hydrogen imports in Europe will start to outcompete blue on cost within the next decade, especially if natural gas prices remain volatile. As manufacturing techniques improve and capacities increase, electrolyzer costs will decline. Once economies of scale are achieved, green hydrogen prices will fall, while rising natural gas and carbon costs drive up the price of blue hydrogen.
Still, additional public support is needed in the short term to offset green premiums and enable European end-users to opt for renewable over low-carbon hydrogen, as shown in Exhibit 7. To mitigate the risk of blue hydrogen uptake, the EU can ramp up funding for hydrogen subsidy auction schemes (e.g., H2Global, the EHB) that cater to renewable providers, or promote more Member State–sponsored carbon contract for difference (CCfD) schemes to ensure that green imports consistently compete with blue.
Exhibit 7: Landed-cost outlook for low-carbon and renewable hydrogen products in the EU
$/kg H2
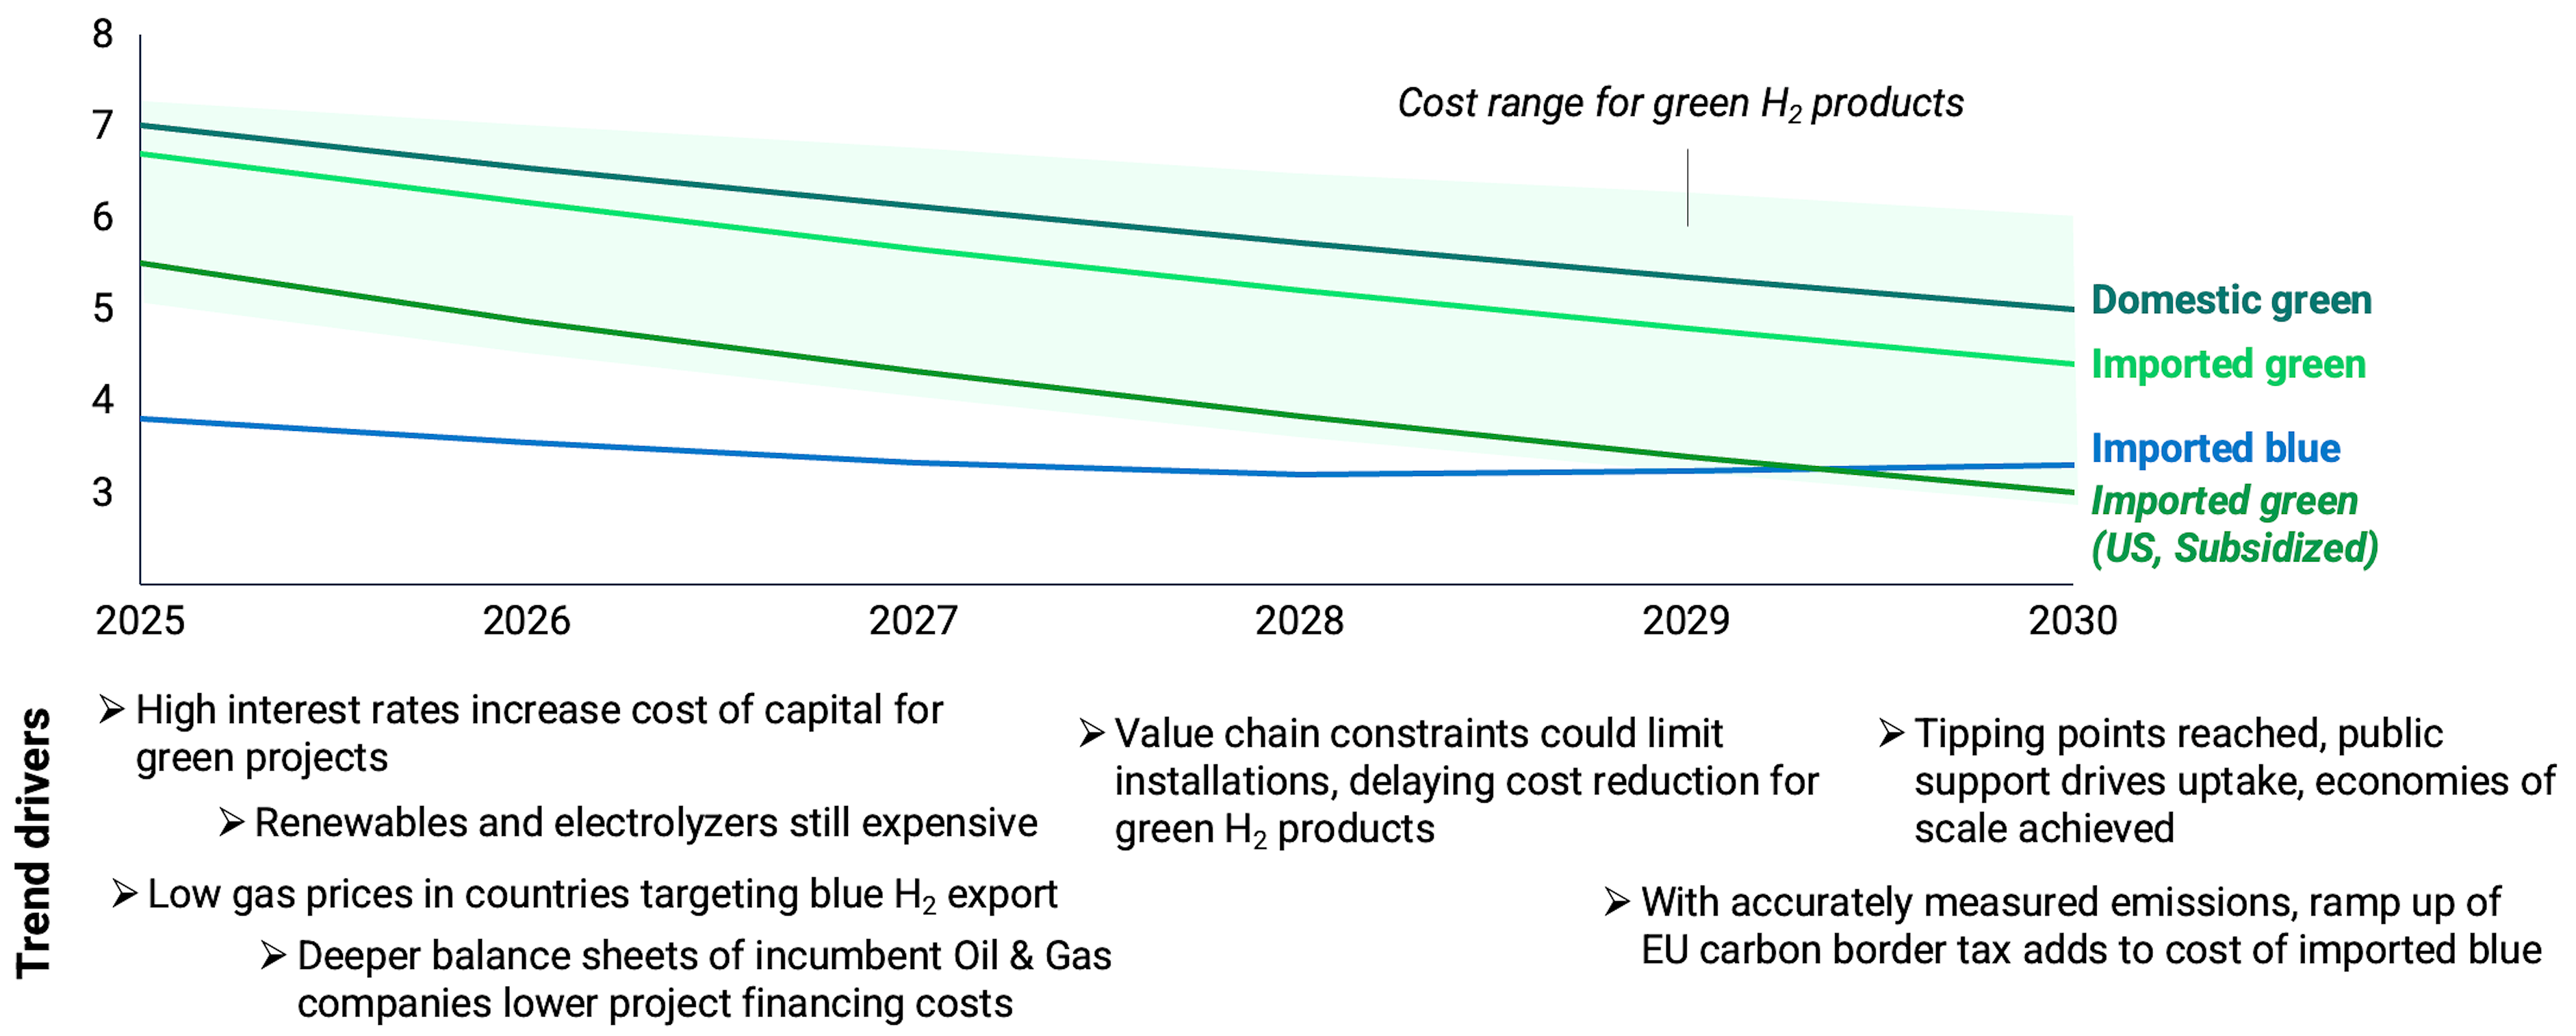
Note: Costs account for production, storage, conversion (where relevant), and transport (via shipped ammonia). Cost of domestic green calculated by averaging production costs in Poland, Germany, the Netherlands, Belgium, France, Spain, Portugal, and Italy. Cost of imported green calculated by averaging landed costs from likeliest short-term suppliers in the Middle East and North Africa, (MENA), North America (NA), South America (SA) and Australia. Cost of imported blue calculated by averaging across likeliest short-term suppliers in MENA, Norway (NOR), NA; Cost of imported green from the US calculated assumes production in the US Gulf Coast and includes the impact of renewable power and hydrogen production tax credits in the US.
RMI Graphic. Sources: RMI analysis based on data collected from HyDelta, BNEF, IEA, Rystad, Deloitte, and NREL
Our analysis indicates that €15 billion to €20 billion in public support will be needed to procure ~10 million tons of green hydrogen by 2030 — the EU’s ambitious deployment level — at costs competitive with fossil fuel alternatives. Mobilizing this level of funding will exponentially benefit the EU by incentivizing private investment in European industries. We estimate that this level of support will unlock more than €300 billion in private spending on renewable energy systems, electrolyzers, and new EU infrastructure.[1] Expanded availability of public and private spending would be a boon for the EU’s electrolyzer industry, as half of the top 20 electrolyzer manufacturing companies are headquartered in Europe. Support for hydrogen imports will also benefit the European companies that are investing in export markets all over the world.
But the EU will need to act quickly to enable green hydrogen imports, preventing expanded reliance on fossil fuels while gaining market share in growing renewable energy technology markets worldwide.
3. Activating Green Hydrogen Trade for Europe
The EU can attract and facilitate early green hydrogen imports from abroad by prioritizing several short-term actions.
The EC should pursue targeted actions to (1) expand funding for renewable hydrogen producers and end-users, (2) rapidly endorse certification schemes for new green fuel products and promote transparency on best practices for fuel operating abroad, and (3) promote the development of physical and market infrastructure to facilitate trade. These actions can be linked to existing policy packages, as detailed below:
1. Expanded funding
H2Global (and the EHB)
The EC should continue to work intensively with Member States to secure expanded funding for H2Global, the entity overseeing Europe’s first international hydrogen procurement auctions. H2Global can then send clear, updated signals to prospective exporters on available support levels and specific timelines for ready-to-move exporters.
The EC Directorate-General for Energy along with Member States must calibrate levels of funding for future auction rounds to ensure that targeted levels of green hydrogen can be procured. Funding sources could include the Recovery Fund and EU Emissions Trading System (ETS) revenue. Current levels of committed spending from Germany and the Netherlands (about €4.7 billion combined) will need to be scaled — and augmented by other Member States — to procure enough green hydrogen to fully supply heavy industry and transport.
2. Certification schemes
Delegated acts on renewable fuels of nonbiological origin
The EC must rapidly endorse and publish clear guidance on accredited certification schemes that will be used to qualify imports as “renewable.” The EU should rapidly endorse the internationally aligned schemes it’s currently reviewing to facilitate compliance processes for hydrogen producers operating in markets abroad.
The EU can leverage H2Global’s analysis on standardizing hydrogen certification to expedite decision-making and adoption of schemes.
Carbon Border Adjustment Mechanism (carbon border tax)
The EC must reduce the administrative burden for suppliers by harmonizing certification schemes used to prove effective emissions reduction.
3. Physical and market infrastructure
Hydrogen and decarbonized gas market package
The EC, in trialogue with the European Parliament and Member States, must finalize and rapidly enact regulatory schemes governing access to hydrogen infrastructure, including ammonia terminals, storage, and crackers.
Regulations governing the use of new hydrogen infrastructure at ports should prioritize open access for suppliers while accounting for economic constraints, as with regulations governing access to liquefied natural gas (LNG) terminals.
Expanded funding for infrastructure programs
Member states and the EC (potentially via Important Projects of Common European Interest, or the Connecting Europe Facility) must rapidly invest in new ammonia offloading terminals and crackers, especially at ports in Northwest Europe, in addition to investing in new hydrogen pipelines.
To ensure that green hydrogen can reach EU end-users in the next two to three years, European states need to build up more ammonia bunkering, storage, and conversion facilities at ports. Existing capacity is largely concentrated around smaller ports near chemical manufacturers, and larger ports will need to build new ammonia off-take and cracking facilities if they want to achieve their import ambitions. Spending about €1.8 billion on critical ammonia and hydrogen infrastructure — only a small fraction of the billions earmarked for investment in the EU’s hydrogen backbone — will enable ports across Europe to procure sufficient imports to meet supply gaps in 2030.
Working quickly to enact these recommendations while existing policies are revised and expanded will strengthen the EU’s position as the leading target market for early green hydrogen exporters. Reliable early imports will enable heavy industry and transport players in Europe to decarbonize their fuels and feedstocks, strengthening demand signals while the bloc develops its domestic green hydrogen market.
If the EU succeeds in procuring sufficient green hydrogen to meet its targets, it will signify the value of imports in accelerating dynamic decarbonization while strengthening energy security and creating a paradigm for other international markets to follow.
APPENDIX
Exhibit A1 illustrates the supply chain model used to calculate LCOH via ammonia carrier, with the example of the route from the US Port of Houston, Texas, to the Port of Rotterdam, Netherlands, in 2030.
The LCOH calculation is based on an optimization model to replicate a behind-the-meter system of hybrid renewables, storage, and hydrogen production. It includes the levelized impact of subsidies in 2030 — such as tax credits in the United States for renewable energy and hydrogen production and the pilot of the EHB for local European hydrogen production — over a 30-year project life span. The LCOH represents the offtake cost at FID for a given year rather than construction, meaning an LCOH calculated will not come online until three to five years later. Cost calculations do not account for any profit margin and instead represent the break-even cost of hydrogen.
The transportation of hydrogen as ammonia is dependent on trade volumes for each route and year. The cost of storage, bunkering, and jetty is considered in both ports, adding the conversion from hydrogen to ammonia in the export terminal and cracking back to hydrogen in the import terminal in the European port. The shipping is a charter cost, mimicking the LNG market, with a cost per day and fuel cost that, in this case, come from using ammonia as the primary shipping fuel.
Exhibit A1: Landed cost of imported green hydrogen from the US Gulf Coast via ammonia carrier vs. cost of domestic green hydrogen production in Germany in 2030
$/kg
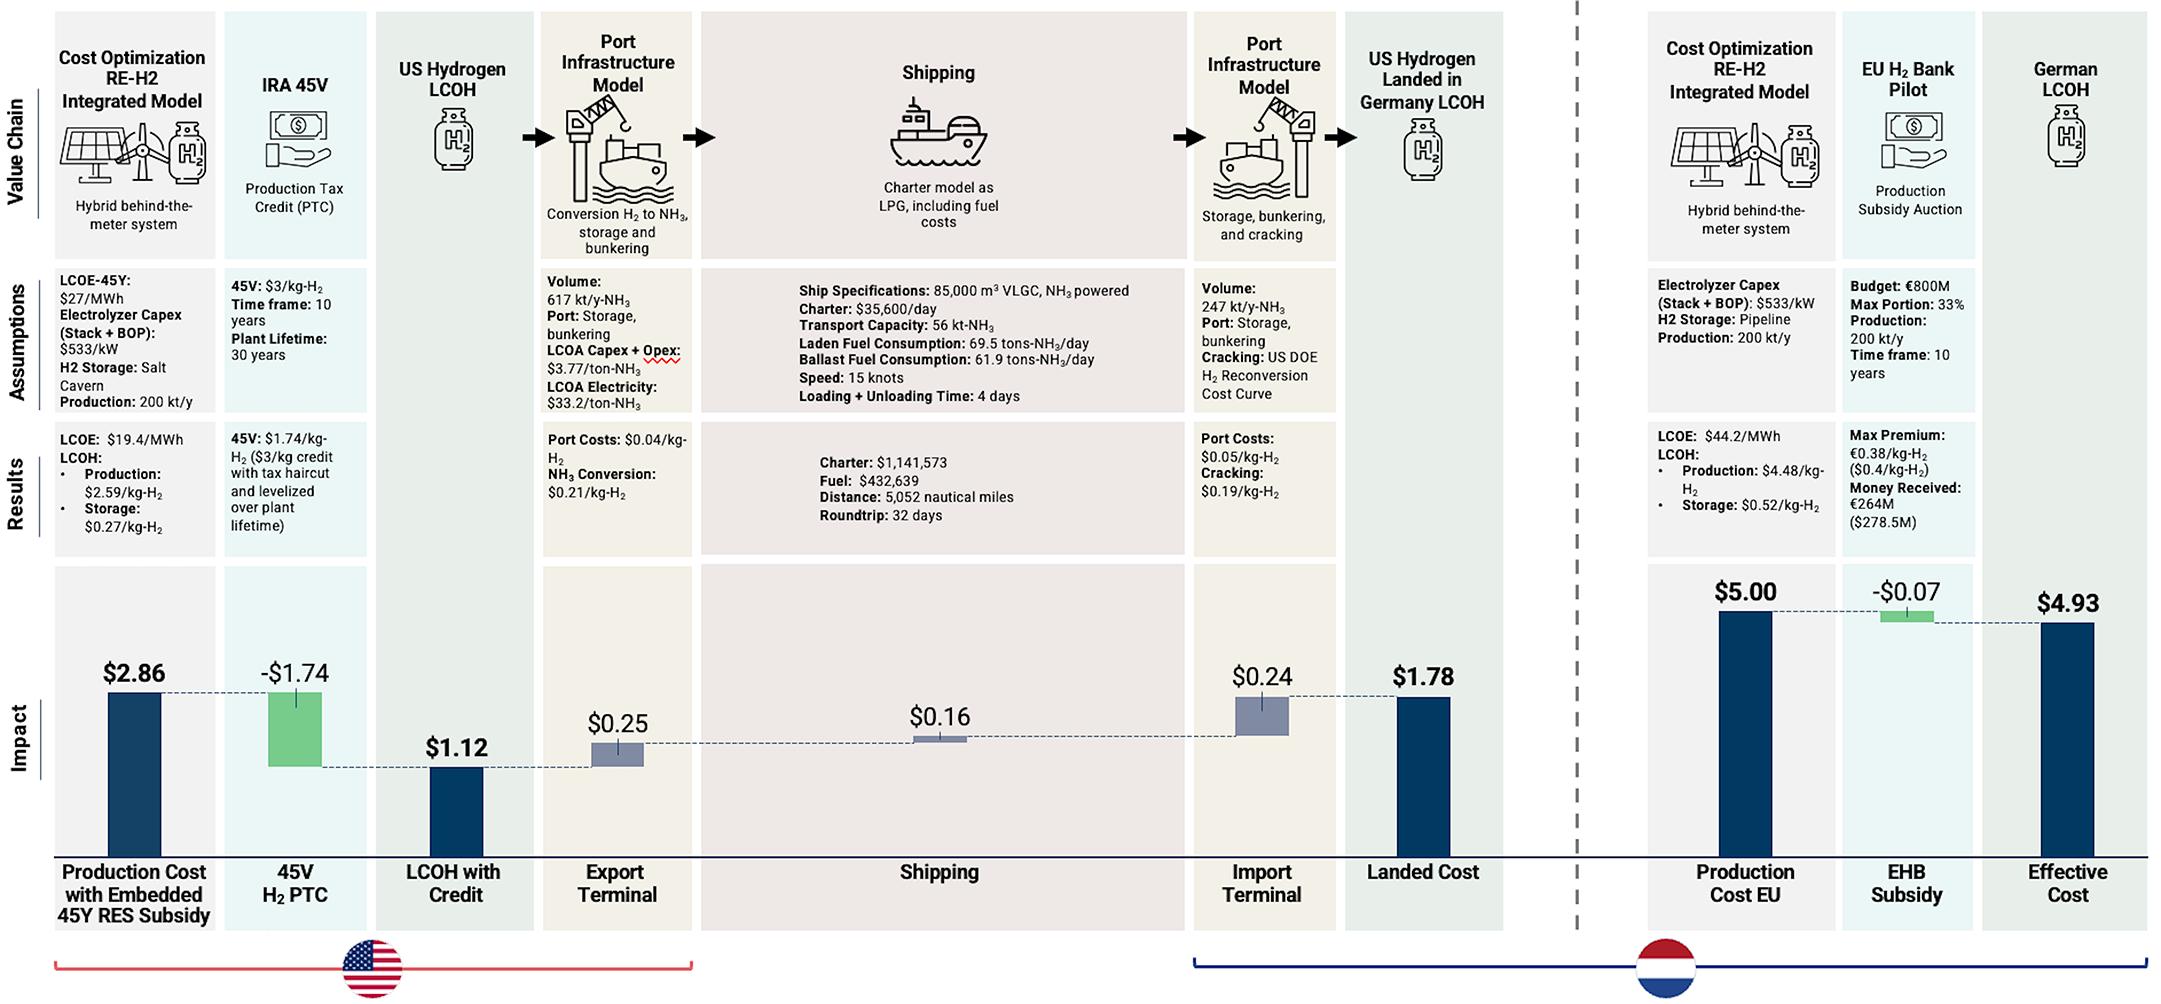
Note: Based on a shipping route from Texas Port of Houston to the Port of Rotterdam, Netherlands.
RMI Graphic. Source: RMI analysis based on data collected from HyDelta, BNEF, IEA, Rystad, Deloitte, and NREL
Exhibit A2 includes further details on sensitivity analysis parameters used to calculate the results shown in Exhibit 3.
Exhibit A2: Underlying parameters for LCOH sensitivity analyses for an archetypical production plant in the Port of Houston in 2030
Authors

Oleksiy Tatarenko
Senior Principal
Joaquin Rosas
Manager
Quailan Homann
Senior Associate
Natalie Janzow
Related Insights

Advance Market Commitments Today Can Build a Low-Carbon Tomorrow
Help build the clean energy future. Donate today.
Independent research. Real-world solutions. Supported by donors.
RMI can pursue the highest-impact climate and energy solutions because we’re supported by people who believe change is possible. Every gift helps advance the work needed to make clean energy the default choice worldwide.
For other ways to give to RMI, including checks or gifts of stock, please visit Other Ways to Give.
