
Rebalancing “Return on Equity” to Accelerate an Affordable Clean Energy Future
By updating how to determine ROE, stakeholders can incentivize grid investments that are more affordable for customers, improve grid resilience, and maintain reliability.
Achieving a rapid, just, and affordable energy transition will take balance. There are a host of regulatory, legislative, strategic, and financial levers and tools worth exploring and using to realize this clean energy future. One component of utility regulation in which reform can play a crucial role is the allowed return on equity (ROE), or the allowed rate of profit (%) on capital investments made by regulated utilities.
As background, evidence suggests that allowed utility ROEs have become increasingly generous over the past few decades. In fact, since the 1990s they have fallen less than prevailing interest rates and costs of capital.[1] Evidence also clearly suggests that ROEs are higher than the return investors require. These high ROEs create an incentive to prefer capital solutions instead of a level playing field of possible choices. High ROEs make utility service more expensive than it needs to be, adding pressure to the pace of transition due to affordability considerations. High ROEs also make utilities less competitive with market-based solutions. Restoring balance to allowed ROEs can accelerate the pace of the energy transition.
Why are ROEs so high? Flawed application of assumptions through models can add hundreds of basis points each to cost of equity (COE) estimates. These inflated COE figures then influence ROE recommendations and decisions.
This primer will discuss assumptions that follow best practices and sense-check COE model outputs against external estimates of expected stock market returns, thereby helping ROE experts confidently estimate the return investors require (COE) and confidently propose ROEs that provide balanced outcomes. We will provide a background on the topic as well as evidence that currently allowed ROEs are above the cost of equity (the return investors require). Lastly, we’ll explore common myths about lowering ROEs to address concerns and rationally seek these balanced outcomes.
Setting ROEs at the right level is necessary to bring forward a rapid, just, and equitable transition. Right-sized ROEs will bolster competitive forces to drive procurement of lowest cost renewable resources and other cost-effective solutions, helping the climate while ensuring customers do not overpay for the necessary wave of capital.
Introduction
Utility regulation is complicated. Financial topics within utility regulation can be nuanced, complex, and prone to misunderstanding. This can lead to outcomes that slow the energy transition, are overly generous to utilities, and cost customers more than necessary.
The return on equity (ROE) component of utility regulation is an important example of a financial topic with complexities that can seem daunting. One key obstacle lies in the extent to which ROE is often confused with another rate of return, the cost of equity (COE). These metrics are different measures of different things. ROE is observable while COE can only be estimated.
In a nutshell:
- ROE is what a company earns on its investment. For utilities, it’s the allowed rate of profit (%) the regulatory process grants utilities the opportunity to earn.
- COE is what an investor demands, which per financial theory is what they can expect to earn on the stocks of companies with similar risk.
The stakes of conflating these two terms are high. With correct analysis, stakeholders can confidently right-size ROEs, paving the way for a rapid, profitable, affordable clean energy future. On the other hand, mispriced, particularly excessive ROEs stand in the way of that future.
In this primer we provide stakeholders with a clear financial understanding of the relationship between ROE and COE. We aim to empower these parties to align the ROE-setting responsibility with the policy goals of each jurisdiction.
The clean energy transition will require new capital investments. However, evidence suggests that ROEs are higher than the return required to fund utility capital plans, based on an analysis of price/book ratios, which may mean customers are paying more than necessary for that capital.
Further, flawed application of assumptions through models can add hundreds of basis points each to COE estimates, pushing ROEs beyond needed levels. Simply using proper model assumptions can meaningfully contribute to restoring balance.
Lastly, on close inspection, lower ROEs are not nearly as problematic as they are made out to be. Financial markets are efficient at balancing risk and reward. Utilities have demonstrated an ability to access capital even when ROEs the utilities earned were lower than minimum requirements for more than a decade because of the efficiency of financial markets. Potential credit rating downgrades from lower ROEs do not necessarily mean higher costs to customers, as explored in this primer. What matters to customers is the overall rate of return which is dependent not only on the cost of debt but also the capital structure (mix of debt and equity). It is often the case that action taken that causes a bond rating downgrade, such as lowering the ROE, may increase the cost of debt but decrease the overall rate of return that customers pay.
This primer will help stakeholders:
- identify when ROE is set too far above COE;
- ensure that models and their assumptions do not misapply key inputs;
- distinguish facts from the noise of commonly cited risks;
- avoid perpetuating capital expenditure (capex) bias; and
- estimate confidently the return investors require (COE) and the ROE necessary to provide balanced outcomes.
Rate Regulated Entities
For nearly 100 years, electric utilities were granted monopoly status, subject to price regulation by an independent agency. While there was a wave of restructuring and “deregulation” in the 1980s and 1990s, roughly 96% of retail sales remain delivered by rate regulated entities today.[2]
In setting retail rates, regulators establish a numeric value for the utility’s ROE, which is the rate of profit (%) that the company has the opportunity to earn on its invested equity capital.[3] The return on equity is one of the components the regulator uses to calculate the total revenues the utility needs to collect to continue to offer its service. This includes not only out-of-pocket expenses, but also returns of and returns on invested capital.
Why the Return on Equity Matters
Setting the return on equity properly should be of concern to all stakeholders in the regulatory process. Data from RMI’s Utility Transition Hub shows that ROE accounts for 15%–20% of customer bills, as shown in Exhibit 1.
With the projected $1.3 trillion of capital spending necessary to meet climate objectives in the electric utilities sector, there is a significant amount of money on the line. Pearl Street Station Finance Lab, again using RMI’s Utility Transition Hub data, estimates that US electric consumers could save $4 billion annually for every 1 percentage point reduction in authorized ROE or an estimated $2.33 per month (2%–3%), as shown in Exhibit 2.
High ROEs Perpetuate “Capex Bias”
Regulated utilities earn a return on their invested capital, also called a rate base,[4] which grows with capital expenditures (capex). Other components of a customer bill, as shown in Exhibit 1, are passed through to customers without profit. However, measuring the COE, or the return that investors demand, is not possible directly as it is implied in the pricing of securities but never revealed directly. Capex bias is created by high ROEs. When the ROE exceeds the COE, it incentivizes utilities to solve problems such as growing demand for electricity with system-expanding capex instead of other cost-effective solutions like energy efficiency.
It is critical to understand that merely earning a return is not sufficient to create capex bias. We go all the way back to the original 1962 article on the topic of capital bias written by Harvey Averch and Leland Johnson. We see that the return the utility earns (ROE) must exceed the return investors require (COE) to create the preference for capital investment.
The essential characteristic to be demonstrated is: if the rate of return allowed by the regulatory agency is greater than the cost of capital…then the firm will substitute capital for the other factor of production and operate at an output where cost is not minimized.[5]
Capex bias exists and is increasingly pronounced as the gap between utility returns and their cost of capital grows.
While some reforms have been explored and implemented, like shared saving mechanisms that allow customers and utilities to share certain categories of savings within specific parameters, the incentive to invest capital remains in place.
A more comprehensive solution employed in the United Kingdom called “totex,” or total expenditure, can better level the playing field. By combining all expenditures and rewarding a fixed percentage with profit, totex removes capex bias. Paired with other cost control incentives, totex can help keep rates affordable.
High ROEs Make the Energy Transition More Expensive
The energy transition will require a lot of new capital, in the trillions of dollars. Affordability is a major limiting factor to both pace and scale of the energy transition, and energy burden has shown to be a key factor in installation of renewables. Places with lower energy burdens tend to also have a higher portion of energy from renewable sources.
Without reform, high ROEs will make the energy transition more expensive and slower. But it is possible the energy transition will save customers billions of dollars relative to the status quo. High ROEs create an incentive to keep assets operational longer than might be economic to continue earning the return on capital. The Inflation Reduction Act and other incentives, combined with competitive ROEs, can make a clean energy future more affordable and achievable at a faster pace.
Affordability can further be helped by “economic dispatch,” or operating a portfolio of resources in “merit order” — least cost to most cost. Today, there are frameworks that make replacing these kinds of resources with cheaper, cleaner assets a great choice for investors, climate, and customers.
Combined, building the lowest cost resources by taking advantage of all available incentives while operating the fleet of assets efficiently can contribute to greater affordability. High ROEs are a headwind to this affordable future.
High ROEs Make Utilities Less Competitive
High ROEs make rate-regulated utilities less competitive with independent developers of renewables and decarbonization technologies. This can be the case as the independent developers’ cost of capital may be lower than that of regulated utilities because of greater use of tax-subsidized debt capital, efficient capital structures, and market-driven return targets. This disadvantage, holding other costs equal, can make utilities unable to build renewables at a lower cost than third-party competitors. This can contribute to utilities being resistant to increasing the pace of renewable deployment since they prefer to own and profit from the system, thus slowing the buildout of clean energy.
To meet new demand, utilities are increasingly being required to engage in competitive procurement. All-source competitive procurement allows solar, wind, efficiency, and other carbon-free technologies to compete with gas-fired power to replace coal plants or meet new load. It also helps make sure new resources are procured at the lowest possible price for the benefit of customers. Aligning ROEs with competitive market conditions can speed deployment of renewables by regulated utilities, align incentives, and speed up the clean energy transition.
Consistently setting ROEs at the right level is necessary to bring forward a rapid, just, and equitable transition. Right-sized ROEs will bolster competitive forces to drive procurement of lowest cost renewable resources and other cost-effective solutions, helping the climate while ensuring customers do not overpay for the necessary wave of capital.
Details About the Rate of Return in Utility Regulation
A utility’s rate of return depends on the mix of securities it uses to finance its capital projects. This includes debt (bonds) and equity (stocks). This mix is referred to as the capital structure. Debt instruments have liquidation priority over equity securities, meaning that the utility must meet debtholder requirements in full before equity holders receive any return. This makes equity a riskier investment than debt. Therefore, to encourage equity investors to provide capital they must expect to earn higher returns on average than debt holders. Exhibit 3 applies these concepts to calculate the combined rate of return.
The debt return needs little attention as we can observe the stated interest rate on the instruments. Our focus here is on the return on equity, a capital type which has no explicit promise to pay a specific return.[6]
The Return on Equity and Cost of Equity are Distinct Returns
Many, but not all regulatory finance experts suggest that the cost of equity estimate is the proper target for the ROE. We think this is a complex subject but for the purposes of this primer we will assume that regulators should try to set the ROE close to if not equal to the COE estimate.[7] A 2019 National Association of Regulated Utility Commissioners (NARUC) publication on ROE establishes that regulators should set the allowed ROE equal to the COE.
To say that there is or should be a numeric linkage between these two concepts does not mean the returns are synonyms. The return on equity is an accounting metric and the cost of equity is a market determined figure. We can observe the return on equity; the cost of equity is an implied opportunity cost that is never revealed directly. A regulator can set the return on equity; it cannot set the cost of equity. The financial markets determine the latter return.
Market Value vs. Book Value
If a utility’s ROE is numerically the same as its COE, its stock should trade at book value. Book value is an accounting measurement of historical investment upon which regulators base their revenue requirement calculations and to which they apply the ROE. Market value is the total value of all shares as priced by investors in the financial markets. We find book value on the utility’s financial statements; we find market value in the stock market. When market value is greater than book value, the ROE is greater than the COE. That is to say, the return allowed by the regulatory process is greater than the return investors require.
Based on data from the Value Line Investment Survey, a source often used by rate of return witnesses in utility proceedings, and stock market prices, the 20 largest investor-owned utilities in the United States currently trade at an average 1.81x book value, or an 81% premium. This shows that the ROE these companies are expected to deliver is greater than the COE, or return investors require. This concept is illustrated in Exhibit 4.
It is conceivable that under certain conditions the ROE regulators authorize could be numerically the same as the return investors require on utility stocks, but then those stocks would trade at the book value of the underlying utility equity capital. If the stock price does not equal the book value, then we know the utility’s book ROE is not numerically equal to the return investors require on the stock, as explained by New York University finance professor Aswath Damodaran.
"The price-book value ratio of a stable firm is determined by the differential between the return on equity and its cost of equity. If the return on equity exceeds the cost of equity, the price will exceed the book value of the equity; if the return on equity is lower than the cost of equity, the price will be lower than the book value of equity."[8]
Said another way, comparing the market value of a stock to its book value can quickly show whether the authorized ROE is equal to the COE. If the market value is greater than book value, the ROE is greater than the COE and vice-versa.
Though ROE and COE are not proxies for one another, the regulatory process often treats them as the same despite published research on the topic going back decades. In 1970, Stanford Finance Professor Ezra Solomon made it clear that the return on equity and the cost of equity “are not different estimates of the same thing but rather estimates of different things.”[9] Solomon, preceding Damodaran by half a century, goes on to say:
“Rarely will the two [the return on equity and the cost of equity] produce the same result, and the use of one measure as a surrogate for the other may prove highly misleading.”
Exhibit 5 shows that the 20 largest utilities trade at an 81% premium to book value. The data supporting that claim is found in Exhibit 5 alongside projected 3-to-5-year ROEs from the Value Line Investment Survey. As Damodaran told us, “If the return on equity exceeds the cost of equity, the price will exceed the book value of the equity.” The evidence shows that because the subject utilities trade at an 81% premium to book value, then the COE must be below the 11.0% expected ROE.[10]
If investors required an 11.0% return on the typical utility stock, that is, the same return the typical utility earned on its books, then investors would pay book value for that stock. But since investors are willing to pay an 81% premium over that book value figure, the return investors expect is noticeably lower than the return the utilities earn. The fact that investors are willing to pay 81% more than book value means that investors would accept stock returns below those that utilities currently earn. This exercise is a way to quickly compare how allowed ROE compares to COE.
A Straightforward Approach to Estimating COE: Example Utility — Avista Corp.
One way to quantify the cost of equity in a simpler manner is to attempt to find a utility that has a stock price close to book value. Yahoo! Finance presents up-to-date price-to-book ratios for traded stocks. For example, Avista Corp., a utility that serves portions of Washington and Idaho, has a price-to-book value ratio of only 1.14, which is close to parity between those value measures. That means that its returns on equity, which are also observable, will be close to its cost of equity.
Just as in Exhibit 5, we can use The Value Line Investment Survey to obtain estimates of the returns on equity it expects Avista to earn. Value Line projects that Avista Corp will earn a return on equity of 7.5%. Since this utility’s stock price is reasonably close to its book value, its cost of equity must also be close to 7.5%. Notice how straightforward it was for us to obtain an estimate by simply looking at price-to-book ratios and return on equity data from Value Line.
This cost of equity estimate applies not only to Avista Corp., but also to all the utilities in the sector. Valuation experts at McKinsey & Co note that while returns on equity can vary widely for firms within a given industry, the cost of equity for those firms is about the same.[11]
Models and Assumptions
The application of models from expert witnesses in the rate setting process is at the core of establishing COE estimates and ultimately ROE recommendations for setting utility rates. However, many model inputs are unreasonable and lead to incorrect outputs and unduly high COE estimates. For example, assuming earnings growth rates into perpetuity that are above forecasted growth for the economy as a whole and therefore unsustainable will produce incorrect COE estimates.
A simple check on model outputs is to ask the question: do I expect to earn this return on a diversified basket of securities? A lower-risk utility should not reasonably expect to earn or provide a return greater than a diversified portfolio. Annual long-term historical US stock market returns have been in the range of 8.0% to 10.0% and US Treasury bond returns have been 4.0% to 5.0% per year, which we can use as guides to sense check our model outputs for the less risky and bond-like utilities industry.
Formal Analysis to Calculate COE — Discounted Cash Flow Model
Looking back at the data in Exhibit 5 and at our Avista observation, if we want to go beyond the qualitative conclusion that utility ROEs exceed those that investors require to estimate the COE, we can conduct analysis to quantify the return investors require. We start with a formal analysis, our first model, and then compare this model output to our previous observed data point.
The discounted cash flow model (DCF) is a standard cost of equity model. For the formal analysis, we use a mathematically equivalent algebraic re-expression of the model.[12] The model uses several important variables in its calculation of cost of equity. First is price-to-book ratio (explained above). Second is the ROE, set by regulators and forecasted by investors. Third is the earnings retention ratio (b), which is the amount of earnings that do not get paid out of the business to investors and are therefore reinvested back into the business seeking to earn a return.
Applying the median values from Exhibit 5 into the DCF model, a utility with a price-to-book ratio of 1.81, an ROE of 11.0%, and a 37.4% earnings retention ratio, (data from the Value Line Investment Survey and Yahoo! Finance) the associated implied cost of equity (expected or required stock return) is 7.9%.
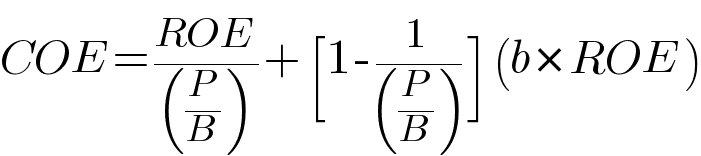
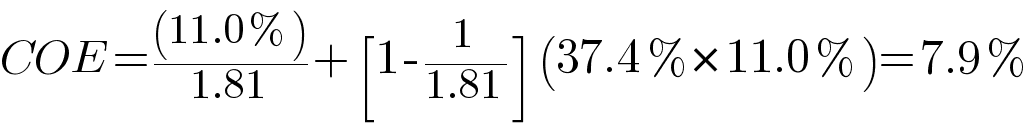
This analysis supports the claim that if utilities are expected to earn an 11.0% ROE, but investors are willing to pay 1.81 times book value for utility stocks, the investors’ required return must be substantially lower than 11.0%. The calculation takes the 11.0% ROE and adjusts it by the utility’s market value to determine the baseline COE investors require. This step of the calculation, dividing the ROE by the P/B ratio, gives us a value of 6.1%. However, stopping here potentially understates the return required by investors who might expect some amount of growth in their investment. The level of growth a company can sustain is calculated by taking the retention ratio (b) and multiplying by the ROE, which yields a 4.1% value. But not all of this growth is necessarily additive to value, which requires us to scale the potential growth by the economic value created by reinvesting retained earnings. Combined, we get a 6.1% base plus 4.1% growth, downscaled by 44.7% (the amount of economic value created by each dollar of reinvestment) which is how we derive the 7.9% estimate for the cost of equity implied by the metrics in Exhibit 5.[13]
Recall that earlier we observed a cost of equity for Avista to be about 7.5%. We should not expect every approach to be exactly the same as others because models have statistical measurement error, but we should expect results in the same ballpark, supporting the 7.9% calculated COE value from the DCF model.
Why Are ROEs so High?
We have demonstrated through observation and by calculation that allowed ROEs are higher than the return investors require. We showed that the market value of the top 20 utility stocks is greater than book value by 81% and estimated, using the DCF model, the COE to be 7.9% as compared to allowed ROEs of 9%–11% across the country and the 9.7% average approved in 2024. But what is driving this and what can be done to better align ROE with proper COE estimates?
We propose that by ensuring the models employed by experts and the assumptions underlying those models reflect best practices, COE estimates will more accurately reflect investor needs and lead to ROE recommendations more in line with COE. Furthermore, by addressing common myths about reduced ROEs, advocates can confidently challenge overly generous ROE recommendations to protect consumers from overpaying for their utility service.
Below, we continue looking at common model inputs and assumptions and how they contribute to unnecessarily high COE estimates.
Interest Rates
Interest rates, or the cost of debt, are a key input into most COE models. Analysts must choose whether to use an historical observation, current data, or forecasts as an input into analysis. Common reference instruments range from US Treasury securities to corporate bonds. The interest rate on these securities is affected by time premium (risk) and credit risk. More risk means more reward, so taking on more time risk and (or) more credit risk will result in a greater reward. Typically, there is a lower interest rate for short-term bonds and a higher interest rate for longer-term bonds. Similarly, there is a lower interest rate for taking less credit risk and a higher interest rate for more credit risk. Credit risk is lowest for US Treasury securities as compared to corporate bonds. Corporate bonds are categorized or rated into “Investment Grade” and “Non-Investment Grade” risk categories. Investment Grade ranges from AAA (lowest risk) to BAA (higher risk). Ratings below BAA are considered “Non-Investment Grade” and carry more risk. Exhibit 6 compares 10-Year US Treasury bonds (lowest risk) to both AAA-rated corporate bonds and BAA-rates corporate bonds to show that increasing risk, as defined by credit rating, leads to higher costs, but the reward for taking these risks is not constant over time.
The variable nature of credit risk might seem to add complexity in forecasting the cost of debt for estimating the COE, and it can, but the clear best practice is to use current interest rates as the input. Even the best forecasts tend to overstate interest rates by an average of 1.05% per year relative to using current rates.
Growth Rates
Growth rates, or how much an investor expects their investment to grow, are another key input to COE models. We walked through an application of the DCF model in our analysis of the utilities in Exhibit 5 where we calculated a growth rate. Other approaches to estimating future growth include looking at historical growth, a company’s forward-looking guidance, and analyst expectations. While each approach has seeds of validity, we think it’s important to set some parameters. Growth of earnings and dividends cannot exceed economic growth into perpetuity. If it did, this fast-growing company would become the entire economy as shown in Exhibit 7.
Many utilities provide guidance for earnings & dividend growth. The range is about 4%–7% per year, which informs analyst expectations. This guidance is usually explicitly provided for the next 3–5 years, and yet some model applications apply these growth rates much longer. OECD estimates long-term nominal US GDP growth to be 4.0% per year. This economy-wide growth rate should act as an upper limit on long-term growth rates in models. In a single-stage DCF model where a single growth rate is applied into perpetuity, each percentage point of excess growth adds 1.0 percentage point to estimated COE. In a multi-stage DCF, where growth can be high for a period of time before converging to a more sustainable rate, the reality of high near-term growth rates can be captured while only adding 0.15%–0.20% to estimated COE. Applying a realistic, achievable long-term growth rate is essential to correctly estimating COE.
Arithmetic vs. Geometric Mean of Historical Returns
When analyzing historical returns, there are two ways to calculate mean, or average, from a set of numbers. The most common approach is to sum the numbers and divide by the number of datapoints, or n. This is called an arithmetic mean. An alternative approach is to multiply the numbers and find the nth root. This is called the geometric mean. See Exhibit 8 for an example calculation.
If there is any year-to-year variation in market returns, arithmetic mean is always greater than or equal to geometric mean. As such, the arithmetic mean can overstate the average, especially when looking at historical returns on debt and equity over a period of time. Arithmetic mean does not account for the effects of compounding. It is a useful way to estimate the return in an “average” year of the observation period, but it will overstate the “average” annual return over the period. Because arithmetic mean overstates the realized or expected return, using it will overstate COE estimates. For the S&P 500 over the 30 years from 1993 to 2023, the arithmetic mean return has been 9.67% while the geometric mean return has been 8.66%, a 1.01 percentage point difference. Models that rely upon historical averages as inputs should take care to use geometric mean rather than arithmetic mean.
Beta
Beta is a key input into the Capital Asset Pricing Model (CAPM), another commonly used cost of equity model. It’s essentially a measure of relative risk to estimate the necessary return for stocks in a diversified portfolio. The stock market has a Beta equal to 1.0. Utilities are less risky than the stock market as a whole, and therefore their Betas are less than 1.0, or the Beta of the entire stock market. This means the expected return from owning utilities is lower than that of the stock market, as shown in Exhibit 9.
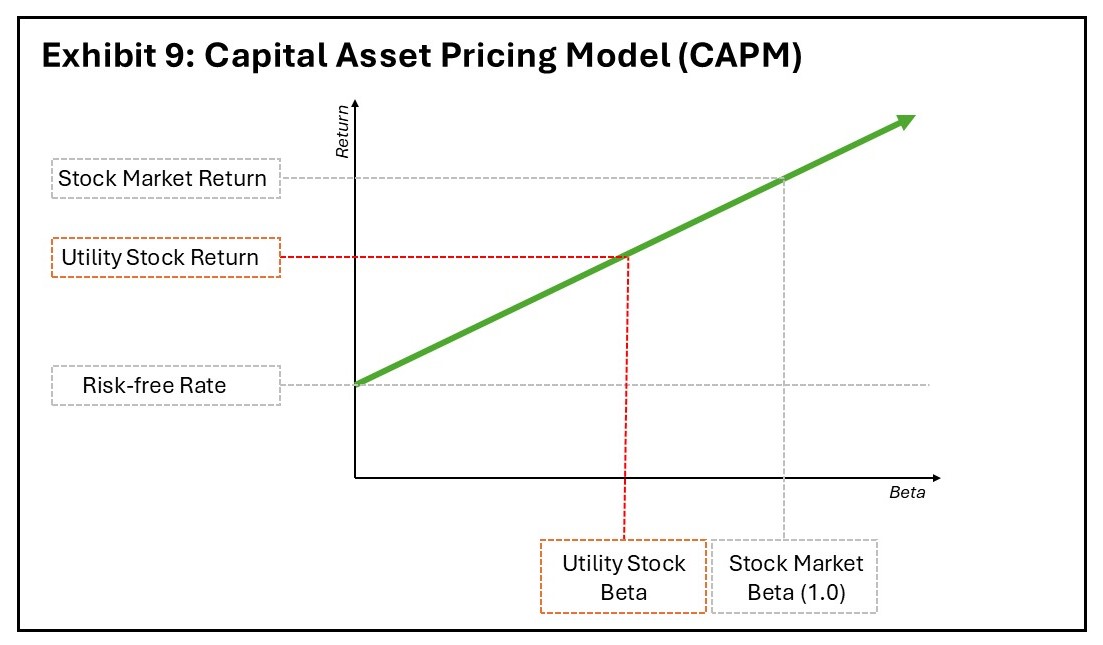
We can use this information to support the claim that less risky utilities should not reasonably expect to earn a greater return than the overall stock market. A simple sense check for any COE model result is whether the value is greater than a reasonable return expectation for the stock market as a whole. If the COE is greater than the stock market, the model and its assumptions should be examined closely.
Summary of Models and Assumptions
We’ve discussed a few important key assumptions and best practices in the application of models and calculated the magnitude of how each raises COE estimates. The average approved ROE of 9.7% in the calendar year 2024 is well above the historical and expected return for stocks, as forecasted by experts, and above the COE estimates we made using data from Exhibit 5. By properly applying these assumptions and models, we can ensure the estimate of COE is as close to true as possible.
Myths About Lower ROEs
Certain risks that might arise with lower ROEs are likely not as concerning as they might seem. Financial analysis holds a certain aura of mystique that can make information asymmetry a pronounced advantage to those that understand the analysis. Beyond model outputs, this manifests in ROE proceedings with claims that lower ROEs will risk limiting access to capital and result in credit rating downgrades — both costing customers money if true. While based in truth, these fears are not as scary as the headline. And overcoming them can contribute to bringing awarded ROEs more in-line with COE estimates.
Access to Capital
Utilities claim an inability to access necessary capital if the allowed ROE is too low. However, utilities have raised equity capital at valuations below book value. For much of the second half of the 20th century, Moody’s Investor Services maintained data on a series referred to as Moody’s electric utility stock index as part of the discontinued “Moody’s Manual” series. It contained 24 large cap utility stocks. Exhibit 10 shows the stock price to book value ratios for the index from 1960 to 1990.
We see that from 1973 to 1985, the typical utility stock, as represented by this index, traded below book value. Exhibit 11 shows that the industry continued to add plants during this period. Utilities do not generate enough funds internally to build their systems. Construction is largely financed with new capital from the financial markets.
Thus, there was a long period in which utilities’ COE exceeded their ROE. In that period, access to capital was not denied and utilities continued to raise necessary debt and equity. Alternatively, raising capital above book value is quite simple. As shown and discussed above, the stock market values companies at their cost of equity — which is currently a premium to book value since ROE is greater than COE. This adjustment by financial markets means raising capital will provide investors with their required cost of equity, whether at today’s premium to book value or the period shown in the Moody’s dataset. Lower stock prices do not mean an inability to raise equity capital. While raising capital below book value might not be in current shareholders best interests, that is the issue, not capital attraction. That is, it is not that utilities can’t raise capital at stock prices below book value because, as shown above, they did for more than a decade.
As the US Supreme Court found in the Hope case, the fact that a regulatory decision causes market value loss for investors does not invalidate the order. In a practical sense, the book value of a utility’s stock is the lower bound on how far the stock price can fall with a just and reasonable allowed ROE. Moving the ROE closer to the COE will not limit access to capital, but it will move the stock price closer to that book value threshold. An ROE lower than COE will not prevent access to new capital, but it would be unfair to existing investors (those who hold utility stocks) because they would subsidize new investors through stock price reductions.
Credit Rating Downgrades
Another common concern raised during the cost of capital process is that credit ratings will be subject to downgrades at lower ROEs, resulting in a higher cost for customers. This makes sense intuitively as a lower credit rating means higher cost of debt and higher interest costs. However, the spread between credit ratings today is less than 50 basis points (0.5%). If a 50 basis point reduction in ROE leads to a credit downgrade and 50 basis point higher interest costs, the net impact to customers is still beneficial given tax considerations as shown in Exhibit 12.
Many utilities provide reports from S&P Ratings and Moody’s on their website that dive into credit ratings and the outlook for the company. For one such utility in the Southeast, according to S&P Ratings, as long as it maintains a ratio of funds from operations (FFO) relative to debt within the 12%–14% range, its credit rating will not change. Sustaining a ratio of FFO/debt below 12% would lead to a downgrade. We provide analysis in Exhibit 13 to estimate FFO/debt after a 1.0 percentage point reduction in ROE showing this utility would likely maintain its credit rating according to S&P’s guidance since the metric remains above 12%.[14]
While the specter of higher interest rates causing higher customer bills is one concern, a corresponding worry is access to debt capital. In times of financial turmoil, lower credit rated companies worry that their ability to raise capital when needed will be limited. The evidence shows that even in the worst of the Global Financial Crisis of 2007–2009, companies were able to raise debt capital across credit ratings as illustrated by the Federal Reserve Bank of St. Louis in Exhibit 14.
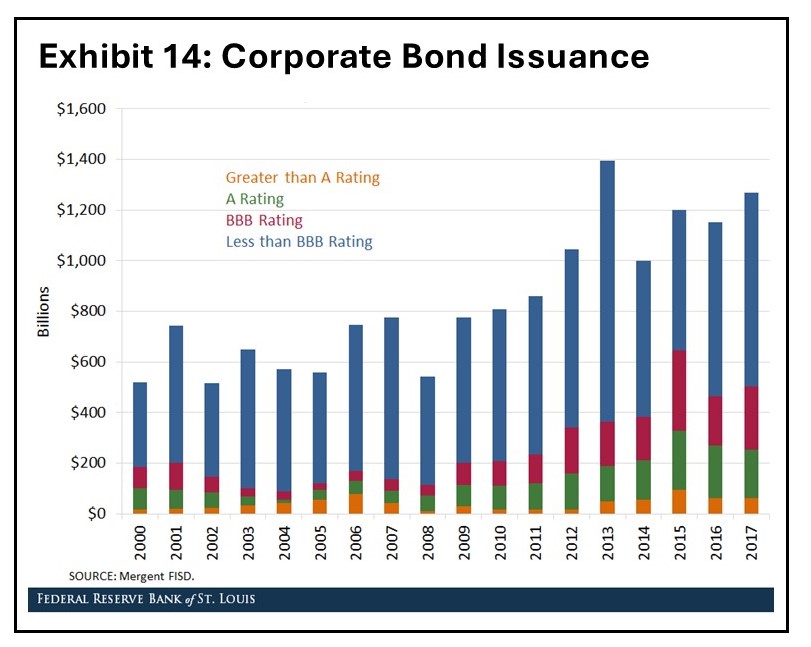
To be clear, we are not advocating for lower credit ratings but simply pointing out that the sensitivity to a credit downgrade might not be as obvious as one might assume and, in the event of a downgrade, customer costs might not actually increase. Further, access to debt capital has been robust, even in the worst financial markets, especially for investment-grade issuers.
Inconsistent Use of the Terms “Cost of Equity” and “Return on Equity”
We’ve written at length about this point, but it’s worth reiterating that these are not interchangeable terms. Many expert witnesses and their direct testimony treat them as the same. Shining a light on the distinction and seeking clarification for when experts are referencing a COE estimate as opposed to ROE can ensure all parties are discussing the same metric. Remember, we can observe the return on equity; the cost of equity is an implied opportunity cost that is never revealed directly. A regulator can set the return on equity; it cannot set the cost of equity. We estimate COE to establish an ROE recommendation. By identifying the distinction between ROE and COE, we can achieve NARUC’s standard of setting ROE equal to the COE.
Conclusion
Like many financial topics, determining the proper ROE can be complicated and nuanced. However, the evidence is clear that awarded ROEs are higher than COEs. Utility stocks trade at an 81% premium to their book value.
ROE makes up 15%–20% of customer bills. Getting such a large piece of the affordability puzzle in line will save customers money. Misaligned ROEs included in utility rates can result in increases in customer bills and create investment incentives that deviate from policy goals. There is an estimated $1.3 trillion of capital to be expended over the next decade, which makes right-sizing ROE a key ingredient to climate success.
We provided a few simple ways to check whether model outputs are realistic. First, we observed a utility that trades close to book value as a calculation-free way to estimate COE. Then, we demonstrated a calculation to estimate COE by looking at price-to-book values.
We then walked through a few key model assumptions and how they contribute to higher COE estimates. Each of the example model assumptions was shown to contribute to higher COE values with proposed alternatives. Applying assumptions by following best practices should yield reasonable model outputs.
Comparing the ROE recommendations and model outputs to expected stock and bond market returns from major financial institutions can prove a sensible check on the aforementioned approaches. A relatively low-risk utility should not reasonably expect to provide a greater return than the riskier stock market.
Common myths about modestly lower ROEs are not as scary as they seem. Utilities have shown an ability to access capital, both debt and equity, in all market conditions. This was even the case when ROE was less than COE, and utility stocks traded below book value, as well as during the Great Recession and Global Financial Crisis of the late 2000s. Furthermore, in the event of a credit rating downgrade, customer costs might not increase if such a downgrade happens in the first place.
By challenging the flawed assumptions and application of models used in testimony, providing evidence that awarded ROEs exceed the cost of equity, and assuaging fears that modestly lower ROEs will not lead to higher customer bills or limit access to capital, stakeholders can be confident that truly just and reasonable ROEs can be a net positive for the pace and affordability of the energy transition.
Acknowledgements
Annemarie Adams: former Public Service Commission of Wisconsin staff, American Transmission Company and Alliant Energy employee, current consultant at The Communication Maven VO.
Albert Lin: regulatory finance expert
Anonymous reviewer: former regulatory staff financial analyst and auditor, utility financial analyst, current independent consultant and expert witness
Endnotes
[1] Paul Fischbeck and David Rode, “Regulated equity returns: A puzzle”, Energy Policy, 2019: 1-17.
[2] The term “deregulation” is somewhat of a misnomer as all participants the electric industry are subject to regulation, often on multiple levels. Deregulation, in this context, typically refers to replacing rate regulation with markets. However, power markets in the United States are still regulated by FERC or, in the case of ERCOT, the PUCT. Estimate of rate regulated retail sales comes from this article.
[3] A common misconception is that regulators guarantee utility rates of return. That is not true. The US Supreme Court found that regulators must set utility prices in such a way that utilities have a reasonable opportunity to earn a fair return. Under standard ratemaking practice, a utility that earns more than the allowed return on equity keeps the surplus return and the utility that earns less than the allowed return in equity absorbs the deficit. Regulators can correct for these deviations only in a prospective sense in future years when they reset the utility’s rates, but they cannot retroactively adjust rates to reconcile these differences. According to RMI’s Utility Transition Hub, from 2005–2020 there are 2,535 observations of companies with reported earned and allowed ROEs. In 635 instances, companies earned more than their target while 1,900 under-earned their allowance.
[4] To be technically correct, the value of the rate base, which represents the dollar value of the physical assets and is found on the left side of the balance sheet, is usually slightly different from the value of the capital raised to construct those assets, which consists of debt and equity security balances, and which we find on the right side of the balance sheet. The discrepancy is due to the fact that the capital raised must support not only the physical assets in the rate base, but also other items such as working capital. This distinction between rate base and capital is not critically important in this discussion, but it may be useful to those who wish to explore this topic further.
[5] Harvey Averch and Leland Johnson, “Behavior of the Firm Under Regulatory Constraint”, The American Economic Review, no. 52-5 (1962): 1052-1069.
[6] Equity is actually even more expensive when we consider that equity returns are taxable, and utility customers must pay those taxes. If the corporate tax rate is 25%, the 9.0% return on equity including taxes increases to 12.0%:

[7] Not everyone agrees that there should be parity between these returns. See Kahn, The Economics of Regulation; Phillips, The Regulation of Public Utilities; Thompson, Regulatory Finance: Financial Foundations of Rate of Return Regulation; and Breyer, Regulation and Its Reform. This sets the stage for a worthy debate, but is beyond the scope of the discussion in this publication.
[8] These are expected returns at the holding company level. Average approved ROEs in calendar year 2024 were 9.7% at the operating company level.
[9] Aswath Damodaran, Investment Valuation, John Wiley & Sons, 2012.
[10] Ezra Solomon, Alternative rate of return concepts and their implications for utility regulation”, Bell Journal of Economics and Management Science, no. 1-1: 65-81.
[11] Tim Koller, Marc Goedhart, David Wessels, Valuation: Measuring and Managing the Value of Companies, John Wiley & Sons, 2020.
[12] Valuation: Measuring and Managing the Value of Companies, 2020.
[13] Most commissions consider estimates of the cost of equity derived using the discounted cash flow (DCF) model. The residual income model shown below is an algebraic re-expression of the DCF model. (Penman 2011)
[14] This simplified example assumes minimal changes to debt costs in the near-term. This makes sense as consolidated debt costs do not change quickly given large portions of debt balances are embedded — that is, they were issued in the past. The interest rates on those securities do not change until they are refinanced. This means that lowering ROEs is almost always a cost saver for customers in the near term, even if bonds are downgraded because the impacts of higher debt costs take many years to work their way through the revenue requirement. Exhibit 13 assumes all debt costs change at once, which is useful for illustration but not how costs would change in practice. See Principle 15 in Janice Beecher, Steve Kihm, Risk Principles for Public Utility Regulators, 2016.