
Clean Fuel Standards: The Market-Based Policy for States Looking to Clean Up Transportation
RMI’s new calculator and design tips help states create clean fuel standards to improve air quality and accomplish unique state priorities.
Federal leadership transitions often bring significant changes to energy policy, which can create market and policy uncertainty for businesses, organizations, and state governments — and the shift from the past administration to the current one is no exception. During this time of evolving federal priorities, many states seeking to reduce greenhouse gas emissions and air pollutants have had to navigate a complex regulatory landscape. To ease this navigation, states can look toward bipartisan, cost-effective policies that do not rely on federal assistance or approval for implementation.
In this complex environment, clean fuel standard policies (also called low-carbon fuel standards, clean transportation fuel programs, and other names) can be a powerful policy tool, offering flexibility for states to reduce carbon and air pollution across diverse transportation sectors using simple market dynamics. This customizable approach allows states to design emissions reduction strategies that align with their unique economic and environmental landscapes, reward innovation, and funnel resources to state priorities.
States that have clean fuel standards policies have reported numerous benefits including cleaner air, reduced carbon pollution, greater investment and research into clean fuels, and economic development and job growth.
This article outlines key considerations in the design of clean fuel standards and includes a new RMI clean fuel standard calculator tool that quantifies the potential impact a clean fuel standard might have in the contiguous United States.
How does a clean fuel standard work and why should states pass them?
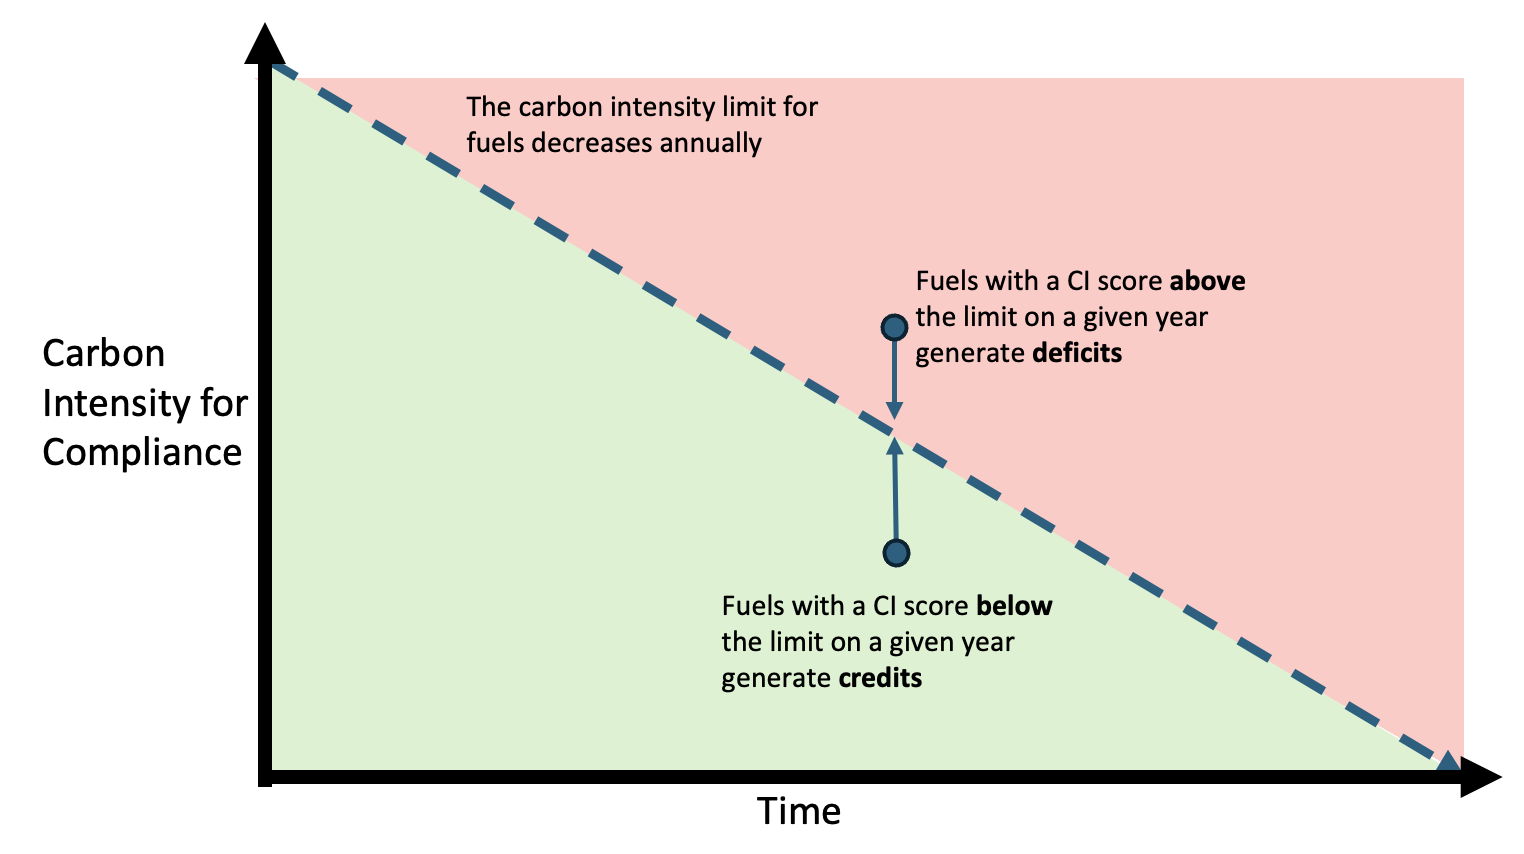
The engine of a clean fuel standard (CFS) is a simple market dynamic. Under a CFS, fuel producers and importers must meet progressively declining carbon intensity (CI) targets for their fuel mixes. If a producer or importer reduces their fuel’s emissions by more than is required under the CI target, they generate credits — one credit per every ton of CO2 below the target. If a producer or importer’s fuel emits more emissions than the target allows, they must purchase credits from other regulated parties to make up for the excess emissions — one credit per ton of extra CO2. This approach has the potential to create a dynamic economic incentive for innovation in low-carbon fuel technologies, allowing states to drive emissions reductions through market mechanisms rather than rigid, prescriptive regulations. Find RMI’s deeper dive into the basic mechanics of these programs here.
These programs currently exist in California, Oregon, Washington, and most recently, New Mexico, with several other states considering adoption. Furthermore, they can leverage billions of private dollars for incentivizing clean fuel adoption, while also generating revenue for the state to disburse to underinvested communities.
California uses the revenue from its CFS — the Low Carbon Fuel Standard (LCFS) — to deploy $4 billion annually to support low-carbon investments, as well as a cumulative $341 million for public transit.
However, these programs do have valid criticisms. While they have the potential to be a powerful engine for clean fuel adoption, when designed without a fundamental commitment to lowering emissions from transportation fuels, they can result in perverse incentives and undermined emission reduction benefits. Another issue to navigate in program design includes a potential over-incentivization of biofuels where electrification could do a better job of decarbonizing transportation.
California’s CFS allows out-of-state dairies to capture and sell biomethane into their local markets and calculates what is arguably an emissions-intensive industry as an emissions-negative process that generates numerous credits. This results in a steady flow of CFS dollars flowing out of the state as regulated entities buy up these credits to offset their emissions, and negates the potential benefit of reduced local air pollution.
It is important to note that these problems are not inherent to the structure of a CFS but have more to do with a state’s program design choices. In fact, one of the most appealing features of these programs is that they can be customized in a variety of ways to meet different states’ needs — and to avoid the issues established in first-mover programs. States that are considering implementing CFS policies must learn from — and remedy — problems incurred by the earliest CFS programs.
CFS policies — an elegant solution that can be customized to many different economies and geographies
Unlike policy solutions that rely on strict mandates or on picking technology winners and losers, CFS programs offer states a sophisticated framework for emissions reduction that can be tailored to local economic and geographic realities to produce market-driven results. Lawmakers and regulatory agencies can strategically modify key program features to align with their state’s unique transportation infrastructure and pollution objectives. This customization ensures that CFS policies can be an effective policy tool across diverse state contexts, from rural agricultural economies to dense urban transportation networks.
Below we outline five features in a CFS that can be adjusted to reflect economic realities and achieve specific state goals for transportation decarbonization. Lawmakers may decide how to structure each of these features in the CFS bill text or may detail only core objectives and leave certain specifics up to the implementing agency. However, to construct a successful CFS program, policymakers must always prioritize emissions reductions when considering design features, or they risk forfeiting the many other benefits these programs provide.
1. Total carbon intensity reduction goals and timeline: Creating a framework
The most foundational feature of a CFS is its overall emissions reduction goal and timeline. This goal sets the broadest parameters for a CFS program and is typically structured as a set emissions reduction percentage by a specific year, based on a past year’s emissions rate. The table below shows the emissions reduction goals of each of the existing programs:
Each state has set its own emissions reduction goals and timeline to achieve them. While there is no “correct” goal amount to set for any given CFS policy, states should consider the status of their transportation emissions against other emitting sectors and state climate goals. It is also valuable to set interim targets to initiate early action and innovation and offer periodic opportunities to measure and benchmark success.
2. Regulated fuels and opt-in fuels: Using CFS programs to accelerate innovation
CFS programs achieve these overarching reduction goals by requiring mandatory compliance to the declining CI cap for certain emissions-intensive transportation fuels — whether compliance is achieved by direct decarbonization or by credit purchasing. While CFS programs traditionally regulate the most common transportation fuels like gasoline, diesel, and natural gas, states can also choose to allow other fuels to opt in to the program — meaning that they can generate credits, but failure to decarbonize does not generate deficits. Each state can decide which fuels are mandatory, opt-in, or exempt from the program based on their needs.
California, Oregon, Washington, New Mexico
In all four existing programs, fuels used for aviation are exempted from the regulation, but the use of cleaner “alternative jet fuel” can generate credits, providing additional profit stream for these producers. Currently no program allows for maritime fuel to opt in, but that could be an option for a state in which maritime fuel is a significant source of transportation emissions or for which a state wants to incentivize alternative fuel development.
3. Crediting pathways: Driving action
Carbon reduction goals are achieved through specific crediting pathways, which are the actions that actually generate credits on the program. The most common way to generate credits across all four programs is to supply fuels with a lower CI than the baseline. Credits can also be generated across all four programs by blending renewable fuels (e.g., ethanol in gasoline, biodiesel in diesel) into conventional fossil fuels. However, state CFS programs can incentivize other state goals or policies by allowing targeted entities to generate credits on their CFS program.
California allows for carbon capture facilities to generate credits, and includes a pathway for “capacity crediting,” where charging stations with large capacities can earn credits even before being fully utilized, incentivizing early infrastructure development.
Oregon
Oregon’s program allows for a nonprofit called a “backstop aggregator” to claim unclaimed credits from EV charging and direct the revenue toward projects that improve access to clean transportation in underserved or rural areas, such as expanding EV infrastructure in low-income neighborhoods and supporting public transit electrification in disadvantaged areas.
In this way, individual CFS programs have created ways for credits to be leveraged to target state-specific goals and values, whether it is encouraging EV infrastructure, rewarding carbon dioxide removal, or addressing affordability and resilience issues.
4. Market controls: Creating consistency and certainty to involved parties
Part of the elegance of CFS programs is that they use simple market forces to encourage decarbonization. However, states can also choose to include market features to ensure that the program runs smoothly and to provide assurance to participants by stabilizing credit prices. Below are some examples of market control mechanisms, and which states have utilized them.
- Credit Clearance Market: Stabilizes credit prices and ensures regulated parties can meet compliance even in tight credit markets by selling credits at a fixed maximum price. Essentially sets a soft credit price cap.
- Banking of Credits: Allows parties to carry credits over to the next year in order to be used for future compliance, providing flexibility for regulated parties.
- Aggregation Mechanisms: Ensures that credit generation from smaller or less-organized sectors, such as residential EV charging, can be included in the program.
- Stringency Adjustments Based on Supply: Also called automatic acceleration mechanisms, these periodically adjust the program stringency if credits become too plentiful or too scarce.
States that implement a CFS may choose to include or omit any of these market controls to meet the needs of regulated parties and relevant stakeholders. Furthermore, some of these market controls are added to programs in following rulemakings after passage to address issues as they arrive, leaving the door open for ongoing tweaks to programs.
5. Fairness considerations: Use of resulting revenue
One of the primary criticisms of these programs is that they do not require place-based decarbonization. In other words, the credit market system means that a ton of CO2 avoided in one area is worth the same as a ton of CO2 avoided in a different part of the state that experiences greater emissions impacts. While this credit fungibility is an inherent part of the program’s strength and can’t be tinkered with directly, states can address specific environmental justice concerns by setting aside the revenue generated by CFS programs to be spent in priority areas.
New Mexico
In the bill that established the Clean Transportation Fuel Program, New Mexican legislators stipulated that any fines collected related to impacts on state water supply must be deposited in the Water Conservation Fund, on-site liquid waste system fees must be deposited in the Environmental Health Fund, radiation license and registration fees must be deposited in the Radiation Protection Fund, and any fees related to the cost and operation of the program as a whole must be deposited in the State Air Quality Permit Fund. Other programs prioritize EV infrastructure and deployment and rural development.
While these earmarks are not a replacement for targeted, place-based environmental justice policies, they can successfully leverage some of the benefits of CFS policies toward environmental justice issues.
Use our calculator to see how CFS policies can be customized for different states
RMI’s free CFS Calculator quantifies the number of credits and corresponding metric tons of avoided emissions for a chosen state and emissions reduction goal. Stakeholders can use the calculator to input two features of a CFS policy — the total percent emissions reduction and the timeline — and swiftly analyze the impacts.
More specifically, stakeholders can use the calculator to see the following:
- The carbon intensity benchmarks for gasoline and diesel fuels in each calendar year given a reduction goal and timeline
- The number of credits generated in each calendar year based on the baseline consumption of gasoline and diesel in a given state
- The number of credits met in each calendar year based on a state’s baseline fleet of electric vehicles and consumption of biodiesel
- The emissions reductions achieved through implementation of a CFS
In its current edition, the calculator does not reflect all the customizations that can be made to a CFS regulation. For example, the calculator does not allow users to include or exempt specific fuels from regulation. It also does not account for the various crediting pathways or market controls that may be implemented.
Certain assumptions are embedded in the calculator, which may not be true for every state. The assumptions are:
- The baseline carbon intensity (gCO2e/MJ) for gasoline, diesel, and replacement fuels is equal to that in California’s CFS regulation.
- The carbon intensity for electricity and biofuels does not improve over time. In reality, the carbon intensity for electricity would likely decrease as the electric grid incorporates more clean energy resources.
Case study: How a CFS can support New Jersey’s climate ambition
To understand how the CFS Calculator works, let’s take the example of regulating a 15 percent reduction in transportation emissions by 2030 in New Jersey. These three inputs — the carbon intensity reduction goal, timeline, and state — will be selected from the dropdown menu on the tab titled User inputs. Key metrics will automatically generate.

The key metrics table shows that use of gasoline and diesel fuel will generate approximately 36.2 million deficits between 2025 and 2030. Over the same period, the projected use of electricity and biofuels, including biofuel gasoline and biofuel diesel, will generate approximately 8.2 million credits. One credit is equal to one metric ton of avoided greenhouse gas emissions.
Credits are a function of two numbers. The first number is the fuel volume. The second number is the difference between the carbon intensity of a fuel (gCO2e/MJ) and the target carbon intensity set by the CFS policy for that year.
In the calculator, the Carbon intensity schedule tab includes a graph displaying the annual carbon intensity target for achieving the overall percent reduction in transportation emissions. With a CFS target of a15 percent reduction in transportation emissions by 2030, the carbon intensity target for gasoline decreases linearly from 88.25 to 84.25 gCO2e/MJ from 2025 to 2030. For diesel, which produces more emissions than gasoline, the carbon intensity decreases from 89.15 to 85.38 gCO2e/MJ.

CFS compliance is achieved when the number of deficits equals the number of credits. A graph in the tab titled Credit and deficit generation shows whether, and in which year, compliance is achieved.
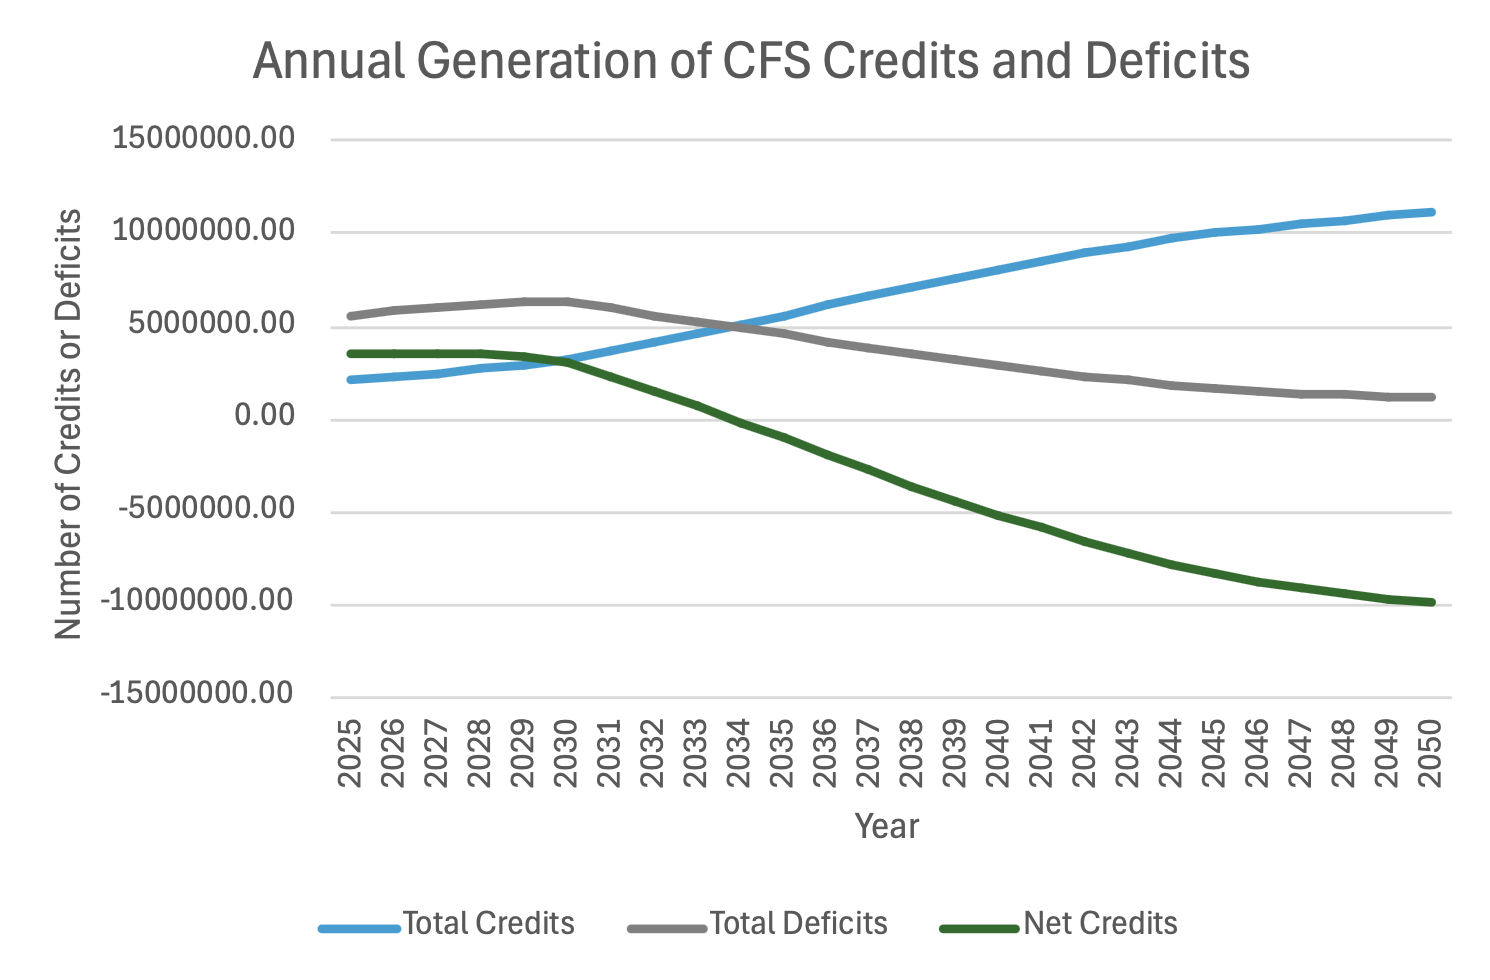
As shown, sole reliance on projected electricity and biofuel consumption is insufficient to achieve total program compliance. By 2030, these upward trends will account for approximately 44 percent of compliance, leaving 20.4 million of the remaining deficits to be met via capacity crediting, opt-in fuels, hydrogen, and other crediting mechanisms.
This calculator and the design tips above can be used by policymakers to roughly assess how a CFS policy will help achieve their transportation decarbonization goals, and to estimate how adjusting different design features can help construct a rational, achievable program. With a focused eye on achieving true carbon emissions reductions and an understanding of how CFS programs can be constructed to reflect unique priorities, policymakers across a diversity of states can design these programs to achieve both climate and equity goals in their states.
