Learn how we are working to transform how we use and produce energy.
Exploring Energy Affordability Across Income, Time, and Geography
Energy affordability is a national issue, particularly for the lowest-income households. Our new tool examines the data and provides resources for decision makers.
Why we share this work for free
RMI is an independent nonprofit working to accelerate the clean energy transition. We publish research like this to inform decision-makers and drive real-world impact.
Our work is supported by philanthropy as well as partnerships, including fee-for-service engagements. This support makes it possible for us to share our independent insights for free.
If you find this work valuable, you can support it anytime.
Get more insights like this
Stay up to date with the latest research, analysis, and tools from RMI by opting in to receive occasional emails below. You’ll get new reports, event invitations, and practical insights to help us all accelerate the clean energy transition.
Loading form...
Your download should start automatically. If it doesn’t, click the download button below.
This work is made possible by philanthropy
RMI is a nonprofit supported by donors and partners. Philanthropy enables us to produce independent research and make resources like this freely available.
If you find this report valuable, please consider supporting our work. You can also explore how we partner with organizations to drive impact.
Jump to Section
Energy affordability — a household’s ability to pay for energy use without giving up basic needs — is an issue of increasing urgency. Rising electricity and gas prices are putting pressure on households across the country. Even before the past year’s increases, one in three US households have had to reduce or forgo food, medicine, or other basic necessities. To determine where and for whom energy affordability is the greatest challenge, RMI developed the Energy Affordability Data Explorer.
The Energy Affordability Data Explorer tracks energy burdens, bills, and rates over time, geography, and income bracket to provide a holistic picture of energy affordability in America — findings that can help target solutions.
Here’s what the data shows in three charts.
Energy burden is the best indicator of a household’s ability to pay for its energy needs. As seen in the chart above, the lowest-income households have disproportionately high energy burdens, meaning they spend the highest proportion of their income on electricity and gas bills.
An energy burden greater than 6% is generally considered unaffordable. This is based on the premise that a household should spend no more than 30% of its income on housing expenses, and energy costs should not exceed 20% of these housing expenses. Households with an energy burden greater than 10% are considered energy impoverished.
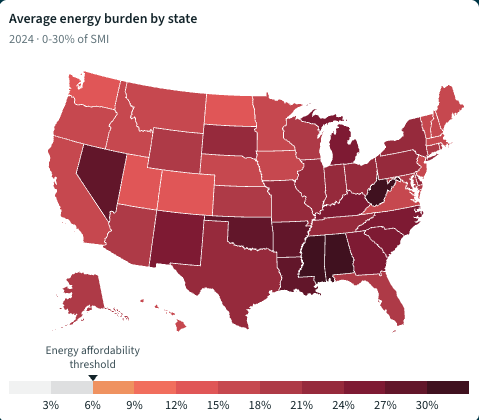
A lot of metrics focus on average households. However, that masks the stark dynamics when looking at breakdown by income class. For example, between 2014 and 2024, the average energy burden for households earning 0%–30% of the state median income (SMI) increased from 16.3% to 20.5%. By comparison, over those same years, the national average energy burden hovered around 3%, and households earning 100%+ of the SMI maintained an energy burden of approximately 2%.
In 2024, one in seven US households — approximately 29.4 million people — had an average energy burden of 20.5%. That is more than double the 10% threshold at which a household is considered energy poor.
Although the percentage of the population that is among the lowest income group is largely consistent across states, the energy burden of that income group varies across geographies.
Much of the change in energy bills and burdens that the lowest-income households have experienced has occurred since 2021. In 2021 alone, average electricity prices rose at the fastest rate since 2008. And natural gas prices rose even faster, with the variance in monthly prices in 2021 over two times larger than it was between 2008 and 2020. This was due to a combination of post-pandemic disruptions, severe weather events, load growth, and other factors. And between 2021 and 2024, the average annual energy bill increased by 12%, or $328, after accounting for inflation.
This increase in energy bills hit the lowest income households hardest, with their annual bills increasing $365 on average. But even the highest income households were affected by the increased prices, with an average energy bill increase of $278.
Of course, these findings are about more than just numbers. Behind every bill increase and energy burden metric are humans facing difficult tradeoffs that affect their health and wellbeing.
Understanding where energy costs are rising — and who is most affected — can help decision makers target solutions where they are needed most. Explore the Energy Affordability Data Explorer to dig into the data and find tools and resources to help make energy more affordable for households across the United States.




Related Insights



Help build the clean energy future. Donate today.
Independent research. Real-world solutions. Supported by donors.
RMI can pursue the highest-impact climate and energy solutions because we’re supported by people who believe change is possible. Every gift helps advance the work needed to make clean energy the default choice worldwide.
And right now, your impact goes twice as far. Thanks to generous donors and our special match, every $1 you give becomes $2, up to $150,000, through December 31, 2026.