

Learn how we are working to transform how we use and produce energy.
Transforming Chemicals Production in Texas
State-level actions Texas can take to improve competitiveness within its chemicals sector and position itself for the future while improving public health and avoiding unnecessary pollution
Why we share this work for free
RMI is an independent nonprofit working to accelerate the clean energy transition. We publish research like this to inform decision-makers and drive real-world impact.
Our work is supported by philanthropy as well as partnerships, including fee-for-service engagements. This support makes it possible for us to share our independent insights for free.
If you find this work valuable, you can support it anytime.
Get more insights like this
Stay up to date with the latest research, analysis, and tools from RMI by opting in to receive occasional emails below. You’ll get new reports, event invitations, and practical insights to help us all accelerate the clean energy transition.
Loading form...
Your download should start automatically. If it doesn’t, click the download button below.
This work is made possible by philanthropy
RMI is a nonprofit supported by donors and partners. Philanthropy enables us to produce independent research and make resources like this freely available.
If you find this report valuable, please consider supporting our work. You can also explore how we partner with organizations to drive impact.
Jump to Section
Executive Summary
Texas, the nation’s leading chemical manufacturer and exporter, is at an inflection point. The state can enable facilities to continue operating largely as they do today or help the industry modernize in ways that strengthen global competitiveness, improve public health, and reduce emissions.
Texas is home to 52 basic chemical manufacturing facilities (Appendix B: Facility List) that primarily produce olefins and hydrogen, building block chemicals used to manufacture everyday products such as plastics, detergents, and adhesives, as well as a few that produce ammonia, methanol, and aromatics, which are used to make textiles. Some of these facilities have been in operation for several decades, since petrochemical production first began in Texas. These facilities are largely concentrated in Harris and Brazoria counties along the Gulf Coast. The basic chemical sector is also a major contributor to Texas’s economy, supporting approximately 36,000 jobs, contributing $26 billion to the national GDP, and accounting for $19 billion of the state’s exports.
Collectively, these facilities release approximately 71 million tons of carbon dioxide equivalent (CO2e) each year, along with significant quantities of criteria and hazardous air pollutants, particularly nitrogen oxides (NOx), carbon monoxide (CO), volatile organic compounds (VOCs) and 1,3-butadiene, which contribute to poor air quality and toxicity related health risks. Globally, market standards are increasingly tracking the emissions intensity of products, signaling growing demand for lower-emissions commodities. By deploying technologies that reduce pollution and emissions from primary chemical production, Texas can protect and strengthen its competitive advantage in the chemical industry, particularly in growing export markets for low-emissions commodities. The state can also improve the reliability and resilience of production processes and improve public health.
Solutions exist that can modernize and transform Texas chemicals production. This report evaluates the economic, health, and emissions impacts of deploying five key commercially ready technology levers and the policies, market drivers, and other state actions needed to encourage their adoption so Texas can continue to lead in chemical manufacturing on a global scale.
AI-driven predictive maintenance uses sensors and analytics software to monitor high-consequence equipment and identify abnormal vibration, temperature, pressure, or flow patterns before failures cause shutdowns, leaks, venting, or flaring.
~100
Potential unplanned maintenance events avoided each year
~2 events per facility per year
$22M–$40M
Deployment cost statewide (~$0.4 million–$0.8 million per facility)
~$300M
Avoided production losses per year (~$6.3 million per facility per year)
65,000 tons
CO₂ avoided per year
27 tons
NOₓ avoided per year
140 tons
VOCs avoided per year
Low-leak natural gas procurement entails chemical producers buying natural gas that is produced, processed, and transported with lower methane leakage, through measurement-based certification standards set by independent, third-party organizations.
Methane intensity can vary by as much as 100 times between the highest-emitting production and an openly certified volume of gas. As such, chemical manufacturers can play an important role in reducing supply chain emissions by demanding low-leak natural gas from their suppliers.
~420M MMBtu
Annual natural gas procurement in Texas for chemical feedstock and fuel
1.71%
Methane intensity baseline (North America average)
Under 0.2%
Methane intensity target
~119,000 tons
Methane avoided per year
~9.8M tons
CO₂e avoided per year (GWP20)
~$38M
EPA COBRA health benefits per year
Cost varies
Incremental annual cost: net negative for some levers; cost varies by type of abatement technology implemented
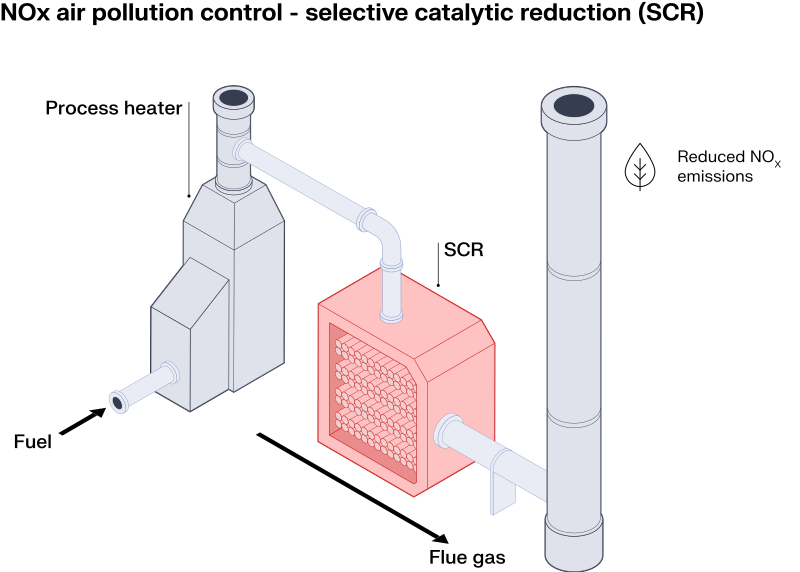
NOx air pollution controls include low-NOx burners (LNB), which reduce NOx formation inside combustion equipment, and selective catalytic reduction (SCR), which removes NOx from flue gas after combustion.
24,000 tons
Modeled NOₓ baseline per year (statewide)
1,800 tons
NOₓ reduction per year from low-NOₓ burner (LNB) installation
Cost: $3 million/year
Health benefit: $66 million/year
2,400 tons
NOₓ reduction per year from SCR installation
Cost: $26 million/year
Health benefit: $85 million/year
4,200 tons
NOₓ reduction per year from stacked LNB and SCR installation
Cost: $29 million/year
Health benefit: $149 million/year
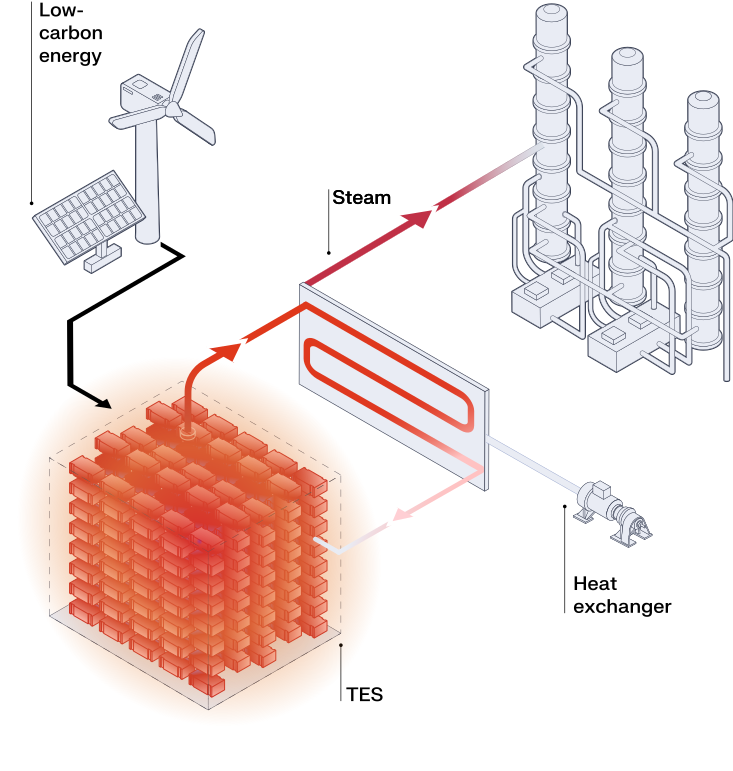
Thermal energy storage uses electricity to heat a storage medium and later discharges that stored heat to produce steam for industrial process heating.
36M MMBtu
Eligible boiler heat per year (share attributable to conventional boilers in target facilities)
2.4M tons
Maximum CO₂ reduction potential per year, if TES is charged with 100% renewable energy
$90M–$134M
Human health benefits per year, if TES is charged with 100% renewable energy
$545M
Incremental annual energy cost — Scenario 1: average 2025 Texas industrial retail and gas prices
TES heat cost: $19.6/MMBtu; gas-boiler cost: $4.5/MMBtu
$36M
Incremental annual energy cost — Scenario 2: favorable scenario for TES
Electricity: $30/MWh all-in; natural gas: $6.61 per thousand cubic feet (MCF), 2022 high-price case
TES heat cost: $9/MMBtu; gas-boiler cost: $8/MMBtu
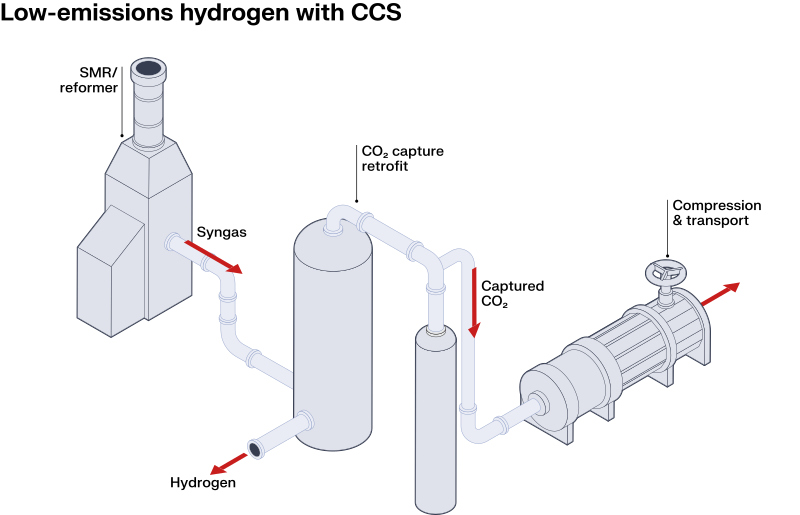
Low-emissions hydrogen is created from hydrogen production units such as steam methane reformers and autothermal reformers that are outfitted with carbon capture equipment; the captured CO2 is then used or sequestered instead of released into the atmosphere.
6.6M tons
Net CO₂e avoided per year
$5 billion
Estimated capital expenditure (capex), statewide
$860M
Estimated annual cost per year, statewide
$130/ton
Cost per ton of CO₂e avoided
$40/ton
Cost per ton of CO₂e avoided, including the federal 45Q tax credit
Policies and market drivers summary
To encourage deployment of these five technologies, Texas could undertake policy and market-driving actions for its chemicals industry using a phased approach.
- Over the next two years Texas could organize markets to reduce transaction costs, create market signals, and begin planning for the long-term through actions that do not require new legislation.
- Over the next five years the state could work with the Texas Legislature to authorize funding to improve project economics, reduce capital barriers, and attract investment into industrial modernization projects.
- Over the next decade, Texas could scale its competitive advantage by updating the State Improvement Plan to reflect the availability of new technologies in the chemicals manufacturing sector.
Changing policy and markets will require collaboration between industry, the Texas Legislature, Texas’s government agencies, academia, and local communities.
Phase 1 (0–2 years): Organize Markets to reduce transaction costs, create market signals, and begin planning for the long term.
| Policies and market drivers | Levers encouraged |
|---|---|
| Author an industrial modernization strategy |     |
| Establish a Texas Chemicals Efficiency and Modernization cohort to accelerate voluntary adoption of AI-driven predictive maintenance technologies | |
| Clarify eligibility for new technologies to receive pollution control tax exemptions | |
| Support an industry-led Gulf Coast low-leak natural gas and oil buyers’ alliance for chemical producers. |  |
Phase 2 (2–5 years): Improve project economics through reducing capital barriers and attracting investment into industrial modernization projects.
| Policies and market drivers | Levers encouraged |
|---|---|
| Expand state-level industrial demonstration grants and retrofit incentives available to chemical production facilities in Texas. | |
| Provide state-backed finance to attract large-scale private investment in modernizing chemicals production. | |
Phase 3 (5+ years): Scale Texas’s competitive advantage and position Texas as the preferred location for next generation chemical manufacturing.
| Policies and market drivers | Levers encouraged |
|---|---|
| Implement an industrial modernization plan | |
| Integrate state implementation plans for industrial emissions reductions | |
Introduction
Texas can extend its international leadership in chemicals manufacturing by modernizing production
The United States is the second-largest chemicals producer globally, representing approximately 10% of global production. Texas is the largest producer of chemicals in the United States and one of the most important chemicals production hubs in the world. The Gulf Coast specializes in “basic chemicals” which include hydrogen, ammonia, methanol, olefins, and aromatics. These serve as building blocks for plastics, fertilizers, fuels, solvents and other products essential to modern life.
Chemical manufacturing is also a major pillar of the Texas economy. The sector contributes approximately $53 billion to national GDP, with basic chemical manufacturing accounting for roughly $26 billion, or around half the sector’s total GDP contribution. The industry supports approximately 35,000 Texas jobs and is one of the state’s largest exports with basic chemical manufacturing exports valued at roughly $19 billion.
Texas’s industrial leadership also means that the state has significant exposure to air pollution associated with chemicals production. Based on RMI analysis, Texas has 52 facilities producing one or more primary chemicals (see Appendix B for the full facility list included in this state analysis). Together, these facilities emit an estimated 71.3 million tons of CO2e pollution each year, including approximately 25.6 million tons of CO2e from direct facility operations.
Olefins, a plastics precursor, are the dominant primary chemical produced in Texas, with 26 facilities emitting 55 million tons of CO2e per year across Scope 1, Scope 2, and upstream Scope 3 emissions. Hydrogen is the next largest primary chemical category, with 15 facilities in the state emitting an estimated 11.9 million tons of CO2e per year.
Chemical facilities also emit criteria air pollutants (CAPs) and hazardous air pollutants (HAPs) that impact local air quality and increase health risks associated with toxic exposure including nitrogen oxides (NOx), carbon monoxides (CO), and volatile organic compounds (VOCs), and 1,3-butadiene. These pollutants are especially relevant in industrial regions where emissions contribute to ground-level ozone formation and toxic exposure concerns. For instance the Houston-Galveston-Brazoria (HGB) area is severe non-attainment of the 8-hour National Ambient Air Quality Standard (NAAQS) for Ozone.
As global markets increasingly differentiate products based on emissions intensity, Texas has an opportunity to protect and extend its chemicals advantage. Policies such as the European Union’s Emissions Trading System (ETS) and Carbon Border Adjustment Mechanism (CBAM) signal a broader shift toward carbon-informed trade and procurement standards. While CBAM’s initial scope is limited to cement, iron and steel, aluminum, fertilizers, electricity, and hydrogen, in its 2025 review, the European Commission concluded that the phased expansion of CBAM to certain chemicals could be technically feasible and will be further considered in 2027. Additionally, the International Maritime Organization’s 2023 strategy requiring a reduction in carbon intensity of international shipping and uptake of zero or near-zero emission fuels displays the potential increase in demand for lower-emissions methanol and ammonia. These policies reflect a growing market expectation that industrial producers will be able to measure, manage, and reduce embedded carbon emissions.
Texas has been building out petrochemical facilities dating back to World War II. Many facilities now face a modernization challenge: how to upgrade these legacy production assets while maintaining the state’s industrial competitiveness. By supporting industrial modernization through state policies and market-driving actions, Texas can position its chemicals industry to compete in emerging markets for lower-emissions products, attract investment, improve air quality, and reduce emissions.
Technology Levers
Modernizing Texas’s primary chemical sector requires solutions that can be deployed today at the scale and speed needed to transform the industry. This report focuses on five technology levers: AI-driven predictive maintenance, low-leak natural gas procurement, NOx air pollution control, thermal energy storage (TES) for industrial steam, and low-emissions hydrogen with carbon capture and storage (CCS). These technologies were selected due to their technological and commercial viability for near-term deployment and ability to deliver measurable impact within the current decade. Each technology is also retrofit-friendly, allowing existing facilities to modernize incrementally rather than relying on the capital intensity and long planning timelines of greenfield construction.
These five levers were selected from 24 modernization technologies based on scoring criteria that evaluated the political feasibility, implementation feasibility, and potential impact of these solutions in Texas. The scoring criteria included: cost and economic viability relative to existing industrial practices; political and regulatory feasibility; fit with the state’s existing infrastructure, energy systems, and supply chains; speed to deployment; co-benefits such as improved reliability and operational flexibility; and emissions reduction potential of greenhouse gasses (GHGs), CAPs, and HAPs.
Each of the five selected technology levers was analyzed to understand its impact when implemented at scale across the applicable primary chemical facilities in Texas, as well as the practical considerations needed for wide-scale deployment.
| Metric | Value |
|---|---|
| Potential Unplanned Maintenance Events Avoided | ~100 events/year, ~2 events/facility/year |
| Deployment Cost | $22 million–$40 million, ~$0.4 million–$0.8 million/facility |
| Avoided Production Losses | ~$300 million/year, ~$6.3 million/facility/year |
| CO2 Avoided | 65,000 tons/year |
| NOx Avoided | 27 tons/year |
| VOCs Avoided | 140 tons/year |
Overview and application
Chemical plants require continuous operation of their pumps, compressors, valves, motors and other equipment to keep the facility operating at full capacity. When this equipment fails unexpectedly, the facility may need to shut down, vent or flare gases, and endure downtime while repairs are made. These incidents result in lost production, repair costs, and acute spikes in toxic chemicals and GHG pollutants.
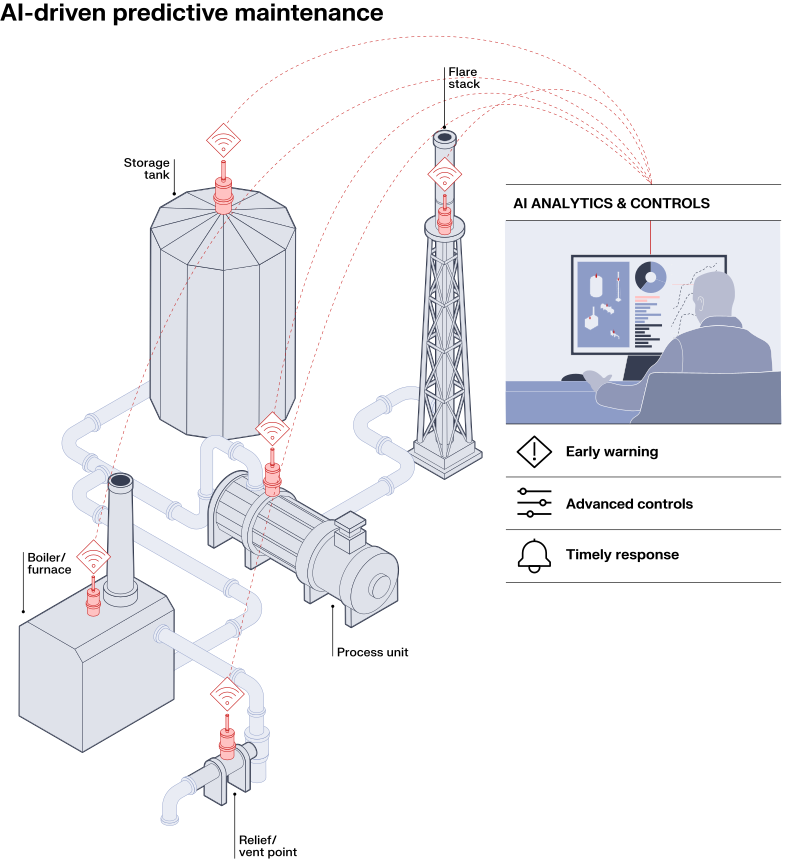
AI-driven predictive maintenance can help facilities identify problems before equipment fails. Sensors track the operation of the equipment by measuring vibration, temperature, pressure, and flow. Bundled with AI analytics software, problems can be detected based on abnormal patterns and the software will alert operations and maintenance teams so that repairs can be made during planned maintenance windows while the unit remains running or before the problem causes a larger unit upset. This software is most effective on equipment that shows warning signs of failure such as compressors, pumps, valves, and instrumentation. AI-prediction cannot prevent all shutdowns, such as those from power outages, weather related events, operator errors, and sudden failures.
Impact on Texas facilities
Based an analysis of Texas Commission on Environmental Quality data from 162 maintenance-related emissions events at major chemical facilities between 2021 and 2025, roughly 85% of the events in this sample involved failure mechanisms that appeared potentially detectable through better equipment monitoring. The statewide impact of implementing AI-driven predictive maintenance was extrapolated from this sample set by applying an effectiveness factor and expanding to all 52 chemical production facilities in Texas. We found that each year, AI-driven predictive maintenance could avoid:
- Almost 100 events across Texas primary chemicals facilities
- Approximately 65,000 tons of CO2 emissions
- Approximately 27 tons of NOx emissions and 140 tons of VOCs, reducing ground-level ozone formation
- Approximately 6 tons of benzene and 7 tons of 1,3 butadiene, improving worker and fenceline-community health
Although GHG emission reductions are relatively small compared to the sector’s annual emissions, predictive maintenance addresses these acute, unpredictable releases that have direct impact on communities and workers and introduce reputational risk. Based on EPA COBRA modeling of the associated NOx and VOC reductions, the modeled air-quality improvements could produce up to $1.5 million per year in monetized health benefits.
The cost of installing new sensors, upgrading software and licensing, and ongoing maintenance are estimated at $0.4 million to $0.8 million per facility over the first five years of the installation. For the state, if all 52 chemical facilities implemented this technology, it would cost $22 million to $40 million over five years.
Using an average 48-hour downtime for maintenance events, the statewide modeled savings from avoided production losses are roughly $330 million every year. These significant annual cost savings, compared to the statewide implementation cost, can bring short payback periods on lost production alone. The value of avoiding a major failure can be much higher when maintenance costs, overtime hours, product quality events, and reputational risk are factored into the equation.
Deployment considerations
Deployment of AI-driven predictive maintenance will not require every facility to install monitors on every piece of equipment at their site. Facilities should begin with equipment that is a single point of failure or most likely to cause a major shutdown, safety incident, or emissions event. The deployment might cover 10% to 20% of high-consequence pieces of equipment rather than the whole facility.
Different facilities will also need to evaluate their readiness to both install the sensors and software and to monitor and respond to alerts with sufficient time and personnel so that the events do not escalate to unit upsets. This evaluation will be on a facility-by-facility basis as sites consider implementing AI-driven predictive maintenance.
| Metric | Value |
|---|---|
| Annual Natural Gas Procurement in TX for Chemical Feedstock and Fuel | ~420 million MMBtu |
| Methane Intensity Baseline | 1.71% (North America average) |
| Methane Intensity Target | <0.2% |
| Methane Avoided | ~119,000 tons/year |
| CO2e Avoided (GWP20) | ~9.8 million tons/year |
| EPA COBRA Benefits | ~$38 million/year in health benefits |
| Incremental Annual Cost | Net negative for some levers; cost varies by type of abatement technology implemented |
Overview and application
Natural gas (methane) is used in chemical manufacturing as both a fuel to power chemical facilities and a feedstock to create primary chemicals. Texas chemical manufacturing facilities get most of their feedstock from North American oil and gas producers, with gas transported to facilities through pipelines. During natural gas extraction, production, and transport, methane can escape from the process due to leaks, operational decisions, flaring, maintenance, and equipment failure.
These upstream losses are important because methane is a powerful greenhouse gas. Over a 20-year window (GWP20), methane is approximately 82.5 times as potent as carbon dioxide, and over a 100-year window (GWP100), it is about 28 times as potent. Reducing these upstream losses allows for the capture and sale of additional product, while significantly reducing the supply chain emissions associated with natural gas. This report uses a 20-year GWP for methane and other non-CO2 emissions calculations.
The emissions intensity of natural gas supplied to chemical manufacturers can vary substantially depending on where and how the gas is produced and transported. Using RMI’s Oil Climate Index plus Gas (OCI+) model, we estimated a wide range of production and transport (upstream) emissions intensities for natural gas serving Texas chemical manufacturers, as shown below. Methane intensities can vary by as much as 100 times between the highest-emitting production and an openly certified low-leak volume of gas.
These differences are large enough to matter. Ongoing research finds that there is no “standard barrel” of oil and gas. Certified low-leak gas is defined by standards set by independent, third-party organizations, such as MiQ, which denote the level of methane intensity in certified gas, or simply the amount of methane that leaks per unit of natural gas produced. Some suppliers have feedstock that is certified as low as A-grade at 0.05% methane intensity. For example, the open source, independent organization MiQ has currently certified an estimated one-quarter of US gas under the 0.2% methane intensity threshold, a passing grade. This threshold was adopted by the industry in the Oil and Gas Decarbonization Charter in 2023. Thus, a ready supply of low-methane intensity gas is available today for chemical manufacturers.
According to RMI research, however, gas and oil assets, including those producing associated gas, that provide feedstock to US chemical plants have an average methane intensity of 2.2%, meaning 2.2% of methane is released into the atmosphere throughout the production and transport process before the natural gas reaches the end buyer. This methane intensity varies widely across different assets, with studies indicating leak rates in the double digits, especially during satellite-detected super-emitting events.
To account for the range of methane intensities across gas supplied, this study estimates an average methane intensity of 1.71% currently, which assumes that 25% of the gas used by Texas chemical plants is certified at 0.2% and the remainder averages 2.2%. Using this average provides a conservative estimate of the climate benefits that chemical manufacturers can drive through their supply chain purchasing power.
Chemical manufacturers can therefore play an important role in reducing upstream emissions by signaling demand for low-leak gas from their suppliers. Importantly, chemical facilities do not need to modify their equipment to receive certified low-leak gas. The benefit is in the supply chain leading up to the chemical facility. This presents a market opportunity for chemical manufacturers to use procurement to encourage their suppliers to reduce upstream and transport methane leakage.
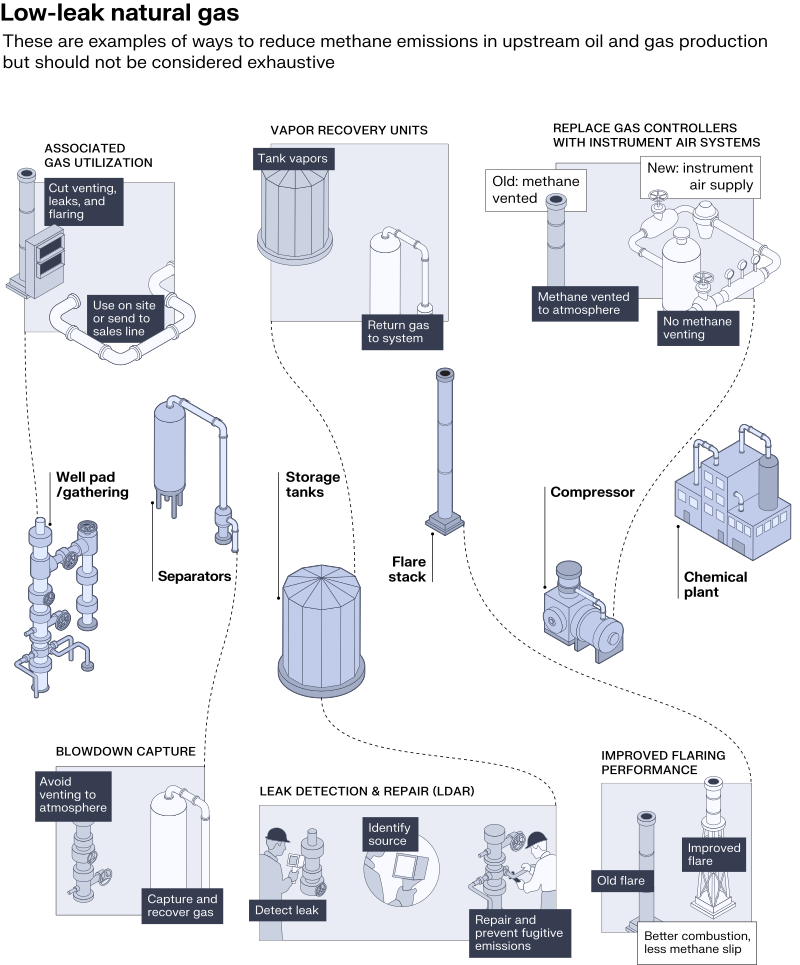
The IEA marginal abatement cost curve (MACC) lists eight different measures that can be used to mitigate emissions in the upstream supply chain. These measures include associated gas utilization, improved flaring, blowdown capture, pump replacement, instrument air system improvement, vapor-recovery units, compressor seal replacement, and electrification of motors. These improvements reduce venting, equipment losses, and leaks, and capture gas that would otherwise be released into the environment. Some producers may achieve lower methane emissions by implementing the least-cost abatement measures included in the IEA MACC curve, and low premiums on certified natural gas today reflect that producers do not necessarily pass the full cost of methane abatement on to the buyer when selling certified low-leak gas.
Impact to Texas facilities
The 52 chemical facilities in Texas procure about 420 million MMBtu of natural gas each year for use as both feedstock (for SMR/ATR processes) and fuel for industrial heating. If all facilities provided the demand signal and purchased low-leak gas versus the baseline under our modeled scenario:
- The state could avoid approximately 119,000 tons of methane emissions, which equates to about 9.8 million tons of CO2e emissions annually (assuming a GWP20)
- The state would avoid approximately 33,000 tons of VOC emissions, resulting in an annual health benefit in Texas of around $38 million based on EPA COBRA
The emissions reductions associated with natural gas procurement do not require on-site modifications and result in significant Scope 3 climate benefits that will lead to an overall lower emissions product from these facilities.
The cost to the chemical industry is driven by the procurement premium of certified natural gas. Based on recent certified gas purchasing programs around the country, the premium for lower-leak gas can be as low as $0.01 to $0.12 per MMBtu. However, these premiums may only exist in situations where there is already sufficient supply of certified gas to meet demand.
Production and procurement of certified natural gas is both an efficiency and an emissions reduction lever for Texas. Reducing leakage of methane improves efficiency of the natural gas system, reducing losses across the system that can be transformed into useful products.
The statewide annual human health benefit if all gas procured by chemical production facilities goes from baseline level methane emissions to certified low-leak level methane emissions is approximately $38 million. Annually, about 119,000 tons of methane would be contained that would have been directly emitted.
Deployment considerations
The largest challenge with adoption of low-leak gas procurement is ensuring that the buyer, in this case the chemical producers, can accurately report the benefits of procuring the lower-emissions product. The buyer needs clear accounting and claim guidance, while ensuring that there is no double counting of emissions reductions along the supply chain, to claim the supply chain emissions benefits associated with the extra cost to purchase the lower-leak gas. By procuring certified low-leak gas, chemical facilities will maintain competitiveness in the emerging global market for low-emissions products.
In some cases, such as when implementing leak detection and repair (LDAR), associated gas utilization, and blowdown capture, abatement costs can be negative, signaling that it is net beneficial for natural gas suppliers to implement mitigation technology and increase efficiency of their systems. According to RMI’s Chemistry in Transition report, methane leak mitigation is the second most impactful near-term emissions reduction lever after efficiency measures.
Individual supply chains will vary substantially in their baseline intensities and rates at which they are able to achieve lower emissions thresholds. Clear accounting and verification and measurement practices are critical for the credibility and success of this technology lever.
In a policy of this type, certificates can either be “bundled” (trace and claim) or “unbundled” (book and claim) from the actual physical gas that is sold. The policy could require that any obtained certificates are associated with the actual physical gas that is obtained, or alternatively, limit allowable certificates to a specific geographic region. It could also be worth evaluating a requirement that buyers obtain gas or certificates from regions that are primarily oil-producing regions. This is because these areas generally have higher methane intensities than non-oil producing regions. Unbundled energy attribute credits are currently the most common way to buy low-leak gas, but more bundled or direct procurement options could be possible depending on the specific chemical producer.
| Metric | Value |
|---|---|
| Modeled NOx Baseline (statewide) | 24,000 tons/year |
| Low NOx Burner Installation | NOx Reduction: 1,800 tons/year Cost: $3 million/year Health Benefit: $66 million/year |
| SCR Installation | NOx Reduction: 2,400 tons/year Cost: $26 million/year Health Benefit: $85 million/year |
| Stacked Installation | NOx Reduction: 4,200 tons/year Cost: $29 million/year Health Benefit: $149 million/year |
Overview and application
Industrial combustion sources such as boilers, steam generators, process heaters, and furnaces are used across industrial facilities to generate heat. These units burn natural gas or other fuels to provide heat for production, but high flame temperatures promote the formation of NOx. The amount of NOx formed depends on burner design, flame temperature, oxygen levels, and other operational conditions. NOx contributes to ground-level ozone, which negatively effects respiratory and cardiovascular health.
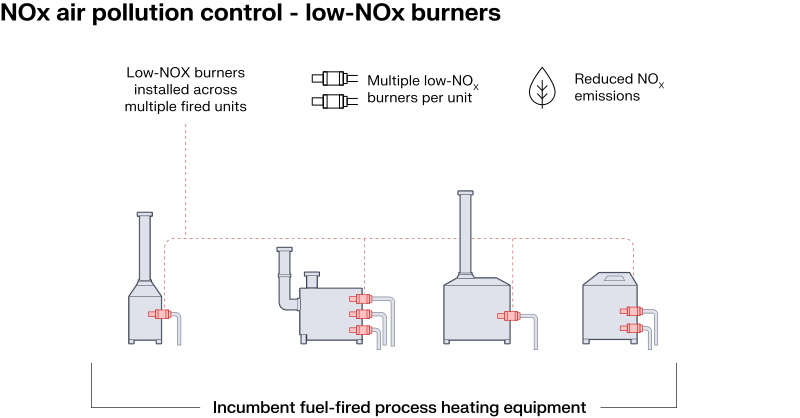
Low-NOx burners (LNBs) reduce NOx formation inside the combustion unit. They improve fuel-air mixing and stage the combustion process so that less oxygen and fuel are present together at the hottest point in the flame, lowering peak flame temperatures and limiting thermal NOx formation. Depending on the existing equipment, an LNB retrofit may involve replacing the burner assembly, modifying the burner register, or adjusting how fuel and combustion air are introduced into the unit. In practice, burner replacement is often paired with upgraded combustion controls and tuning.
Selective catalytic reduction (SCR) controls NOx after combustion. The system injects ammonia or urea into the flue gas and passes the mixture across a catalyst, where NOx is converted primarily into nitrogen and water before the exhaust reaches the stack. SCR can achieve much deeper NOx reductions than burner changes alone, but it requires additional equipment, reagent handling, catalyst management, and sufficient space in the exhaust system and is typically compatible with larger, continuous systems. The two technologies can be stacked by applying burner improvements first, and then SCR to the emissions that remain.
Impact to Texas facilities
The Texas NOx inventory sets a baseline of approximately 24,000 tons of annual NOx emissions from our target chemical facilities. The analysis assigns a NOx reduction factor for LNBs, SCRs, and the stacked scenario to determine:
- Low NOx burners alone reduce approximately 1,800 tons of NOx per year
- SCR installations reduce approximately 2,400 tons of NOx per year
- The stacked scenario with LNBs and SCR may reduce about 4,200 tons of NOx per year
Approximately 95% of the reduction from these technologies is associated with olefins facilities. These sites have large fired heaters, furnaces, and boilers, which give them much higher emissions reduction potential than those of other chemical production facilities.
Using annualized cost assumptions, the screening cost estimates for these installations for the state of Texas are $3 million per year for low NOx burners, $26 million per year for SCR, and $29 million per year for the stacked strategy. Actual costs will depend on equipment size, burner count, furnace access, ductwork, etc.
Reducing NOx can lower the formation of ground-level ozone and fine particulate matter. This leads to benefits for workers and neighboring communities. The screening estimate from EPA COBRA estimates the monetized benefits from avoided health effects for these technologies is $65 million (LNB), $85 million (SCR), and $150 million (stacked). All three solutions can result in a positive benefit-to-cost ratio indicating high health-related returns compared to the investment required.
Deployment considerations
Better unit-level data is needed to determine where each technology is most appropriate. Publicly available information does not consistently identify which combustion units already have low-NOx burners, ultra-low-NOx burners, SCR, or other controls. Before implementation targets are established, facilities or regulators would need to confirm the existing control configuration, baseline emissions, unit size, operating schedule, age, and remaining useful life of individual boilers, heaters, and furnaces.
For burner retrofits, key questions include flame stability, furnace operation, transient behavior, and compatibility with existing burner management systems. Installation may require coordination with planned downtime due to needs for furnace internal modifications or safety system upgrades.
For SCR, feasibility depends on whether the furnace is compatible with the SCR catalyst and whether space is available for ductwork and additional equipment. The statewide estimates depend on which facilities can install these technologies and represent the best-case deployment opportunity.
The primary business motivation will differ by technology. LNBs paired with controls optimization may offer fuel savings and operating improvements in addition to emissions compliance. SCR is more likely to be driven by the value of deep NOx reduction, regulatory requirements, or the public-health benefits of reducing emissions from large sources. In both cases, aligning installation with planned capital cycles can improve feasibility and reduce disruption.
| Metric | Value |
|---|---|
| Eligible Boiler Heat (share attributable to conventional boilers in target facilities) | 36 million MMBtu/year |
| Max CO2 Reduction Potential (if TES charged with 100% renewable energy) | 2.4 million tons/year |
| Human Health Benefits (if TES charged with 100% renewable energy) | $90 million to $134 million/year |
| Energy Cost Scenario 1: Average 2025 TX Industrial Retail & Gas Prices | TES Heat Cost: $19.6/MMBtu, Gas-Boiler Cost: $4.5/MMBtu Incremental Energy Cost Increase: $545 million/year |
| Energy Cost Scenario 2: Favorable Scenario for TES Electricity Assumption: $30/MWH; all-in electricity price Natural Gas Assumption: $6.61/MCF; 2022 high-price case | TES Heat Cost: $9/MMBtu, Gas-Boiler Cost: $8/MMBtu Incremental Energy Cost Increase: $36 million/year |
Overview and application
Most chemical manufacturing facilities use natural gas-fired boilers to produce steam for process heating needs. TES, like a thermal battery, is a commercial-scale technology that uses electricity to make heat, stores that heat in hot rocks or other media, and delivers steam to the facility when needed. Unlike a conventional gas or electric boiler, TES can shift electricity use into cheaper operating hours and continue supplying steam on demand. TES can displace gas boilers or be operated in a hybrid configuration alongside them.
By reducing or displacing operation of on-site boilers, TES can lower Scope 1 GHG emissions, combustion-related NOx, and other criteria air pollutant emissions at the facility. These on-site air-quality improvements can provide near-term benefits for workers and nearby communities. The net climate and public-health effects, however, depend heavily on the emissions intensity of the electricity used for charging and when that electricity is generated.
Impact to Texas facilities
Natural gas boilers at the Texas chemical facilities included in our analysis generate approximately 36 million MMBtu of useful heat each year to provide steam and process heat for primary chemical manufacturing. In a scenario where thermal energy storage charged with zero-emissions electricity displaces 100% of gas-boiler-based steam generation at these facilities, approximately 2.4 million tons of CO₂ emissions could be avoided annually. However, if the TES systems charge using electricity with the current average Texas grid mix, annual GHG emissions would increase by approximately 1.6 million tons. The climate benefit of TES therefore depends on when the systems charge, and which power-generation sources serve the additional electricity demand.
At average 2025 industrial retail electricity and natural gas prices, the energy cost of TES heat is approximately $19.6/MMBtu, compared with approximately $4.5/MMBtu for heat produced by natural gas boilers. Across the modeled statewide opportunity, annual energy expenditures would increase from approximately $162 million for natural gas boilers to $707 million for TES. This energy-cost difference, commonly referred to as the spark gap, is the primary barrier to widespread TES deployment.
We also modeled a favorable scenario combining elevated natural gas prices with lower-cost electricity. For natural gas, we used the recent 2022 high of $6.61/MCF, which equates to approximately $8/MMBtu of delivered heat after accounting for an assumed boiler efficiency of 80%. For electricity, we used an all-in TES charging price of $30/MWh, representing a scenario in which TES can access wholesale-linked pricing while still paying applicable grid and delivery charges. At this electricity price, and assuming 98% TES efficiency, the energy cost of TES heat would be approximately $9/MMBtu, about 13% higher than gas-fired heat.
Assuming all TES systems operate with an eight-hour daily charging window and provide heat throughout the day, displacing 100% of modeled gas-boiler heat demand at the target facilities would require approximately 19 GWh of thermal storage capacity and 4 GW of electric charging capacity. Actual projects would be smaller and deployed in phases, but the aggregate scale illustrates why utility, interconnection, and transmission planning will be critical.
Transitioning away from reliance on gas boilers through replacement or hybrid systems with TES can reduce combustion-related CAP emissions at facilities. In the scenario where 100% of gas boilers are replaced by TES charged with zero-emission electricity, Texas could see approximately $90 million to $134 million per year in annual human health benefits according to EPA COBRA. However, the CAPs emissions reduction potential and the associated human health benefits are dependent on the emissions intensity of the electricity used to charge TES systems and the ability of facilities to fully transition to TES versus implement TES in a hybrid configuration with gas boilers.
Deployment considerations
Deployment should begin with individual steam headers or stable load blocks rather than assuming full boiler replacement at every facility. Pilot projects should test optional rate structures that allow flexible industrial loads to benefit from lower-cost hours while still paying transparent, cost-based grid charges. At the same time, demand-charge structures should be designed so they do not erase the value created by concentrating charging within a limited window. Price-responsive charging should also be paired with clean-power procurement or an emissions signal, since the lowest-cost hours are not necessarily the lowest-emission hours.
Before moving beyond pilots, facilities and utilities should plan for interconnection, transmission, backup steam supply, outages, and abnormal operating conditions. Because Texas combines a competitive wholesale power market with a large concentration of major chemical facilities, it is a strong candidate for testing flexible industrial rate designs and large-load interconnection pathways.
| Metric | Value |
|---|---|
| Net CO2e Avoided | 6.6 million tons/year |
| Estimated CAPEX (statewide) | $5 billion |
| Estimated Annual Cost (statewide) | $860 million/year |
| Cost per tCO2e | $130/ton |
| Cost per tCO2e (incl. 45Q) | $40/ton |
Overview and application
CCS is a carbon management technology that reduces carbon emissions from industrial processes. When natural gas is converted to hydrogen or syngas to produce hydrogen, ammonia, or methanol, CO2 is produced and emitted directly from the chemical reaction. The CCS unit separates 95% or more of the CO2 emitted from this conversion, and the carbon is captured to be permanently stored or utilized instead of emitted directly into the atmosphere. To perform this capture step, renewable power is required. If not renewable, emissions may increase depending on the grid mix used.
Impact on Texas facilities
Installing or retrofitting hydrogen production units with CCS allows hydrogen, methanol, and ammonia facilities to decrease emissions from hydrogen production and capture useful CO2. In Texas, installing these systems on all relevant facilities could:
- Reduce approximately 6.6 million tons of CO2e emissions annually
- Reduce criteria air pollution by roughly 1% statewide (if using renewable energy)
- Result in approximately $4 million to $6 million of monetized health benefits per EPA COBRA
In Texas, the screening cost to implement CCS on hydrogen production streams at all 20 hydrogen, ammonia, and methanol facilities in the state would be approximately $860 million per year on a levelized basis including capture, transport, and storage costs before the federal 45Q carbon oxide sequestration tax credit (45Q). This represents approximately $130 per ton of CO2e avoided.
Assuming eligibility for the 45Q tax credit at $85/ton of CO2 stored, the annual cost for the state decreases to approximately $290 million per year with an effective cost of around $40 per ton of CO2e avoided.
Since CCS units require power to operate, to achieve both CO2 and CAP emission reductions, Texas’s grid would need to be at least 92% renewable energy. Benefits were assumed with a grid with 100% renewable energy. CCS implementation with 100% renewable power would also result in a roughly 1% reduction in statewide CAPs emissions. According to EPA COBRA modeling, the CAPs reductions in Texas would lead to annual human health benefits of $4 million to $6 million.
Deployment considerations
With the implementation of CCS for low-emissions hydrogen, Texas is positioned to be a carbon management leader due to its abundant CO2 infrastructure, storage, and technological expertise in CO2 management and utilization.
While CCS on hydrogen is a solution that leads to substantial reductions in CO2e emissions statewide, there are multiple factors that should be considered when implementing this solution. The need to power CCS units is a critical aspect to consider when choosing to implement CCS on hydrogen. Adding CCS to hydrogen production systems increases the electricity requirements at each facility by approximately 11 times. As noted above, the power supplied to the capture unit needs to be at least 92% zero-emissions energy to achieve both CO2 and CAP emissions reductions and avoid burden shifting to electricity generation communities. If CCS were to be installed or retrofitted on hydrogen production facilities powered by today’s grid, CAPs and CO2 emissions would increase at fossil electricity generation sites, shifting the burden to those communities.
Policy and Market-Driving Recommendations for Texas
Implementing technological improvements will transform and modernize chemicals production in Texas in ways that strengthen chemical industry competitiveness, maintain energy leadership, improve system reliability, and preserve Texas’s position as a manufacturing hub far into the future. But new policies and enabling actions are necessary to help the Texas chemical industry adopt these new technological improvements. A portfolio of market-based, educational, financial, and regulatory policies could be implemented in three phases:
- Organize markets over the next two years
- Improve project economics over the next five years
- Scale Texas’s competitive advantage over the next decade
Collaboration between industry, the Texas Legislature, Texas government agencies, academia, and local communities will be necessary to realize all the possible benefits of transforming chemicals production. The following policy and market-driving recommendations build off pre-existing efforts or concepts whenever possible, but there are many ways to encourage modernization, and actual implementation details may change.
Phase 1 (0–2 years): Organize markets to reduce transaction costs, create market signals, and begin planning for the long term.
The Phase 1 set of policies and market drivers focus on actions that can begin immediately without new legislation. These actions can take place through chemical industry self-organization or through the efforts of state agencies under their existing authority.
Policy Recommendation #1: Author an industrial modernization strategy
Applies to
To support the modernization of the chemical industry in Texas, formalized programs paired with consistent engagement with the state will be critical, and this can be achieved by centralizing a vision and implementation planning for Texas’s industrial future. One way to do this would be to expand Texas’s current economic development plan, which identifies chemicals as a key industry, to include an implementation-focused industrial modernization strategy. Publishing a long-range planning document for the modernization of industrial facilities, including chemicals facilities, could help state agencies crystallize their own role in ushering in new, globally competitive and cleaner forms of production, identify what programs and regulations need modification to encourage this transition, and signal certainty to chemical producers in their partnership with the state.
The Governor’s Office of Economic Development and Tourism (TEDT), in conjunction with the Texas Economic Development Corporation (TxEDC) and the Texas Commission on Environmental Quality (TCEQ), could produce an Industrial Modernization for Chemicals Facilities guide. This guide could outline the economic development and export competitiveness opportunity in low-emissions chemical production, measure the air quality benefits of chemical production modernization, detail promising technological interventions, include grid planning considerations for new large loads, and clarify the state’s plan to engage in supporting chemical facilities in transition to improve air quality and maintain Texas’s global energy leadership.
An industrial modernization strategy could be modeled off of states that are doing similar planning for their industrial sectors, like Michigan’s Office of Labor and Economic Opportunity’s Economic Transition report, which details pathways for cementing Michigan’s strong automaking legacy and preparing its workers for the future, even as production methods change. A strong modernization strategy could evaluate global markets for low-emissions chemicals, identify infrastructure needs and priority investment areas, and evaluate the efficacy of technologies to improve public health and reduce pollution and emissions. A strong blueprint could also recommend state support mechanisms like streamlined permitting of industrial efficiency and emissions-savings projects, grants and financing programs, and technical assistance.
Policy Recommendation #2: Establish a Texas Chemicals Efficiency and Modernization cohort to accelerate voluntary adoption of AI-driven predictive maintenance technologies.
Applies to
The purpose of the cohort would be to reduce information barriers and accelerate technology deployment. We recommend an initial emphasis on AI-driven predictive maintenance, as the cost efficiencies are most likely to attract industry attention, but subsequent cohorts could expand to focus on other additional technological levers like thermal energy storage and low-emissions hydrogen with CCS. This recommendation is focused on education and implementation of technologies in Texas facilities, but with enough interest could be expanded to Louisiana facilities as well, forming a Gulf Coast cohort.
A technical learning cohort has precedence and can build upon existing educational infrastructure. For example, the US Department of Energy (US DOE) implements the industrial energy management learning cohort ISO 50001 Ready Program. Membership in the Texas Chemicals Efficiency and Modernization cohort would be voluntary and could be encouraged by a trusted industry group like the American Chemistry Council or Texas Chemistry Council. The Texas State Energy Conservation Office (SECO) and the University of Houston already support industrial energy-management trainings, forums, workshops, and technology showcases for industries. This chemicals cohort could be a specific workstream within that established framework or it could be an adjacent and complementary effort.
Other Texas-based organizations such as the Industrial Technical Assistance Center (ITAC) at Texas A&M and the Texas PACE Authority could serve educational and technical assistance roles for the cohort.1 State government agencies like the TCEQ and SECO itself could invite facilities to participate, possibly help convene the cohort or finance the convening, and promote the reports written from the cohort’s experience.
After formalizing the organizational structure of the cohort, the convening organization would enroll 5 to 10 industrial chemical facilities. Membership in the cohort — as a voluntary learning effort — would come with no obligations. After membership is established, the cohort would receive educational experiences like site tours, expert briefings, and technical information from technology providers on how AI helps predictive maintenance and the new equipment necessary. The cohort would then be surveyed to identify common sensor equipment, software, and deployment challenges as well as data collection needs. As the educational experiences continue, facility operators would work with technology providers to estimate the cost to deploy predictive maintenance at their facilities. The convener could publish anonymized results of the survey alongside cost data.
Upon completion of the educational experiences, when interest in the technologies has grown, the convener would implement a voluntary “efficiency and modernization partnership for emissions-event reduction” with those facilities that intend to deploy new AI-driven predictive maintenance technologies, similar in spirit to the US DOE’s Better Plants Program with subsidies for contracted technical assistance. The convener or the technical assistance partners could then publish annual case studies showing cost, pollution, and emissions improvement due to the projects from cohort members, further disseminating the positive possibilities of deploying the AI-driven predictive maintenance technology.
In addition, the program could continue to grow in two ways after early successes: (1) more facilities could join the cohort, and (2) the curriculum could expand to cover additional technical and engineering opportunities to modernize facilities, including thermal energy storage and low-emissions hydrogen with CCS.
Policy Recommendation #3: Clarify eligibility for new technologies to receive pollution control tax exemptions.
Applies to
The Texas tax code allows chemical production facilities to reduce their sales tax and property tax bills under certain conditions. Specifically, Tax Code Section 11.31 on Pollution Control Property and Tax Code Section 151.318 on the manufacturing sales/use tax exemption for pollution-control and wastewater-reuse equipment allows facilities to claim tax reductions for investments in qualifying technologies that control for air, water, or land pollution. By clarifying the eligibility of the tax exemptions for newer technologies, chemical production facilities can improve the project economics for the technological levers this analysis reviewed. Texas has a history of using the tax code to guide the private sector, such as the research and development tax incentive and the qualified data center sales tax exemption.
The equipment for NOx air pollution control, as an older and more “traditional” form of pollution mitigation, would already qualify for Texas’s property tax and sales tax exemptions. The eligibility of equipment for newer forms of pollution mitigation — such as the sensors, monitors, control systems, and software for AI-driven predictive maintenance; the thermal energy storage media for electrification; and the CO2 capture, separation, and compression equipment for CCS on hydrogen production — need clarification from Texas’s regulatory authorities. This will require petitioning the TCEQ (for property tax exemption eligibility) and Texas comptroller (for sales tax exemption eligibility) to evaluate and make new determinations as to whether the equipment for newer forms of pollution control would qualify for the existing property tax and sales tax exemptions.
Additionally, this could take the form of TCEQ and the comptroller issuing a joint guidance memo or rule interpretation covering industrial modernization technologies with measurable emissions benefits, a determination of partial-use eligibility of these new technologies that serve more purposes than just pollution control, and a preapproved technology list. Taken together over a 10-year period, the combined value of the property tax and sales tax exemptions could reduce project costs by up to 20%.2
Policy Recommendation #4: Support an industry-led Gulf Coast low-leak natural gas buyers’ alliance for chemical producers.
Applies to
Chemical producers in Texas and Louisiana — as major consumers of pipeline natural gas, natural gas liquids, and oil for chemical feedstock and process heating — make up an influential proportion of industrial fossil fuel demand in the Gulf Coast. A buyers’ alliance is a group of purchasers that coordinate demand signals or procurement standards while retaining their own competitive purchasing decisions; for anti-trust reasons buyers’ alliances are administered by a neutral third party and do not exchange competitively sensitive data or coordinate pricing.
A buyers’ alliance could create demand certainty for certified low-leak gas and natural gas liquids and indirectly use market power to shift their upstream suppliers to verifiably reduce methane leakage during oil and natural gas extraction, processing, and transmission. Aggregated demand helps justify natural gas and oil producers investing in leak mitigation. Aggregated demand can then be translated into RFPs, procurement specifications, emissions-intensity thresholds, and potential offtake agreements.
The alliance should use technology-neutral, measurement-based certification criteria, drawing on existing standards such as MiQ, OGMP 2.0, or equivalent programs rather than creating a new standard. A buyers’ alliance in Texas and Louisiana also complements coalitions of natural gas and oil suppliers planning to lower their methane emissions, like ONE Future or the Natural Gas Supply Collaborative. Buyers alliances already exist in other sectors such as Sustainable Aviation Buyers Alliance for airlines, the Sustainable Steel Buyers Platform for large steel purchasers across sectors, and the Sustainable Concrete Buyers Alliance in the buildings and infrastructure sectors.
Spearheading creation of the alliance would likely require leadership from respected chemicals industry groups in the Gulf, such as the Louisiana Chemistry Association and Texas Chemistry Council. If that is not possible then a few large corporate owners of Texas and Louisiana facilities with sustainability commitments could start as a provisional charter-buyer steering committee. The neutral third-party facilitator should be an organization with experience working with the chemicals industry and experience creating buyers alliances, such as the Center for Green Market Activation or RMI.
Other key stakeholders for establishing a low-leak gas buyers’ alliance include the American Chemistry Council, local associations such as East Harris County Manufacturers Association, corporate owners of Texas and Louisiana chemicals producers, and representatives of state agencies that could help recruit alliance members and sponsor the initial convenings of the alliance. Members of the buyers’ alliance would agree on common procurement criteria and reporting standards, make public commitments for the purchase of low-leak gas and natural gas liquids, and publicly report annually on progress in transitioning all their natural gas and natural gas liquids usage to low-leak certified product.
State government encouragement of a voluntary, private industry-led buyers’ alliance could be a first step in achieving chemical industry supply chain reductions of methane emissions without resorting to state regulation.
Phase 2 (2–5 years) : Improve project economics through reducing capital barriers and attracting investment into industrial modernization projects.
The Phase 2 set of policies and market drivers require action from the Texas Legislature, particularly for authorization of new funding for existing and new programs that can improve the project economics of technological modernization efforts.
Policy Recommendation #5: Expand state-level industrial demonstration grants and retrofit incentives available to chemical production facilities in Texas.
Applies to
The high up-front cost of new technologies represents a barrier to modernizing chemicals production. The government of Texas, recognizing the strategic value and overall benefit to the state for continued investment in state-of-the-art chemicals production, can provide funding that would improve project economics to help chemical producers modernize, adopt innovative technologies, and improve quality of life for workers and surrounding communities. The federal government has historically funded industrial demonstration programs that can reduce pollution; given Texas’s prominence in US chemicals production, the state can leverage its domestic dominance and financially support continued innovation and leadership in chemicals production.
Texas already has a program to provide grants to the private sector to reduce air pollution — the Texas Emissions Reduction Plan (TERP) administered by TCEQ. TERP was established by the Texas Legislature in 2001 as a voluntary, incentive-driven way for Texas to meet the air quality standards of the federal Clean Air Act. The TERP Trust fund generates revenue through certain fees and surcharges on vehicles and heavy-duty equipment that create NOx pollution; in the 2024–2025 biennium the TERP Trust Fund generated nearly $600 million.
Currently almost all TERP grants are used to retrofit or replace vehicles and other mobile equipment to reduce NOx pollution, and there is limited TERP money set aside for the New Technology Implementation Grant Program (NTIG) for which stationary sources like chemical production facilities would be eligible. For example, the 2026 NTIG competitive grant round is only offering $16.5 million statewide for stationary sources — just 2.8% of all 2026–2027 projected TERP revenue.
The Texas Legislature, in coordination with TCEQ, could expand TERP’s impact on pollution from stationary industrial facilities (like chemicals production) by allocating more of the TERP Trust Fund to NTIG. Increasing the allocation of funding dedicated to industrial facilities would divert funding from mobile sources of pollution. To avoid that tradeoff, the legislature would need to supply the TERP Trust Fund with more revenue overall, likely from fees or surcharges on stationary NOx-emitting equipment. New kinds of TERP grants, separate from NTIG, could also include funding for first-of-a-kind (FOAK) demonstration projects so that Texas continues to invest in chemicals innovation.
In addition to chemicals production innovation and modernization investments, TERP funding could be dedicated toward chemicals production projects that help with grid stability, optimization, and load shifting in addition to pollution reduction. There is federal and state precedence for this type of government support for new industrial improvements that reduce pollution, including US DOE’s Industrial Demonstrations Program and California’s Industrial Decarbonization and Improvement of Grid Operations (INDIGO) program.
Policy Recommendation #6: Provide state-backed finance to attract large-scale private investment in modernizing chemicals production.
Applies to
Grants from an expanded TERP program can help incentivize deployment of new technologies in chemicals production, but the amount of investment needed will also require access to low-cost capital. The state of Texas can use its own institutions with financial authorization and concessionary capital to de-risk investments and encourage private market participation in the financing of these projects. For technologies where there is real or perceived technology risk, like in the case of FOAK technology deployment or pilot projects, public financing can help de-risk private investment, lowering the effective borrowing rate to implement innovative modernization projects.
Texas has recent experience with using state-backed financing to draw in private capital to address a policy priority: the Texas Energy Fund. The Texas Energy Fund’s current purpose is to provide low-interest loans for the construction, maintenance, modernization, and operation of electric facilities to ensure reliable electricity generation and strengthen emergency power resilience.
The Texas Legislature could use the Texas Energy Fund example and set up a separate but similar “Texas Industrial Modernization Finance program” that could provide financing to modernize chemical production facilities. As part of the new program, Industrial Revenue Bonds, already available in Texas, could be expanded and leveraged as part of financing to deploy new chemicals production technologies.
Furthermore, Texas’s SECO operates a revolving loan fund, LoanSTAR, that provides low-interest loans to state and local public institutions for energy-related cost reduction measures. When setting up a Texas Industrial Modernization Finance program for chemical producers, the LoanSTAR model could be considered as a guide.
Due to the relation between energy usage and chemicals production, Texas could also seek out additional finance capital for the new Texas Industrial Modernization Finance program through US DOE Loan Programs Office’s State Energy Financing Institution eligibility.
Phase 3 (5+ years): Scale Texas’s competitive advantage and position Texas as the preferred location for next-generation chemical manufacturing.
The final set of policies and market drivers outline long-term actions the state can take to secure and improve its competitive advantage in the chemicals industry. Texas is the number one chemical producing state in the United States and can capitalize on this advantage by pioneering innovative chemicals producing pathways, creating differentiated products that are competitive in global markets, and modernizing facilities. These policy actions can take place at any time but will be most effective after project economics are improved for low-emissions chemicals production and are therefore staged last.
Policy Recommendation #7: Implement an industrial modernization plan
Applies to
Following the publication of an industrial modernization plan recommended in Phase 1, Texas would be well positioned to implement its strategy, working in concert with regional and state-level economic development organizations and air regulating agencies in the state. Moving the plan from publication to producing results would require inter-agency coordination, as well as an expanded scope of work for multiple agencies in the state. Programs like permitting fast-tracks or additional grants and incentive programs would require additional authorities and budget granted to TEDT and TCEQ, and therefore would likely require legislative or executive action.
To improve coordination of programming, TCEQ and TEDT could consider standing up a single-door program office in this phase so that any industrial facility seeking guidance could connect with a network of technical assistance providers, navigate permitting processes smoothly, and understand what public financing they may be eligible for. Creating a single office for these interactions reduces friction for chemicals producers pursuing new projects.
Policy Recommendation #8: Integrate state implementation plans for industrial emissions reductions.
Applies to
Ozone pollution, which can cause or aggravate lung diseases like asthma, is a perennial and serious health concern in Texas. Eighteen counties in the Dallas-Fort Worth and Houston-Galveston metro areas, representing 51% of the state’s population, are in severe non-attainment for 8-hour ozone, meaning more than half of Texans are exposed to hazardous air quality. Additionally, San Antonio is in serious non-attainment for ozone, and 24 counties have special inventories for ozone precursors. NOx and volatile organic compounds (VOCs) are the most common precursors to ozone pollution.
To make meaningful progress on improving air quality in non-attainment zones in Texas, stationary emissions sources, including chemical facilities, would need to be better regulated through their air quality permits. State implementation plans (SIPs) are state tools to implement the federal Clean Air Act, and special planning occurs in regions in the state where air quality levels are out of compliance with federal regulations. In June 2024, EPA granted Texas’s request to reclassify all three areas from moderate to serious nonattainment under the 2015 ozone standard, triggering more stringent planning and control requirements. Under the Clean Air Act, higher classifications lower the threshold for what counts as a major industrial source, require additional reasonably available control technology (RACT), and impose stronger permitting, monitoring, emissions-offset, reasonable-further-progress, and attainment-demonstration requirements.
The persistence of ozone nonattainment suggests that Texas will need to secure deeper reductions from both mobile and stationary sources, where former SIPs have focused more heavily on achieving reductions from on-road sources. SIP revisions are generally triggered by a new or revised federal air-quality standard, an area’s designation or reclassification, or a missed attainment deadline. In Texas, TCEQ develops the technical analysis and proposed regulations, publishes them for public review, and submits the revision to the TCEQ commissioners for adoption — a state process that TCEQ says typically takes about six months.
Texas and the US EPA have repeatedly disputed the adequacy and reach of the state’s SIP over the past two decades. Litigation has included EPA’s treatment of Texas’s flexible-permit program, the adequacy of the state’s interstate “good neighbor” ozone SIPs, and missed or disputed requirements for controlling emissions from existing oil and gas facilities. These disputes show that the issue is not simply whether SIP provisions are strict enough, but also whether Texas’s SIP is legally enforceable and capable of achieving attainment.
Stronger integration of industrial emissions into future SIP revisions could include updated RACT requirements for existing major sources; broader source-category rules covering boilers, process heaters, turbines, engines, flares, storage vessels, process vents, and leaking equipment; tighter emissions limits and testing or continuous-monitoring requirements; and enforceable pollution-control, maintenance, and operating conditions in facility permits.
RACT generally governs existing sources in ozone nonattainment areas, while new or substantially modified major facilities are generally subject to the lowest achievable emission rate requirements under nonattainment new-source review. Best available control technology generally applies to major new or modified sources under the prevention-of-significant-deterioration program in areas meeting the relevant standard. Future SIP development could focus on strengthening technology requirements, closing exemptions, improving emissions inventories and monitoring, and ensuring that permit limits and SIP rules can be practically enforced against regulated industry.
Conclusion
Texas has long been the leader in chemicals owing to the scale of its production, infrastructure, and workforce. In the future, defined by increasing global competitiveness and shifting market conditions, this will no longer be enough. Going forward, leadership will mean operating the world’s most modern, reliable, and lower-emissions chemical manufacturing base. Texans will benefit from this modernization through improved energy security and industrial resilience, continued economic development, and reduced pollution-related health impacts.
The technologies assessed in this report provide a practical portfolio for starting this transition. AI-driven predictive maintenance and commercially mature NOx control technologies can deliver near-term emissions reduction, health benefits, and operational value. Low-leak gas procurement can substantially reduce supply chain energy waste and methane emissions. Coordinated purchasing and a strong market signal will be needed to stimulate investment in efficiency improvements across the upstream gas distribution system.
Thermal energy storage and low-emissions hydrogen with carbon capture can potentially deliver large structural emissions reduction and enable Texas to compete in evolving global low-emissions chemicals and fuels markets. However, these technologies require access to affordable low-emissions energy, enabling infrastructure, and improved project economics. Together, these five modernization levers could improve operational reliability, reduce air pollution, and abate millions of tons of greenhouse gas emissions annually.
Policies and market-driving actions can help initiate, guide, and ultimately scale this transformation. Texas could first organize markets, clarify existing incentives, and build a pipeline of investable projects. The state could then expand demonstrations, retrofit incentives, and state-backed financing. Over time, Texas could incorporate proven technologies into statewide industrial and air-quality planning.
Success will require sustained collaboration between chemical producers, technology providers, utilities, financial institutions, communities, and state government. By laying the foundation now, Texas can protect the competitive advantage of its chemical industry and ensure it remains the preferred location for the next generation of chemical manufacturing.
Appendix A: Glossary
| Term | Definition |
|---|---|
| 1,3-Butadiene | A flammable hydrocarbon gas (C4H6) regulated as a hazardous air pollutant. |
| All-cause mortality | Deaths from all causes in a population, usually measured as a count or rate over a period. |
| Ammonia | A nitrogen-hydrogen compound (NH3) used widely as an industrial chemical and fertilizer input. |
| Annualized cost | Up-front and ongoing project costs converted into an equivalent yearly cost over an analysis period. |
| Aromatics | Hydrocarbons with aromatic molecular structures, such as benzene, toluene, and xylenes. |
| Basic chemicals | High-volume chemicals, including petrochemicals and industrial gases, that are often used to make other chemicals or products. |
| Capex (capital expenditures) | Up-front costs for long-lived project assets such as equipment, construction, and installation. |
| CAPs (criteria air pollutants) | The six common pollutants for which the United States Environmental Protection Agency sets National Ambient Air Quality Standards (NAAQS). |
| CBAM (Carbon Border Adjustment Mechanism) | The European Union’s policy tool to price carbon emitted during production of certain carbon-intensive imported goods. |
| CCS (carbon capture and storage) | A process that separates carbon dioxide from industrial or power-sector emissions and stores it in deep underground geologic formations. |
| Clean Air Act | The primary United States federal law directing the Environmental Protection Agency to regulate air pollution from stationary and mobile sources. |
| CO (carbon monoxide) | A colorless, odorless gas produced by incomplete combustion and regulated as a criteria air pollutant. |
| CO2e (carbon dioxide equivalent) | The warming impact of a greenhouse gas or mixture of greenhouse gases expressed as the amount of carbon dioxide with the same global warming potential. |
| COBRA (Co-Benefits Risk Assessment Health Impacts Screening and Mapping Tool) | A tool that estimates how changes in air pollution affect human health and the economic value of those health effects. |
| Concessionary capital | Financing offered on more favorable terms than market-rate finance, such as below-market interest rates or longer repayment periods. |
| Demonstration project | A project that tests a technology, process, or business model at meaningful scale to validate performance, cost, and replicability. |
| Discount rate | Future costs or benefits converted into present value for economic analysis. |
| EIA | The US government agency that collects, analyzes, and disseminates independent energy data and information. |
| Ethylene oxide | A flammable gas used in chemical manufacturing and sterilization and regulated as a hazardous air pollutant. |
| EU ETS (European Union Emissions Trading System) | The European Union’s carbon market requiring covered emitters to pay for greenhouse gas emissions. |
| Feedstocks | The raw materials or input substances used as the starting point to synthesize or produce chemical products. These feedstocks can be derived from various sources, including fossil fuels (e.g., natural gas, crude oil, coal), biomass (e.g., agricultural residues, wood), and recycled materials. |
| Fixed opex (fixed operating expenditures) | Recurring operating costs that do not vary directly with production volume. |
| Flaring | A high-temperature combustion process used to burn waste gases containing combustible components such as methane, volatile organic compounds, carbon monoxide, or hydrogen. |
| FOAK (first-of-a-kind) | The first commercial or near-commercial deployment of a technology in a specific application or market. |
| GHGRP (Greenhouse Gas Reporting Program) | A program that requires large United States greenhouse gas sources, fuel and industrial gas suppliers, and carbon dioxide injection sites to report greenhouse gas data. |
| Global Energy Monitor Global Chemicals Inventory | A public dataset tracking facilities that produce major primary chemical products. |
| Global warming potential (GWP) | How much energy one ton of a greenhouse gas absorbs over a chosen time period relative to one ton of carbon dioxide. |
| Grid mix | The combination of energy resources used to generate electricity for a region or power system. |
| Grid stability | The ability of the electric system to remain balanced and reliable as electricity supply, demand, and disturbances change. |
| HAPs (hazardous air pollutants) | Toxic air pollutants regulated under the Clean Air Act because they may cause cancer or other serious health or environmental effects. |
| HyCO (hydrogen and carbon monoxide) plants | Plants that produce hydrogen, carbon monoxide, or syngas mixtures for industrial customers. |
| Hydrogen | A light chemical element and industrial gas commonly used as a fuel, feedstock, or process input. |
| IEA (International Energy Agency) | The intergovernmental organization that provides energy data, analysis, and policy advice. |
| Incidence | The number of new cases of a disease or health outcome that occur in a population during a specified period. |
| Industrial Revenue Bonds | Tax-exempt or taxable bonds used to finance eligible private industrial projects that promote business activity, employment, and local tax base expansion. |
| ITAC (Industrial Technical Assistance Center) | A center at Texas A&M that provides no-cost energy, productivity, and waste assessments for small and medium-sized manufacturers, supported by the United States Department of Energy. |
| Load shifting | Changing the timing of electricity use to reduce peak demand, lower costs, or better align demand with available generation. |
| Loan guarantee | A a commitment by a guarantor to repay all or part of a borrower’s principal and interest if the borrower fails to do so. |
| Low-emissions products | Goods made with lower greenhouse gas emissions than comparable conventional products when measured over a defined boundary. |
| MACC (marginal abatement cost curve) | A method that ranks emissions-reduction measures by the cost of reducing an additional unit of pollution. |
| Margin of yield | The estimated economic value or contribution margin associated with each unit of product output in a modeled process. |
| Methane intensity | Methane emissions divided by a measure of oil, gas, or fuel production or delivery. |
| Methanol | A volatile alcohol (CH3OH) used as a chemical feedstock, solvent, and fuel-related chemical. |
| MiQ (Methane Intelligence) | A nonprofit certification system that grades natural gas supply chain methane-emissions performance. |
| MMBtu (million British thermal units) | An energy unit equal to one million British thermal units. |
| Mobile source | A moving source of air pollution, such as a vehicle, engine, or piece of nonroad equipment. |
| NEI (National Emissions Inventory) | The Environmental Protection Agency’s comprehensive estimate of air emissions from criteria pollutants, criteria precursors, and hazardous air pollutants. |
| NETL (National Energy Technology Laboratory) | A United States Department of Energy national laboratory focused on energy and carbon management research and analysis. |
| NOx (nitrogen oxides) | Air pollutants formed during combustion that contribute to ozone and particulate matter formation. |
| Oil Climate Index plus Gas (OCI+) | A public web tool that estimates oil and gas methane and total emissions intensities. See: https://ociplus.rmi.org/ |
| O3 (ozone) | A gas that at ground level is a criteria air pollutant formed from chemical reactions involving nitrogen oxides and volatile organic compounds in sunlight. |
| Olefins | Acyclic or cyclic hydrocarbons with one or more carbon-carbon double bonds, including ethylene and propylene. |
| Opex (operating expenditures) | Ongoing costs required to operate and maintain a project or facility. |
| PM2.5 (fine particulate matter) | Airborne particle pollution with diameters of 2.5 micrometers or smaller. |
| Primary chemical | A chemical substance that is produced at large scale as a foundational material in the chemical industry. These chemicals serve as building blocks for the synthesis of more complex chemicals, materials, or products. |
| PUCT (Public Utility Commission of Texas) | The agency that regulates electric, telecommunications, water, and sewer utilities and implements related state legislation. |
| Scope 1 emissions | Direct greenhouse gas emissions from sources owned or controlled by an organization. |
| Scope 2 emissions | Indirect greenhouse gas emissions from purchased electricity, steam, heat, or cooling. |
| Scope 3 emissions | Indirect value-chain greenhouse gas emissions outside an organization’s Scope 1 and Scope 2 boundaries. |
| SECO (State Energy Conservation Office) | A Texas Comptroller program that helps public entities reduce utility costs and improve energy efficiency. |
| Short-term exposure / long-term exposure | Contact with a pollutant over a brief period / repeated or continuous contact over an extended period. |
| SIP (State Implementation Plan) | A state plan submitted to the Environmental Protection Agency showing how the state will attain, maintain, or enforce federal air quality standards. |
| SMR (steam methane reformer) | A device or system that produces hydrogen by reacting methane with steam, typically producing carbon dioxide as a byproduct. |
| SO2 (sulfur dioxide) | A gaseous air pollutant produced largely from sulfur-containing fuel combustion and industrial processes. |
| Stationary source / stationary industrial facility | A fixed building, structure, installation, or facility that emits or may emit regulated air pollutants. |
| Steam cracking | A high-temperature petrochemical process that breaks hydrocarbons into smaller molecules such as ethylene and propylene. |
| Supply chain emissions | Greenhouse gas emissions associated with producing, transporting, using, or disposing of goods and services across the value chain. |
| TCEQ (Texas Commission on Environmental Quality) | Texas’s environmental regulatory agency for air, water, waste, and related environmental programs. |
| TERP (Texas Emissions Reduction Plan) | A Texas Commission on Environmental Quality incentive program that funds projects reducing emissions, especially nitrogen oxides. |
| TES (thermal energy storage) | A system that stores heat or cold for later use in buildings, power systems, or industrial processes. |
| Texas Energy Fund | A state fund administered by the Public Utility Commission of Texas to provide grants and loans for electric facilities in Texas. |
| TIEEN/TIEEP (Texas Industrial Energy Efficiency Network / Texas Industrial Energy Efficiency Program) | Programs at the University of Houston that provide education, awareness, and assistance to help refineries and chemical processors improve energy efficiency. |
| Variable opex (variable operating expenditures) | Operating costs that change with production, throughput, or utilization. |
| VOCs (volatile organic compounds) | Carbon-containing chemicals that readily evaporate and can contribute to ground-level ozone formation. |
Appendix B: Facility list
The following is a list of primary chemical facilities included in the analysis based on data from EPA’s Greenhouse Gas Reporting Program, EPA’s National Emissions Inventory, Global Energy Monitor’s Global Chemicals Inventory, and Environmental Integrity Project’s Oil and Gas Watch. Alhough most facilities produce multiple chemicals, each facility was designated as a single primary chemical facility type based on production volumes and company descriptions.
| Facility | Main primary chemical product | City | County |
|---|---|---|---|
| Nutrien Borger Nitrogen Facility | Ammonia | Borger | Hutchinson |
| Yara Freeport Ammonia Facility | Ammonia | Freeport | Brazoria |
| ExxonMobil Baytown Refinery | Aromatics | Baytown | Harris |
| ExxonMobil Beaumont Refinery | Aromatics | Beaumont | Jefferson |
| INEOS Aromatics Texas City | Aromatics | Texas City | Galveston |
| Motiva Port Arthur Refinery | Aromatics | Port Arthur | Jefferson |
| Nalco Fresno Facility | Aromatics | Fresno | Fort Bend |
| TotalEnergies Port Arthur Refinery | Aromatics | Port Arthur | Jefferson |
| Air Liquide Corpus Christi SMR | Hydrogen | Corpus Christi | Nueces |
| Air Liquide Freeport HyCO Plant | Hydrogen | Freeport | Brazoria |
| Air Liquide hydrogen facility – Gregg County | Hydrogen | Longview | Gregg |
| Air Liquide Large Industries US SMR – Harris County | Hydrogen | Pasadena | Harris |
| Air Products Baytown 3 Facility | Hydrogen | Baytown | Harris |
| Air Products Cedar Bayou Hydrogen Plant | Hydrogen | Cedar Bayou | Harris |
| Air Products Corpus Christi hydrogen facility | Hydrogen | Corpus Christi | Nueces |
| Air Products Pasadena SMR | Hydrogen | Pasadena | Harris |
| Air Products Port Arthur hydrogen facility | Hydrogen | Port Arthur | Jefferson |
| La Porte Steam Methane Reformer | Hydrogen | La Porte | Harris |
| Linde Clear Lake HyCO Plant | Hydrogen | Pasadena | Harris |
| Linde Facility 0379 | Hydrogen | Port Arthur | Jefferson |
| Linde Facility 0497 | Hydrogen | Port Arthur | Jefferson |
| Linde Sweeny Hydrogen Plant | Hydrogen | Sweeny | Brazoria |
| Linde Texas City Hydrogen Complex | Hydrogen | Texas City | Galveston |
| Celanese / Fairway Methanol Clear Lake | Methanol | Pasadena | Harris |
| Methanex Beaumont / former OCI Methanol | Methanol | Beaumont | Jefferson |
| Natgasoline Beaumont Methanol Plant | Methanol | Beaumont | Jefferson |
| BASF / TotalEnergies Port Arthur olefins facility | Olefins | Port Arthur | Jefferson |
| Baystar Port Arthur Ethane Cracker | Olefins | Port Arthur | Jefferson |
| Chevron Phillips Chemical – Brazoria County site | Olefins | Sweeny | Brazoria |
| Chevron Phillips Chemical – Harris County site | Olefins | Cedar Bayou | Harris |
| Chevron Phillips Chemical – Jefferson County site | Olefins | Port Arthur | Jefferson |
| Dow Freeport / Brazoria County complex | Olefins | Freeport | Brazoria |
| Dow Orange County site | Olefins | Orange | Orange |
| Eastman Longview / Harrison County site | Olefins | Longview | Harrison |
| Enterprise Mont Belvieu Complex | Olefins | Mont Belvieu | Chambers |
| Equistar / LyondellBasell La Porte Complex | Olefins | Pasadena | Harris |
| ExxonMobil Baytown Olefins Plant | Olefins | Baytown | Harris |
| ExxonMobil Beaumont Chemical / olefins site | Olefins | Beaumont | Jefferson |
| Formosa Plastics Point Comfort Complex | Olefins | Point Comfort | Calhoun |
| Gulf Coast Growth Ventures Gregory Complex | Olefins | Portland | San Patricio |
| Huntsman Conroe Facility | Olefins | Conroe | Montgomery |
| Indorama Ventures Port Neches Operations | Olefins | Port Neches | Jefferson |
| INEOS Olefins & Polymers – Brazoria County | Olefins | Chocolate Bayou | Brazoria |
| INV Propylene Houston Chemical Facility | Olefins | Houston | Harris |
| LyondellBasell Channelview Complex | Olefins | Channelview | Harris |
| LyondellBasell Corpus Christi / Nueces County site | Olefins | Corpus Christi | Nueces |
| Motiva Port Arthur Manufacturing Complex | Olefins | Port Arthur | Jefferson |
| OxyChem / Mexichem San Patricio site | Olefins | Ingelside | San Patricio |
| Sabine River Operations | Olefins | Orange | Orange |
| Shell Chemicals Harris County site | Olefins | Deer Park | Harris |
| TPC Group Houston Operations | Olefins | Houston | Harris |
| Union Carbide / Dow Seadrift Operations | Olefins | Seadrift | Calhoun |
| Main product type | # of TX facilities |
|---|---|
| Hydrogen | 15 |
| Methanol | 3 |
| Ammonia | 2 |
| Olefins | 26 |
| Aromatics | 6 |
| Total | 52 |
Methodology and Assumptions
Endnotes
- ITAC would likely have to expand its scope to larger facilities because its current scope is on facilities too small to realize large benefits from industrial efficiency. ↩
- Texas state sales/use tax rate is 6.25%. Local jurisdiction sales tax adds up to an additional 2%. Local property tax of 2% is assessed annually, impacted by depreciation. ↩
Authors

Ankur Dass
Senior Associate
Drew Veysey
Senior Associate
Emily Albergo
Associate
Lindsay Asmussen
Rotational Associate
Allie Jobe
Associate
Catherine Huyett
Manager
Hannah Thonet
Manager
Brianne Cangelose
PrincipalRelated Insights
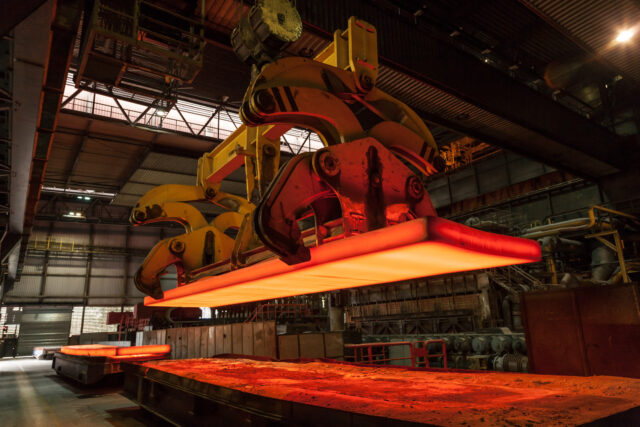

How Better Policy Can Support South Korea’s Green Steel Opportunity
Help build the clean energy future. Donate today.
Independent research. Real-world solutions. Supported by donors.
RMI can pursue the highest-impact climate and energy solutions because we’re supported by people who believe change is possible. Every gift helps advance the work needed to make clean energy the default choice worldwide.
For other ways to give to RMI, including checks or gifts of stock, please visit Other Ways to Give.