Learn how we are working to transform how we use and produce energy.

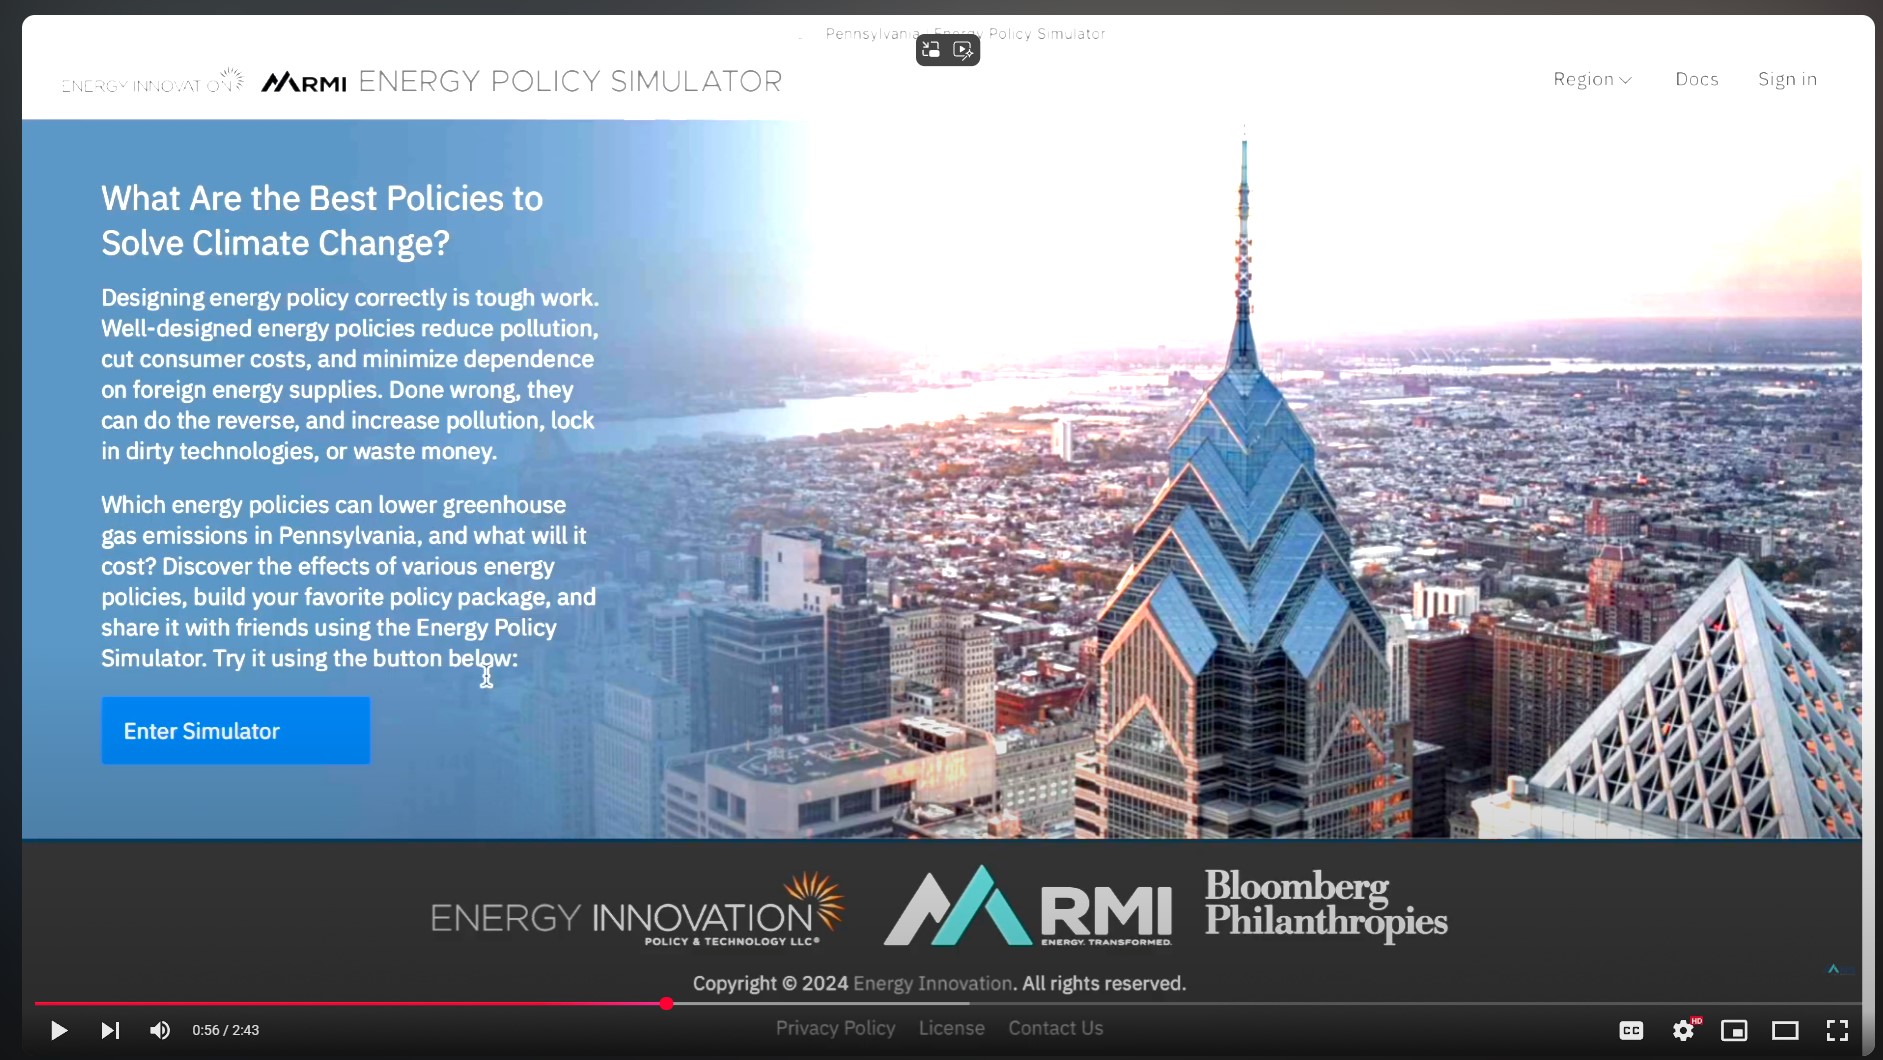
Energy Policy Simulator
The Energy Policy Simulator (EPS) is an open-source model for estimating the environmental, economic, and human health impacts of hundreds of energy policies. EPS offers unparalleled accessibility to the model through an easy-to-use web interface that allows non-technical users to model their own policy scenarios.
Supported by Bloomberg Philanthropies and in partnership with Energy Innovation, RMI has developed state-level versions of the EPS to make robust modeling tools and insights freely available to a diverse group of stakeholders including advocates, policymakers, and researchers.
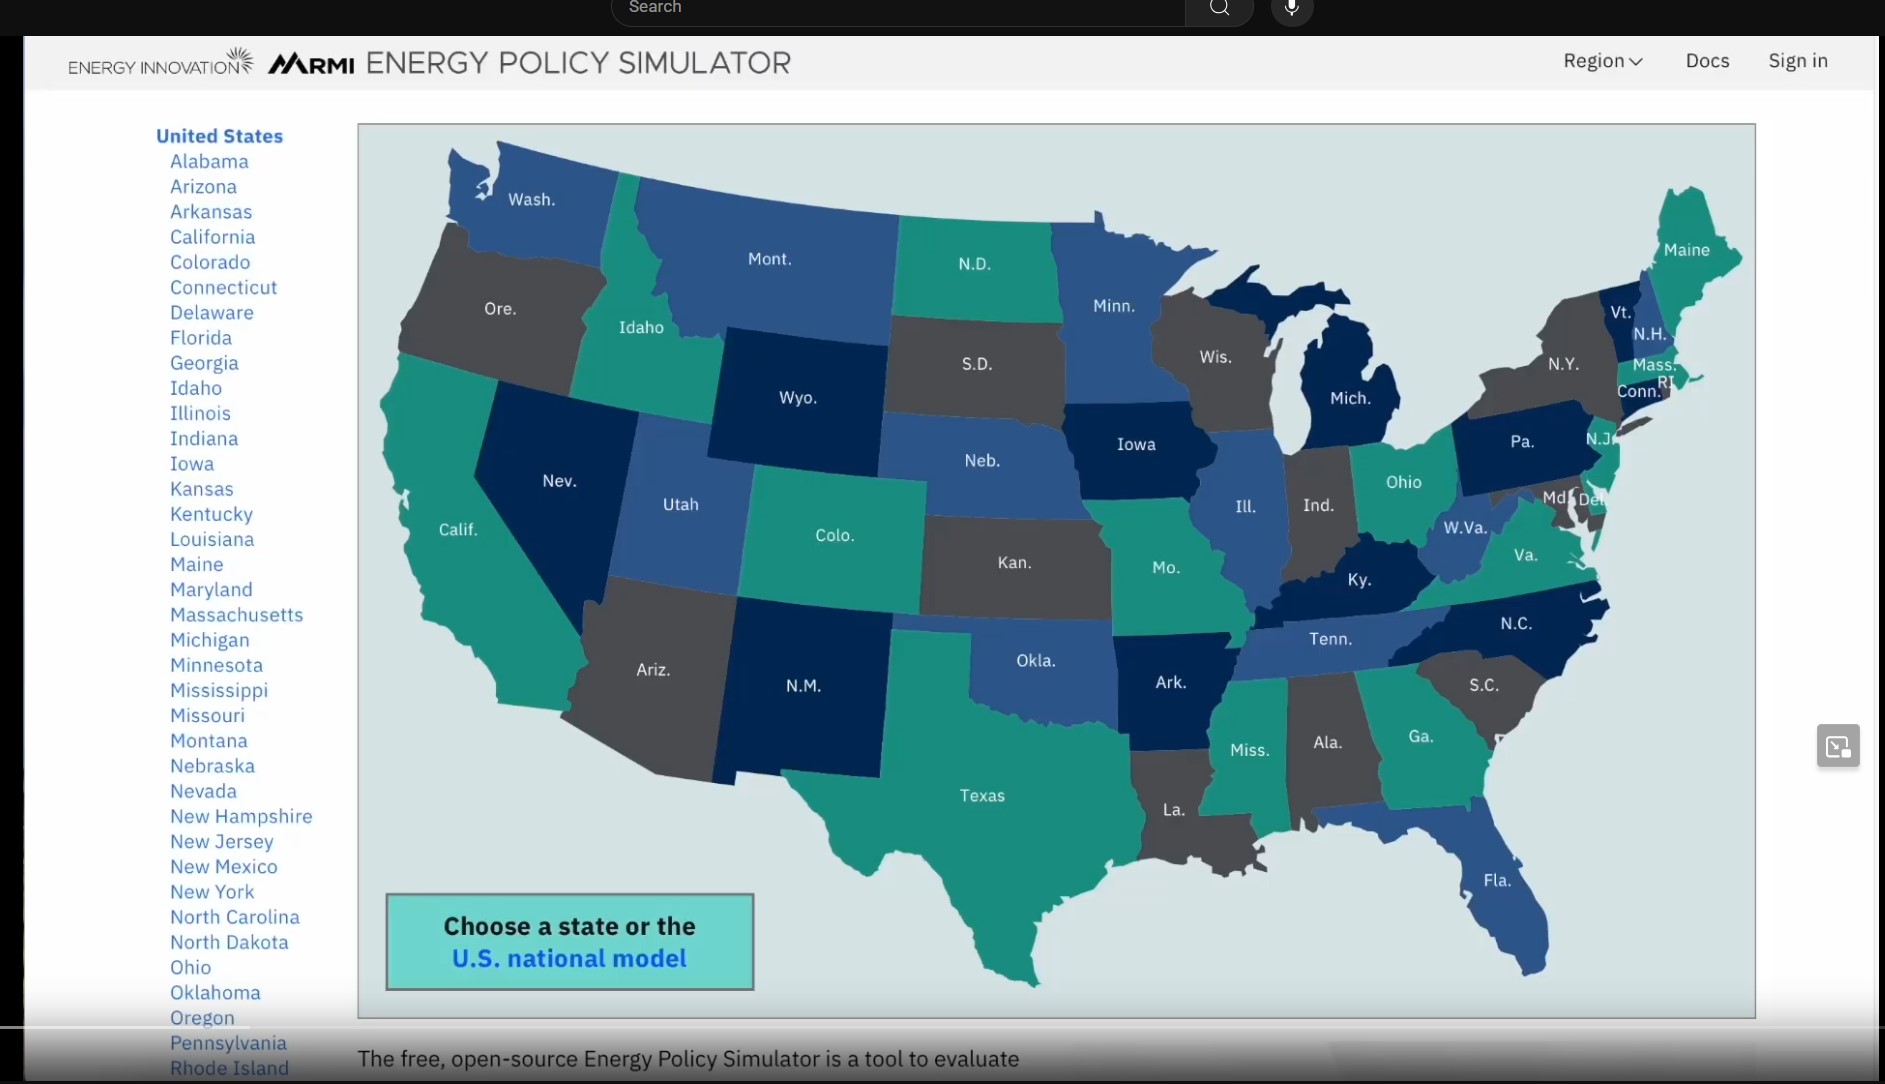
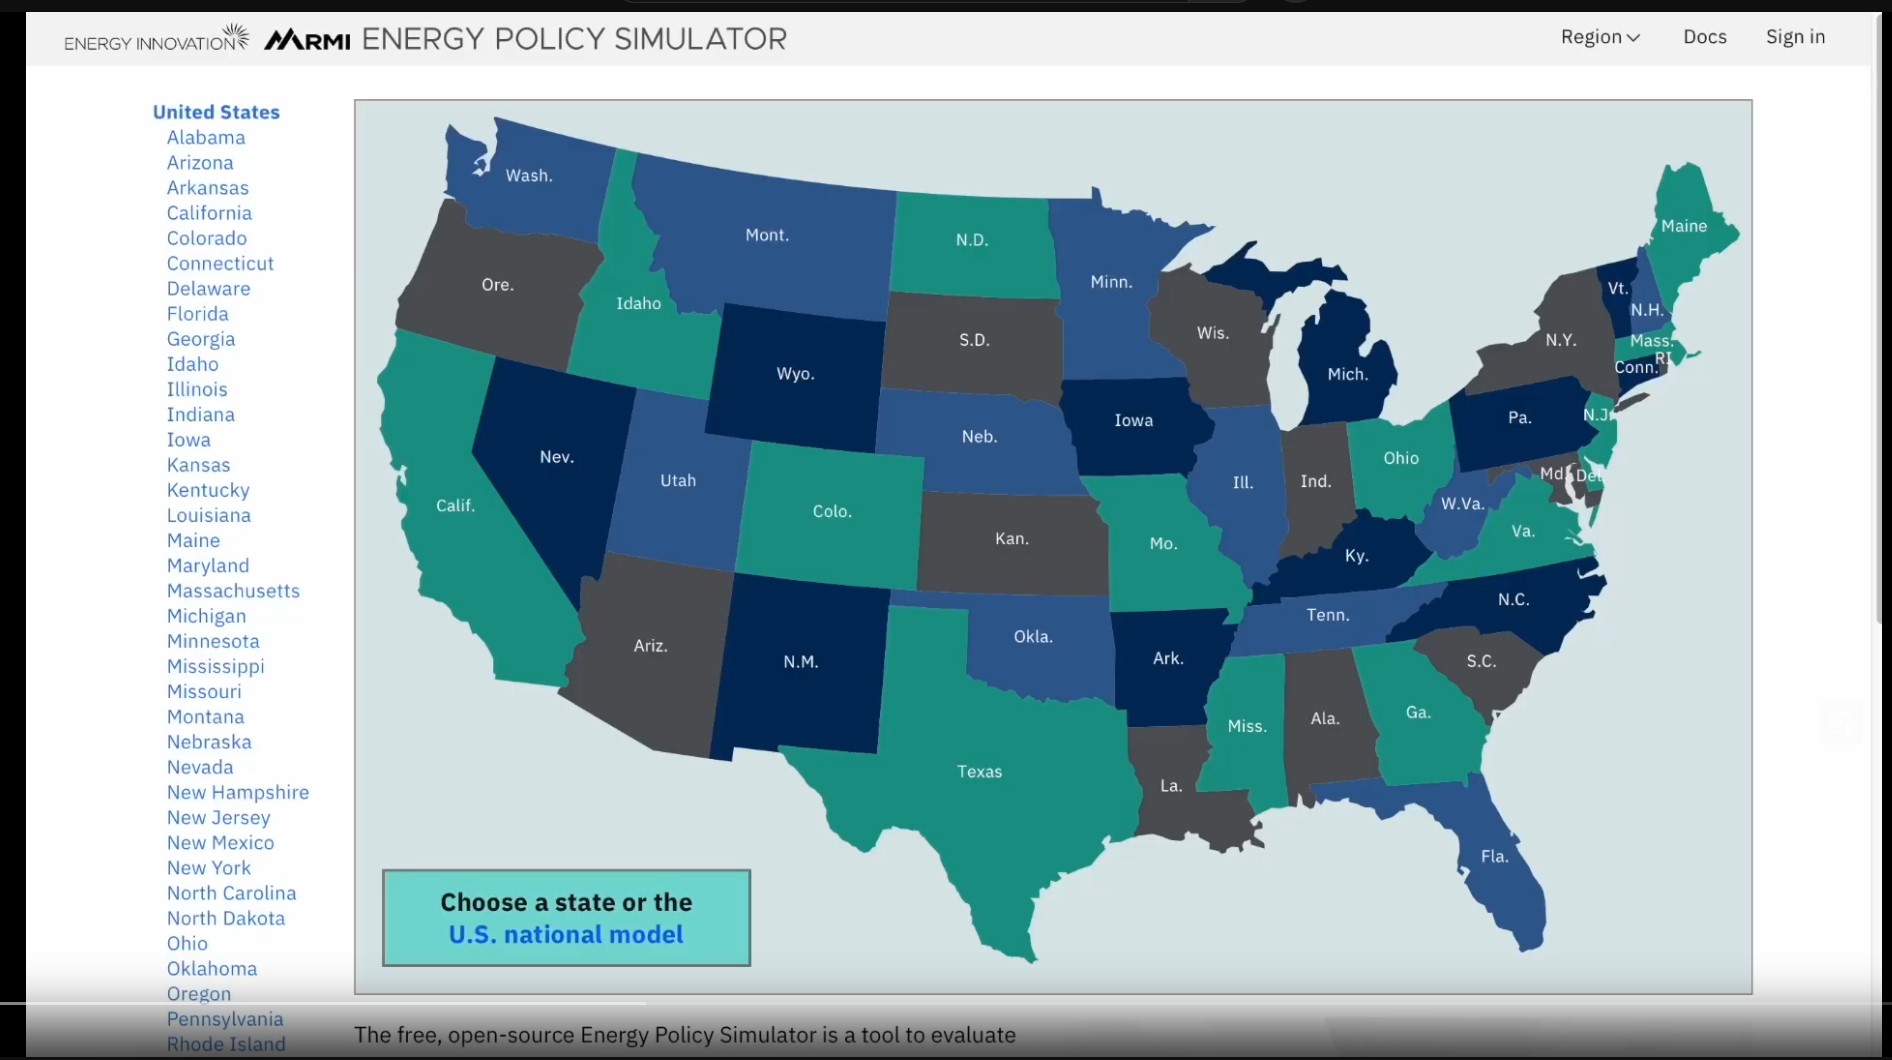
RMI and Energy Innovation have developed EPS models for the 48 states in the continental United States and are available to the public. Use the map below to explore policy solutions using the EPS in your state.
Click on any state in dark green below to view the simulator.
California, Oregon, and Texas are being developed and maintained by Energy Innovation and other partners. All other states are co-developed by Energy Innovation and RMI.
Why It Matters
State-level policy is critical to driving emissions reductions, but stakeholders often lack access to the analytical resources to quickly evaluate the impact of broad policy packages. The EPS empowers practitioners to interactively design policy scenarios that correspond to each state’s unique context, and delivers robust, granular sector and sub-sector insights in a user-friendly interface.
The EPS also supplies key insights on co-benefits to support advocates and policymakers in making the case for ambitious climate policy action. RMI is committed to support those working on state policy with interactive and comprehensive modeling to provide clarity about the impact of policy options.


More about the EPS
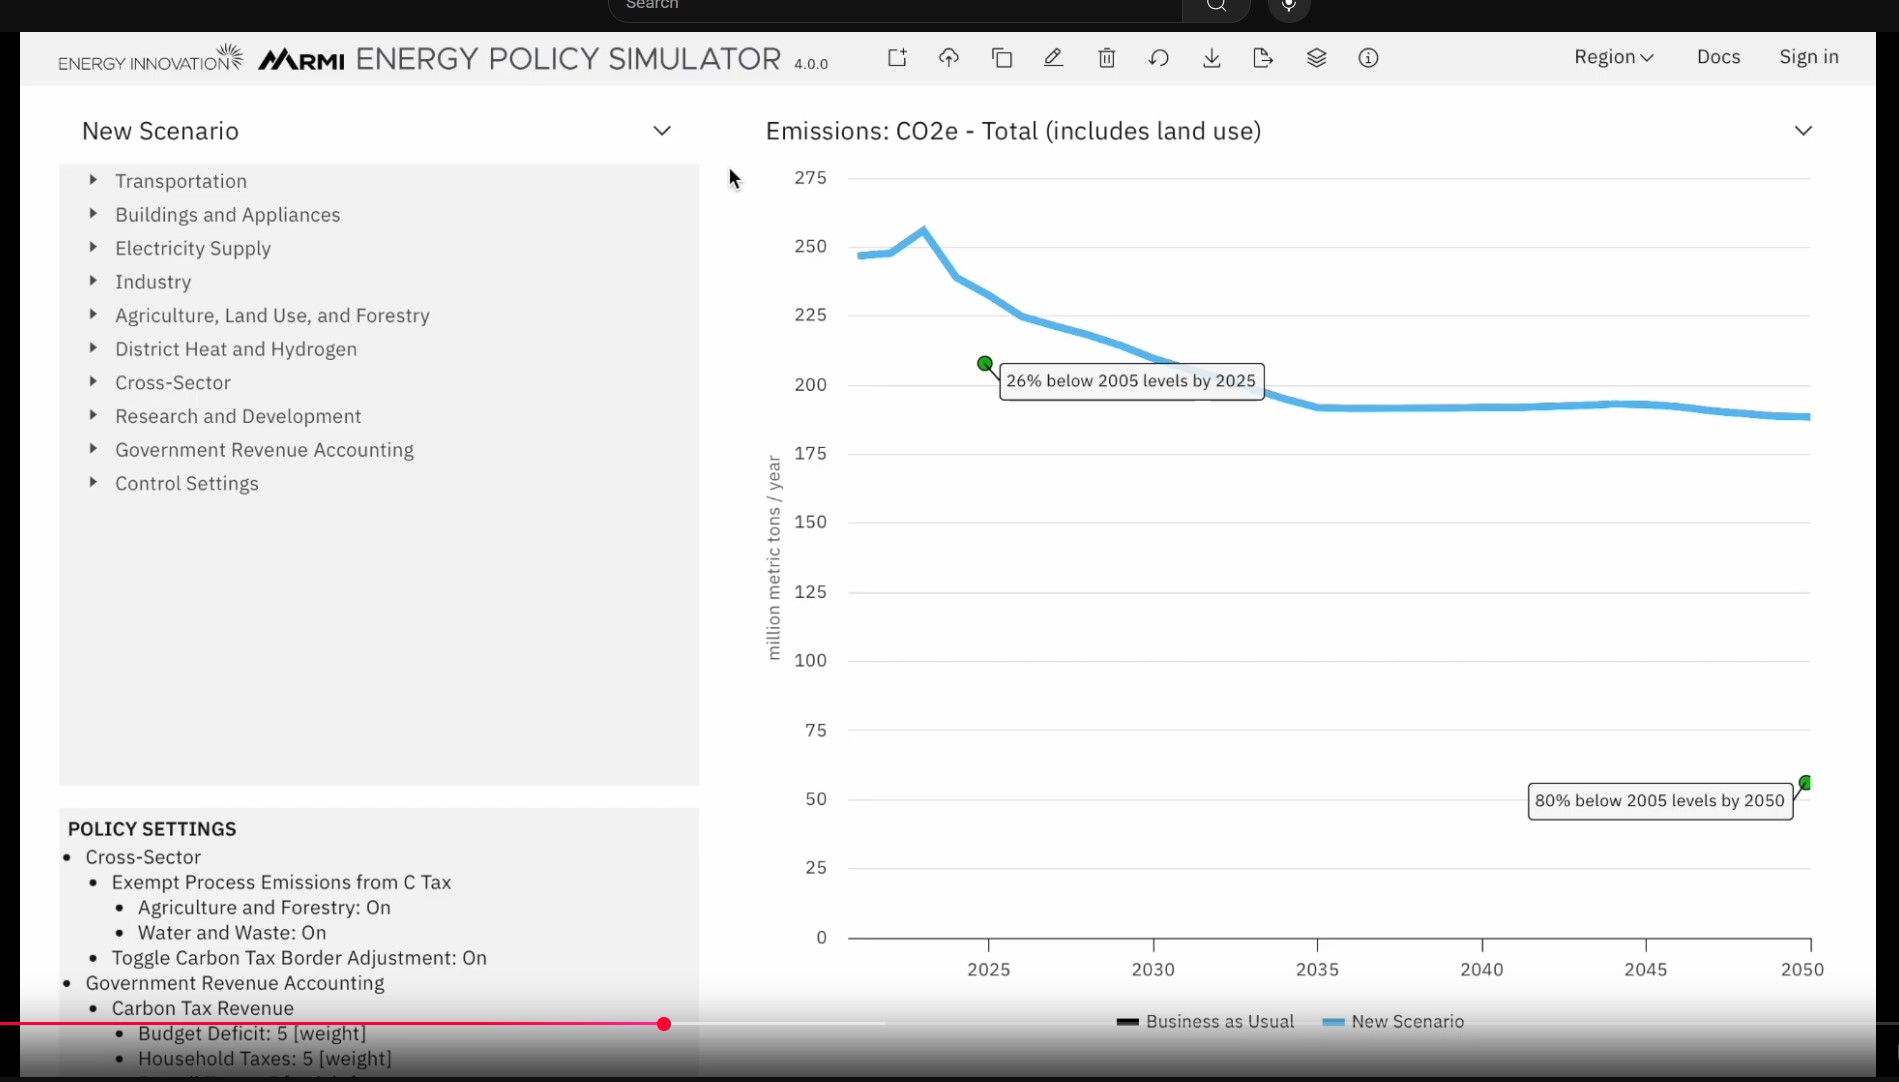
The EPS allows the user to control a large variety of policies that affect energy use and emissions in every major sector of the economy including transportation, electricity supply, buildings, industry, agriculture, and land use. It also includes various smaller components, such as hydrogen supply, district heat, waste management, and geoengineering. The model reports outputs at annual intervals and provides numerous outputs, including:
- Emissions of 12 different pollutants (CO2, nitrogen oxides [NOx], sulfur oxides [SOx], fine particulate matter [PM2.5], and eight others), as well as carbon dioxide equivalent (CO2e, a measure of the global warming potential of various pollutants)
- Direct cash flow (cost or savings) impacts on government, non-energy industries, labor and consumers, and five energy-supplying industries
- Impacts on jobs, GDP, and employee compensation, as a whole or disaggregated into 36 economic categories
- Premature mortality (deaths) and 10 other health-related outcomes avoided thanks to reduced primary and secondary particulate pollution
- The composition and output of the electricity sector (e.g., capacity and generation from coal, natural gas, wind, solar, etc.)
- Vehicle technology market shares and fleet composition (electric vehicles, etc.)
- Energy use by fuel type from various energy-using technologies (specific types of vehicles, building components, etc.)
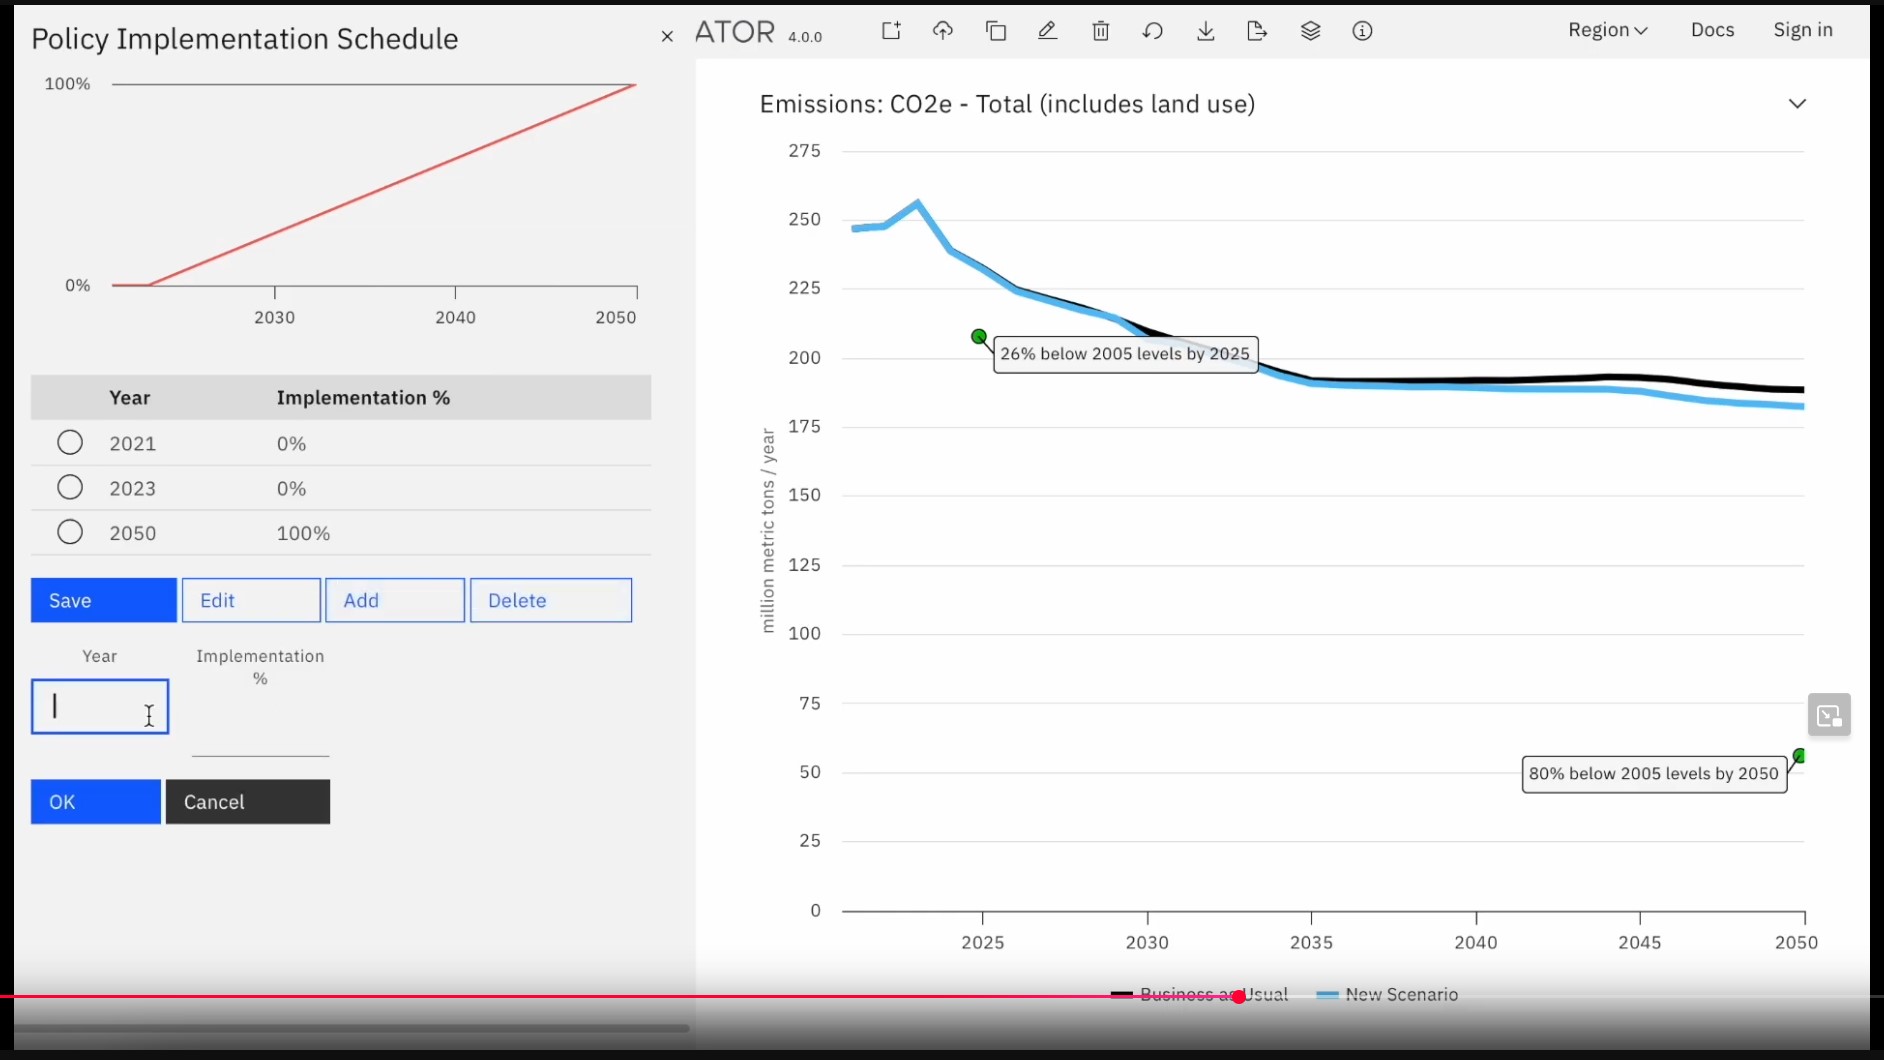
- Breakdowns of how each policy within a policy package contributes to total abatement and the cost-effectiveness of each policy (e.g., wedge diagrams and cost curves)
- Fuel imports and exports, and associated expenditures or revenues
The most recent updates to the EPS include:
- Inclusion of major federal and state policies to the business-as-usual scenario
- A reference scenario that repeals and rollbacks major federal policies
- An expanded list of policy measures that can be selected for custom scenarios, including sectoral subsidies
In addition to the state-level EPS models mentioned above, Energy Innovation has published the Energy Policy Simulator for several countries including the United States, China, and India. Additional guidance on modeling the repeal and rollback of policies can be found here. Additional guidance on modeling the repeal and rollback of policies can be found here.
Questions about the Energy Policy Simulator for states? We would love to hear from you. Reach out to our team at USAnalysis@rmi.org.

Help build the clean energy future. Donate today.
Independent research. Real-world solutions. Supported by donors.
RMI can pursue the highest-impact climate and energy solutions because we’re supported by people who believe change is possible. Every gift helps advance the work needed to make clean energy the default choice worldwide.
For other ways to give to RMI, including checks or gifts of stock, please visit Other Ways to Give.
