Learn how we are working to transform how we use and produce energy.
Accelerating Industrial Clean Heat
with a Production Tax Credit
How policymakers can design an industrial clean heat production tax credit to reduce costs and spur deployment of clean heat technologies
Why we share this work for free
RMI is an independent nonprofit working to accelerate the clean energy transition. We publish research like this to inform decision-makers and drive real-world impact.
Our work is supported by philanthropy as well as partnerships, including fee-for-service engagements. This support makes it possible for us to share our independent insights for free.
If you find this work valuable, you can support it anytime.
Get more insights like this
Stay up to date with the latest research, analysis, and tools from RMI by opting in to receive occasional emails below. You’ll get new reports, event invitations, and practical insights to help us all accelerate the clean energy transition.
Loading form...
Your download should start automatically. If it doesn’t, click the download button below.
This work is made possible by philanthropy
RMI is a nonprofit supported by donors and partners. Philanthropy enables us to produce independent research and make resources like this freely available.
If you find this report valuable, please consider supporting our work. You can also explore how we partner with organizations to drive impact.
Contents
Executive Summary
Industrial clean heat provides the heat for an industrial facility using technologies like electricity, renewable energy, thermal energy storage, geothermal energy, or clean fuels. This reduces overall energy use, improves air quality (especially around fenceline communities), hedges against price spikes, increases global competitiveness, and reduces greenhouse gas emissions. Additionally, states that take an active role creating a market for new technologies like industrial clean heat will be best positioned to capture economic benefits from industrial transition.
Clean heat technologies are mature but are not being adopted at scale due to market barriers, including cost disparities between using electricity and natural gas for heating. State policies such as a clean heat production tax credit (PTC) can reduce costs and spur deployment of clean heat technologies. A clean heat PTC works by awarding a tax credit for each unit of eligible clean heat delivered, lowering operating costs as facilities switch from fossil fuel heating to cleaner heating technologies.
We assessed the design, costs, and impact of a state-level PTC to provide guidance to states on how to achieve cost parity when switching from incumbent heating technologies. Key takeaways included:
- The modeled average credit value needed to reach cost parity between clean heat technologies and incumbent gas boilers is $13.57 per million Btu (MMBtu) in the baseline scenario, which assumed medium gas price and medium electricity price trajectories. This average credit value is roughly 3 times the 2025 US average natural gas price; for context, this is similar to the full $3/kg 45V hydrogen PTC, which is ~2.5 times the estimated cost of hydrogen from fossil fuels (grey hydrogen).
- The required credit values vary widely by state because of differences in the “spark gap,” or the relative cost of electricity compared with natural gas. In the baseline scenario, modeled parity values range from $3.80/MMBtu in Washington to $43.05/MMBtu in Alaska (see Exhibit ES1).
Exhibit 1
- Higher gas prices have a larger effect on improving clean heat economics than lower electricity prices. A scenario using a high gas price and medium electricity price reduces the average required PTC value by 42% relative to the baseline, while a scenario using a medium gas price and low electricity price reduces the required PTC value by 10%.
- Modeled state costs (measured in foregone revenue) vary substantially depending on the size of each state’s industrial sector. These costs range from roughly $1 billion to $170 billion cumulatively by 2045, assuming uncapped tax credits and therefore maximum technically feasible participation. The average marginal cost of abatement by 2045 is $150 per ton of CO2e abated, well below the 2022 US estimated social cost of carbon at $190/ton.1
- Clean heat PTCs can meaningfully reduce annual industrial greenhouse gas emissions by 29% and achieve $27–$49 billion in annual health benefits from reduced criteria air pollutants. By 2035, clean heat PTCs can reduce annual Scope 1 greenhouse gas emissions by 273 million tons. In addition, adopting clean heat technologies can result in significant reductions in harmful criteria air pollutants (CAPs) like nitrogen oxide, sulfur dioxide, carbon monoxide, volatile organic compounds, and particulate matter.
However, state incentives need to be fiscally prudent and well designed. While we think there is significant upside to a clean heat PTC, we adopted a conservative approach to modeling assumptions. Specifically, the model uses long-term energy price trajectories and does not account for short-term price spikes or volatility. For this reason, the modeled PTC values show cost parity under smoothed price assumptions, not the full resilience value clean heat may provide during fuel price shocks. Both gas and electricity prices can spike, but gas prices are particularly volatile because natural gas is traded in global commodity markets. Industrial electrification is thus a strategy to hedge against those risks.
We also explored design considerations that policymakers can consider when designing PTC policies including how to structure the credit, what value is appropriate to offer, and what clean heat activities could be eligible to earn a credit.
Exhibit 2
| PTC Design Considerations | |
|---|---|
| Credit structure | Refundable: A refundable credit is more valuable and accessible to smaller firms. Adaptable: A credit that changes to reflect market conditions will provide the appropriate level of support to firms, without over-subsidizing technologies. Bankable: States can improve credit value to private lenders and help crowd-in private capital by insulating the credit from policy swings. Timebound: A credit that is timebound and offered for a fixed number of years starting when facilities install qualifying equipment will align best with facility investment cycles while only offering support as the clean heat market matures. |
| Credit value | Value: Appropriate credit value varies by state and depends on the spark gap. Budget: Defining an annual budget will be key for many states, and therefore designing qualification criteria is key to capturing highest-value projects. |
| Credit eligibility | Industrial: To ensure offtakers can benefit from the credit, the credit can be structured so that both manufacturers and third-party industrial heat providers can claim it. Low-emitting: Eligible activities to receive credit will depend on state goals, and can be determined by technology type or emissions intensity limits. Additional: To avoid subsidizing normal business practices, the credit could be structured to only reward clean heat above a facility’s clean heat share baseline. Verifiable: Verification can ensure productive use of taxpayer dollars, while balancing the cost of administrative burden. |
Introduction
Industrial heat is needed to manufacture everyday products that people rely on — from food and medicine to steel and cement. Traditionally, industrial heat has been provided from fossil fuels like natural gas, oil, and coal. But new technologies can provide the same industrial heating benefits, more efficiently, and with fewer air and climate pollutants. Using “clean heat” can also protect against price shocks from turbulent global energy markets and supports global competitiveness for manufacturers who export their goods internationally, particularly to European markets with a carbon border adjustment mechanism.
Industrial heat is responsible for about 9% of all US greenhouse gas emissions, making clean heat technologies a near-term, high-impact opportunity for industrial decarbonization. This is particularly true for facilities that operate predominantly at low to medium temperature ranges (below 400°C), such as food and beverage, pulp and paper, consumer goods, and some chemical manufacturing.
Industrial heating technologies like industrial heat pumps, e-boilers, thermal batteries, and solar thermal are technologically mature and readily deployable. Other technologies such as enhanced and advanced geothermal are still maturing technologically and can also benefit from early offtake support from large industrial customers. However, these technologies are not being adopted at scale because of increased operating costs driven by the higher cost of using electricity instead of natural gas for heating processes. This is often called the “spark gap.”
Coordinated action and state support are needed to reduce costs and accelerate deployment, ultimately spurring these nascent markets to scale. States that take an active role in creating a market for new technologies will be best positioned to capture economic benefits from industrial transition. Recent analysis suggests a growing industrial electrification market could support $471 billion in economic growth, including $252.3 billion in deployment-related growth and $257.6 billion in manufacturing-related growth. In some cases, places that support the deployment of these technologies by providing incentives like a PTC may also have an edge in attracting the manufacturing of these technologies.
A well-designed tax credit program can kickstart deployment of clean heat technologies that improve industrial efficiency, reduce energy use, and emit fewer pollutants, but are currently uneconomic due to the spark gap. A clean heat production tax credit (PTC) is one option states could consider to improve early market conditions for local firms seeking to modernize their facilities.
Policy Overview
A clean heat PTC addresses the cost differential of electricity and natural gas by providing a “clean heat credit” for every unit (MMBtu) of industrial heat delivered by clean heating technology. By subsidizing operating costs, a PTC improves the business case by de-risking the investment for facilities to modernize their heating equipment and helps states lower greenhouse gas emissions and criteria air pollutants from their industrial sector. A clean heat PTC can catalyze first movers and accelerate clean heat market maturity.
This policy can be used as a stand-alone incentive or stacked with other complementary policies, such as electricity rate reform for manufacturers using electrified heat, up-front grants for capital expenditures, or regulatory mechanisms like a clean heat standard or facility emissions reduction mandates.
While a clean heat PTC could also support adoption in residential and commercial sectors, here we focus on a PTC for clean industrial heat. Industry requires higher temperature and higher-powered heat than commercial and residential customers, making industrial heat supply harder to decarbonize. This policy can be considered best suited for lower temperature industries where the cost gap is smaller and the state can provide meaningful operational cost support, as in most industries operating below 400°C.2
For industrial facilities facing higher energy costs when switching from fossil fuels to clean technologies, a PTC can help close the cost gap during the early stages of deployment. Because the credit is time-limited, it serves as a temporary boon to competitiveness, supporting technologies until they achieve sufficient scale and cost reductions to compete without additional state support.
Key Takeaways
To assess the potential design, cost, and impact of a clean heat PTC, RMI developed a state-level model of industrial clean heat adoption from 2026 through 2045, for technology installed by 2035. The model provides directional guidance on the credit value needed to help manufacturers maintain cost competitiveness while switching from incumbent fossil fuel heating technologies to clean heating technologies, as well as policy benefits and costs to states in foregone tax revenue. Because the central policy question is whether clean heat can deliver the same useful heat without increasing a manufacturer’s cost of heat, the model compares technologies using levelized cost of heat (LCOH). Key findings include the following:
Clean heat PTC value varies widely and is impacted by gas and electricity costs, as well as complementary policies.
Across the United States, the clean heat PTC value to reach LCOH parity (with no other policy intervention) was modeled at an average rate of $13.57/MMBtu and the median state price was $12.09/MMBtu.
States with larger spark gaps, or high cost of electricity compared to natural gas, see higher PTC values to reach LCOH parity between electrified and gas-powered technology (see Exhibit 1). In the baseline medium gas, medium electricity price scenario, within the continental United States, Rhode Island has the highest cost to reach parity at $31.77/MMBtu, and Washington State has the lowest at $3.80/MMBtu. The model derives state price trajectories from EIA’s Annual Energy Outlook 2026 industrial energy price projections and EIA State Energy Data System price data, as described in the Appendix. Thirty states representing $1.76 trillion in manufacturing value and 76% of US industrial emissions see PTC values below the $13.57/MMBtu average PTC rate. The PTC values modeled in Hawaii and Alaska were substantially higher, rising above $40/MMBtu.
Exhibit 3
In addition, modeling shows that stacking a clean heat PTC with an up-front grant for capital costs reduces the average required credit value by 4.7%, suggesting that complementary capital support can improve project economics but does not eliminate the need for operating-cost support.
Further, modeling indicates that the economics of clean heat adoption improve more in a high gas price scenario as compared to a low electricity price scenario, as shown in Exhibit 2. Specifically, a scenario assuming high gas prices and medium electricity prices reduces credit value substantially, averaging a 42% reduction in credit value compared to the baseline medium gas, medium electricity scenario, whereas a scenario that models medium gas prices with low electricity prices averages a 10% PTC reduction compared to the baseline.
Exhibit 4
This difference is driven by the increased efficiency of clean heating technologies compared to gas equipment — a $1/MMBtu increase in gas price increases gas boiler operational costs more than a $1/MMBtu lower electricity price decreases clean heat technology operational cost. In the modeled scenarios this electricity to gas fuel ratio is 1:1.7, assuming 70% of clean heat is supplied by heat pumps with coefficients of performance of 2.5.
The impact of tax credits as foregone state revenue varies in accordance with states’ industrial profiles.
Modeled state costs (measured in foregone revenue) vary substantially depending on the size of each state’s industrial sector, ranging from roughly $1 billion to $170 billion cumulatively by 2045. This assumes uncapped tax credits and therefore maximum technically feasible participation for technology installed by 2035, without restraint for state budgets.
In addition, because clean heating technologies are assumed to have a 20-year lifespan, the model found cost parity with gas equipment throughout the full 20-year financial life, even though the credit only lasts 10 years. This essentially generously provides 20 years of value within the 10-year period a facility can claim the credit and functionally over-subsidizes facilities in the early years to account for increased operating costs in the latter years.
Without an annual budget cap, the cumulative cost to states by 2045 heavily depends on the size of industry in the state, as the model presumes that fossil fuel-fired heating equipment in each state will transition to clean technologies on a schedule consistent with a standard stock rollover timeline until 2035 when PTC eligibility for technology installation is modeled to end. Texas, California, and Louisiana therefore see the highest spends, consistent with the size of their respective industrial bases. The total US spend, 2026 through 2045, exceeds $650 billion in the medium gas and medium electricity price scenarios.
These foregone revenue estimates should be read as a fiscal cost analysis, not a full economic development analysis. The model does not quantify potential additional benefits or risks such as exposure to energy price volatility, productivity or enabled performance improvements from modernized equipment, attraction of industrial electrification supply chains, energy security impacts, or other local economic effects.
Exhibit 5
Maintaining the assumption of an uncapped tax credit, the average marginal cost of abatement by 2045 is $150/ton, and ranges from $47.40/ton in Washington to $486/ton in Alaska. In 39 states, the cost of abatement is below $190/ton, the 2022 US estimated social cost of carbon (Exhibit 4).
Exhibit 6
As seen in Exhibit 5, industry sees net savings throughout the lifespan of the PTC credit. Tax credit uptake peaks in 2038 and eventually declines as the PTC expires. Notably, the model conservatively doesn’t assume any change to markets or rate reform in the later years, thus reflecting the slow return of increased costs. However, a PTC would best be considered as part of a strategy of policy and market changes to spur market reforms, thereby giving manufacturers a temporary boost to accelerate their transition to clean technologies while the market adapts.
Exhibit 7
The goal is that through supporting early applications of clean heat technologies, technology providers can develop more competitively priced equipment, and utilities can support rates that encourage flexible and grid-optimized industrial electrification, making the business case clearer to facilities and investors and easing the need for long-term state fiscal support.
Clean heat PTCs can meaningfully reduce annual industrial greenhouse gas emissions by 29% and realize $27–$49 billion in annual health benefits from reduced criteria air pollutants.
By 2035, modeled annual Scope 1 greenhouse gas reductions reach 273 million tons of CO2e (reflecting a reduction of 29% against business as usual), equivalent to taking approximately 59 million passenger vehicles — one in four passenger vehicles in the United States — off the road. Because clean heat technologies continue to avoid the greenhouse gas emissions that would have otherwise been emitted from traditional technologies under business-as-usual conditions, the benefits of avoided greenhouse gas reductions continue to increase long after the credit expires.
Exhibit 8
In addition, a clean heat PTC has the potential to make significant reductions in harmful criteria air pollutants (CAPs) like nitrogen oxide, sulfur dioxide, carbon monoxide, volatile organic compounds and particulate matter. According to US Environmental Protection Agency’s COBRA tool, starting in 2035 the reduction potential in criteria air pollutants modeled below in Exhibit 7 would result in $27–$49 billion per year in health savings from avoided adverse health outcomes. The modeled CAPs reductions would result in an estimated 1,900–3,200 avoided premature deaths per year and 480,000 fewer school loss days per year.3 The leveling out of CAP reduction potential in 2035 reflects the final year of accepted clean heat technology installations.
Exhibit 9
Policy Design Considerations
As evidenced above by the wide range of PTC values and potential economic and environmental impact across all 50 states, the design and implementation of a PTC for clean industrial heat will vary by each state’s manufacturing profile, budget, and target deployment goals. However, there are some universal design features and roles for state agencies to consider when developing the policy.
There are three major design features of a PTC for industrial clean heat: credit structure, credit value, and credit eligibility. Policymakers will have to make additional design choices beyond these features and can do so in conjunction with these features, including whether and how to tailor a tax credit structure to meet the unique needs of their state and its major emitting industrial sectors.
This section describes the most relevant decisions and considerations for each design feature.
Credit structure
A credit can be structured on a dollar per unit of heat basis, expressed as $/MMBtu. This credit rewards recipients for every unit of clean heat produced additional to a baseline, which can be determined by facility average clean heat use or by subsector averages.
Other elements to consider when structuring a credit include refundability, adaptability, budgeting and annual caps, designing for bankability, and phase-in and phase-out timelines.
Refundability
Tax credits are commonly used policy incentives for energy projects, but depending on design can require complex tax equity structures or other administrative workarounds with high transaction costs. To avoid this challenge, a clean heat PTC could be designed to be refundable, meaning an applicant can receive the full value of the credit, even if it exceeds their tax liability. This allows all firms to access the incentive, including firms with small tax liabilities or firms in states that levy low corporate income taxes.
If a tax credit is not refundable, but is still transferable, smaller firms can partner with larger firms to apply their tax credit and receive a portion of the credit. However, these pass-through firms often take a cut, so the value of the state’s dollar is essentially diminished every time a recipient needs to transfer its credits.
Adaptability
A PTC is a policy tool to support emerging markets in reaching economies of scale, so it follows that a successful PTC would help solutions providers produce equipment and services at more competitive prices and improve the economics of clean industrial heat. States can therefore consider designing for adaptability, where the value of the credit changes to reflect market conditions.
This can be done by allowing for periodic updated rulemaking during the credit’s lifetime and could help a state avoid over-subsidizing a technology where economics improve over a credit’s lifetime. This adaptability element would need to be balanced with the private sector’s need for policy certainty, where companies and their lenders are unlikely to make long-term investment decisions if a credit is perceived as uncertain. This could be mitigated by signing fixed credit value agreements with early adopters, so that companies and private lenders can trust the state to provide stable cashflows to a project.
Phase-in and phase-out timelines
Facility investment planning cycles are long, and heating technologies are long-lasting; credit phase-in and phase-out would ideally reflect this in policy design. For example, a PTC in effect for a fixed amount of time but that could generate 10 years of credits tied to the first year of project installation will encourage more clean heat technology uptake than a PTC in effect for a total of 10 years, as industrial firms whose investment cycles align with the latter end of the PTC applicability would likely be disincentivized to choose technologies benefiting from an expiring credit.
Credit value
The policy aim of a clean heat production tax credit is to accelerate deployment of modern industrial heating equipment by closing the cost gap between the levelized cost of heat (LCOH) from incumbent heating systems and eligible clean heating technology. LCOH is a measure of the average cost to deliver a unit of heat over an equipment’s lifetime and is inclusive of capital costs and operational expenditures on fuel and maintenance. This measure helps to compare the economic competitiveness of delivering heat across technologies, often expressed on a $/MMBtu or $/MWh basis. The model assumes a 20-year equipment life cycle for all technologies to calculate LCOH.
Because clean heat can describe a set of different resources rather than a single technology, states should define eligibility carefully. The term can include electrified technologies such as industrial heat pumps, e-boilers, and thermal batteries; renewable thermal energy such as solar thermal systems and geothermal heat; and thermal efficiency measures, such as recovered waste heat. Depending on state policy choices, low-carbon fuels may also be considered. These options differ in technology readiness, emissions accounting, heat temperature, duty cycle, fuel or grid availability, and ease of verification. In this case, the model considers the commercially mature low- and medium-temperature applications most likely to respond to operating cost support, rather than all industrial heat applications.
Calculating an appropriate credit value
While the average national price of a clean heat PTC assuming medium gas and electricity prices is $13.57/MMBtu, the exact value of a modeled PTC will vary by state depending on electricity prices, gas prices, and whether there are any grant programs to address the up-front costs to purchase new heating equipment. Further, even within states, there are certain project efficiencies based on the industrial subsector, technology deployed, and specific facility profile that will impact how well a given state clean heat PTC can contribute to a facility’s capital stack.
As noted in the Key Takeaways section, high gas prices significantly reduce the PTC value, whereas low electricity prices moderately reduce PTC values. Deploying a PTC in conjunction with a grant also reduces total PTC value moderately. Exhibit 8 shows the range of PTC values in each state and Washington, D.C.
Exhibit 10
Credit value should also consider assumed willingness to pay by industry for cleaner heat; export-oriented industries, companies subject to state regulations, or companies with sustainability goals may have a higher willingness to pay for clean heat because of dependence on global markets, regulations, or internal goals. The model currently assumes zero willingness to pay, but states can and should adjust that based on their knowledge of their companies and manufacturing base.
Budgeting and annual caps
States can choose between uncapped and capped PTC designs. An uncapped credit is simplest and most bankable for manufacturing because every eligible unit of clean heat receives the promised value. However, it also creates the largest and least predictable exposure for state budgets. A capped credit gives lawmakers more control over annual revenue impacts, but the cap should be understood as a deployment constraint: once the allocation is exhausted, additional otherwise eligible projects must wait, receive a smaller credit, or move forward without support.
As noted above, uncapped credits costs per state could vary substantially, with a range from roughly $1 billion to $170 billion cumulatively by 2045, and with the total US spend exceeding $650 billion in the medium gas and medium electricity price scenarios from 2026 to 2045.
If a state opts for a capped PTC to balance competing budget priorities, the state could consider a discretionary competitive tax credit. A competitive approach would require applications and award credits based on the highest and best use of the state’s dollar. This approach would require additional up-front work by applicants and the state but would ensure state funding is allocated to high-quality projects. A competitive program could include criteria that reflects state objectives, such as economic development, public health, equity, climate, or environmental goals. Potential examples of evaluation criteria include:
- Percent of facility emissions reduced
- Total emissions reduced
- Total criteria air pollutants reduced
- First-of-a-kind or Nth-of-a-kind technology being deployed
- Quality jobs supported
- Location in a non-attainment zone or low to moderate income census tract
Annual credit allocations can be established with target deployment goals in mind. As a stand-alone policy without additional, complementary support, the PTC credit value would be most effective if it is valued at a rate that produces cost parity between the LCOH of incumbent technology, such as gas boilers, and the LCOH of clean heating technologies. Alternatively, a lower PTC value targeted at resolving the cost disparity of operating costs only could be used as well, though would likely be most effective if used with complementary policies.
Credit eligibility
To ensure prudent use of taxpayer funds, there are three criteria to consider regarding how the value of the credit could be applied most efficiently per unit of clean heat:
- Used productively: reward heat that is used in an industrial process, not for HVAC, ensuring waste heat is captured and reused to avoid heat losses.
- Delivered to a heating process: reward based on unit of heat delivered to a process, rather than generated, so efficient heating technologies that recycle heat aren’t inadvertently penalized.
- Additional to a facility’s clean heat baseline: reward new clean heat, not what a facility already uses to avoid subsidizing previous business decisions.
Eligible entities
The credit is targeted for industrial heat emissions abatement and therefore can be most effective if claimed by manufacturing facilities. Additionally, many facilities, rather than directly investing in new clean heat technologies, are turning to heat-as-a-service providers, which offer third-party ownership models. These companies are like an energy service company for heat, owning and operating the equipment and selling heat at a set price to industrial offtakers. When designing eligibility clauses, it is important to consider allowing third-party heat providers, in addition to industrial facilities, to access this credit.
While clean heat PTCs can inherently apply to any end use of clean heat, this modeling assumes the credit will be used solely for process heating activities in manufacturing firms such material drying and curing, food and beverage cooking and pasteurization, and process steam generation. This distinction in end-use eligibility is to maintain state dollars for harder-to-abate industrial process heating emissions and thereby omits residential, commercial, and industrial space, or “comfort” heating.
Eligible technologies
State air regulators or a similar entity will need to determine how to define “clean heat,” as there is no national definition. Some states take a technology-neutral approach, favoring options that reduce the most emissions on a life-cycle basis, and designing declining emissions intensity requirements to reflect innovation gains. Others favor certain low-carbon technologies. Clean heat may be defined as that which is produced through an electrified technology, like heat pumps, electric boilers, or thermal batteries, or other low or no-emissions energy sources such as geothermal energy and solar thermal energy, instead of combusted fossil fuels.4
Some states may also choose to include low carbon-intensity fuels such as biomethane. Since many industries like pulp and paper already use biomass in their typical production processes, biogenic and biomass sources of heat are excluded from eligibility in the model to avoid subsidizing already economic business operations, although some states may choose to include them.
Designing for additionality
A well thought out tax credit program can kickstart deployment of clean heat technologies that are mature but uneconomic today due to current market and policy conditions. This means that there would be minimal state spending on facility investments or activities that already would have taken place without the incentive.
It is therefore important for a credit to establish a baseline clean heat share for its recipients and only award credits for the units of heat above that clean heat share. A baseline can be established by requiring recipients to provide documentation from prior years, showing the share of heat produced at a facility before receiving the credit. For newer facilities, or to simplify administration, states can consider using subsector-wide average clean heat share from US EIA Manufacturing and Energy Consumption Survey data and only award credits for facilities with a clean heat share considerably higher than the average clean heat share in that same subsector.
Verifying clean heat production
When designing a clean heat PTC, a state must consider tradeoffs between administrative costs and the cost of wasting credits to lower-value activities. The former can balloon costs with complex rulemaking, independent verifications, and meticulous auditing. The latter means that states are rewarding lower-value activities that may have taken place without the credit.
One way to verify clean heat production is to require recipients to provide documentation of energy consumption for every year they receive a credit, as well as three to five years prior to receiving a credit to prove additional clean heat activity. This would establish a “baseline clean heat share” for facilities, and credits would only be provided for clean heat share above a baseline. This will require staff time and expertise to review. Another way to verify is through independent verification or audits, as is done in California’s Low Carbon Fuel Standard program.
Implementing Entities
To enact and implement a clean heat production tax credit, various state entities need to be involved, either directly or in complementary actions. Exhibit 9 outlines important actors and potential roles needed to administer a clean heat PTC.
Exhibit 11
Actors and potential roles needed to administer a clean heat PTC
| Venue | Role |
|---|---|
| Legislature |
|
| Department of Revenue/Taxation |
|
| State Energy Office |
|
| Public Utility Commission |
|
| State Environmental Regulator |
|
Conclusion
A clean heat production tax credit is a practical, market-friendly tool for helping manufacturers modernize their facilities without putting their competitiveness at risk. By tying support to each unit of clean heat produced, the credit rewards performance, lowers operating costs, and gives firms a clearer business case for investing in efficient, lower-emissions equipment.
The goal is to bridge today’s cost gap while clean heat technologies mature. Designed well, a clean heat PTC can help states strengthen local manufacturing while also reducing industrial emissions and improving air quality. It gives early movers a temporary boost, protects manufacturers from energy price volatility, and helps position domestic industries to compete in markets that increasingly value cleaner production.
The modeling presented in this report suggests that a time-limited clean heat PTC could accelerate industrial clean heat adoption while delivering substantial emissions reductions. While the credit value needed to achieve cost parity varies across states, the results indicate that targeted operating-cost support can help overcome one of the primary barriers to industrial electrification: the cost gap between electricity and fossil fuels. By helping manufacturers invest in cleaner technologies without sacrificing competitiveness, a clean heat PTC can support both industrial modernization and long-term emissions reductions.
Appendix: Modeling Policy Methodology
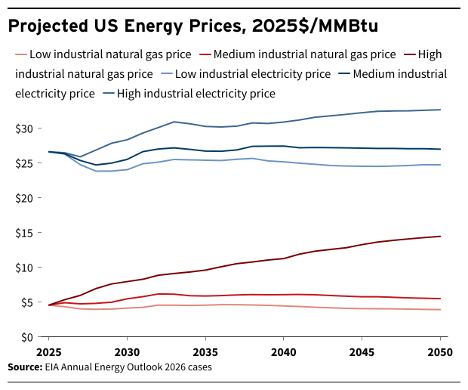
RMI built a model to estimate the energy, emissions, and cost impacts of industrial clean heat policies, 2026 through 2045. The model uses data from the Energy Information Administration’s (EIA) State Energy Data System, EIA’s Manufacturing Energy Consumption Survey, industrial energy price projections from EIA’s Annual Energy Outlook 2026, industrial heating equipment information from the Center for Applied Environmental Law and Policy’s HEATset, EPA data on emission factors and co-pollutants, EPA FLIGHT data on facilities, NREL techno-economic estimates of heat pumps and e-boilers, and ACEEE studies on industrial heat pumps.
The model calculates a state-specific value for the clean heat production tax credit — based upon the technical specifications of natural gas boilers versus industrial heat pumps and e-boilers, and projections of future industrial natural gas and electricity prices — that can reduce the “spark gap” between equivalent gas and electric prices. As existing low- and medium-temperature industrial heating equipment reaches its end of life, the value of the PTC encourages industrial facilities to adopt clean heat technologies rather than installing new natural gas-based heating equipment.
Based upon downscaled projections of future industrial natural gas and industrial electricity prices from AEO2026, the model can be run using high, medium, or low future energy prices. Beliefs about future energy prices impact the per MMBtu value needed from the PTC to make up the “spark gap” between equipment fueled by electricity versus equipment fueled by natural gas. For example, with high natural gas prices and medium electricity prices the credit value per MMBtu needed to encourage industrial heat electrification would be lower than under medium natural gas prices and medium electricity prices.
Exhibit 12
To mirror existing federal production tax credits like those for renewable energy, the model has been set up so that facilities are eligible to receive the clean heat production tax credit for 10 years as long as the clean heat equipment is installed by 2035. For example, if a facility installs clean heat equipment in 2029, they would be eligible to receive the tax credits until 2039. If a facility installs clean heat equipment in 2037, they would not be eligible to receive the tax credit.
The model can be run with annual caps on tax credit expenditure by the state. Capping the annual expenditure the state makes on tax credits slows down the transition to electrified industrial heat. The results shown in this paper reflect an uncapped PTC.
Model results should be considered conservative for several reasons. The model does not presume any wider market catalyzation from the PTC that leads to additional emissions reductions without the incentive. Relatedly, once the tax credit expires, the transition to clean heat technology plateaus; due to lack of incentives in the 2040s we see a halt to new deployments of clean heat equipment.
The model does not presume any economies of scale for the price of the e-boilers and heat pumps due to increased deployment, so the prices for clean heat equipment do not decrease with scale. Also, existing natural gas boilers are not replaced with e-boilers and heat pumps until the end of the existing equipment’s useful life, regardless of how generous the PTC for clean heat may be. Although policy may be structured to allow for high-heat applications to receive the production tax credit, due to limited technology options today for clean high heat application, the model does not estimate high-heat applications switching to clean heat equipment.
Endnotes
- The social cost of carbon (SCC) is an estimate used by the US federal government to quantify the economic damages that result from emitting an additional ton of carbon dioxide into the atmosphere. Rennet et al.’s analysis “Comprehensive evidence implies a higher social cost of CO2,” published in Nature, underpinned the US EPA’s usage of a $190 per ton estimate for cost-benefit analysis in its proposal to reduce methane from new and existing oil and natural gas facilities. ↩
- Given today’s technologies, for higher temperature industries, other cost supports like investment tax credits, grants, and procurement support may provide more meaningful support than a PTC. ↩
- Based on reductions of NOx, SO2, VOCs, and PM 2.5. EPA’s COBRA tool does not include CO or PM10 in its health endpoint calculations. ↩
- Notably, for clean heat technologies that rely on electricity, clean heating solutions will become increasingly effective in reducing both climate and air pollutants and improving public health outcomes as the US electrical grid becomes cleaner in the coming years, producing fewer Scope 2 emissions. ↩
Authors

Hannah Thonet
Manager
Allie Jobe
Associate
Emily Albergo
Associate
Drew Veysey
Senior Associate
Megan Gross-Wilkinson
Senior AssociateRelated Insights


Harnessing Green Demand to Drive Sustainable Chemicals Production
Help build the clean energy future. Donate today.
Independent research. Real-world solutions. Supported by donors.
RMI can pursue the highest-impact climate and energy solutions because we’re supported by people who believe change is possible. Every gift helps advance the work needed to make clean energy the default choice worldwide.
For other ways to give to RMI, including checks or gifts of stock, please visit Other Ways to Give.
