
Report | 2022
Harnessing the Power of S-Curves
How S-Curves Work and What We Can Do to Accelerate Them
In our Peaking Series, we introduced The Peak, Plateau, and Decline and presented historical examples to show how demand for fossil fuels faces inevitable decline. The S-curve growth of new innovations is the main driver of this process of decline.
The full report, available for download, breaks down the system dynamics of the S-curve in easy-to-understand pieces and can be used to help you take the right action at the right time.
Summary
The adoption rate of innovations is non-linear; it is slow at first, then rapidly rises before flattening out again as it reaches market saturation. Such trajectories of growth are commonly known as the S-curve. The rapidly rising part of the S-curve is often underestimated in projections and expectations of new technologies. This is exactly what has happened with wind, batteries, and solar technologies in the past decade, with prices dropping faster and further than many believed possible.
The shape of the S-curve is a result of system feedbacks such as learning curves, economies of scale, technological reinforcement, and social diffusion.
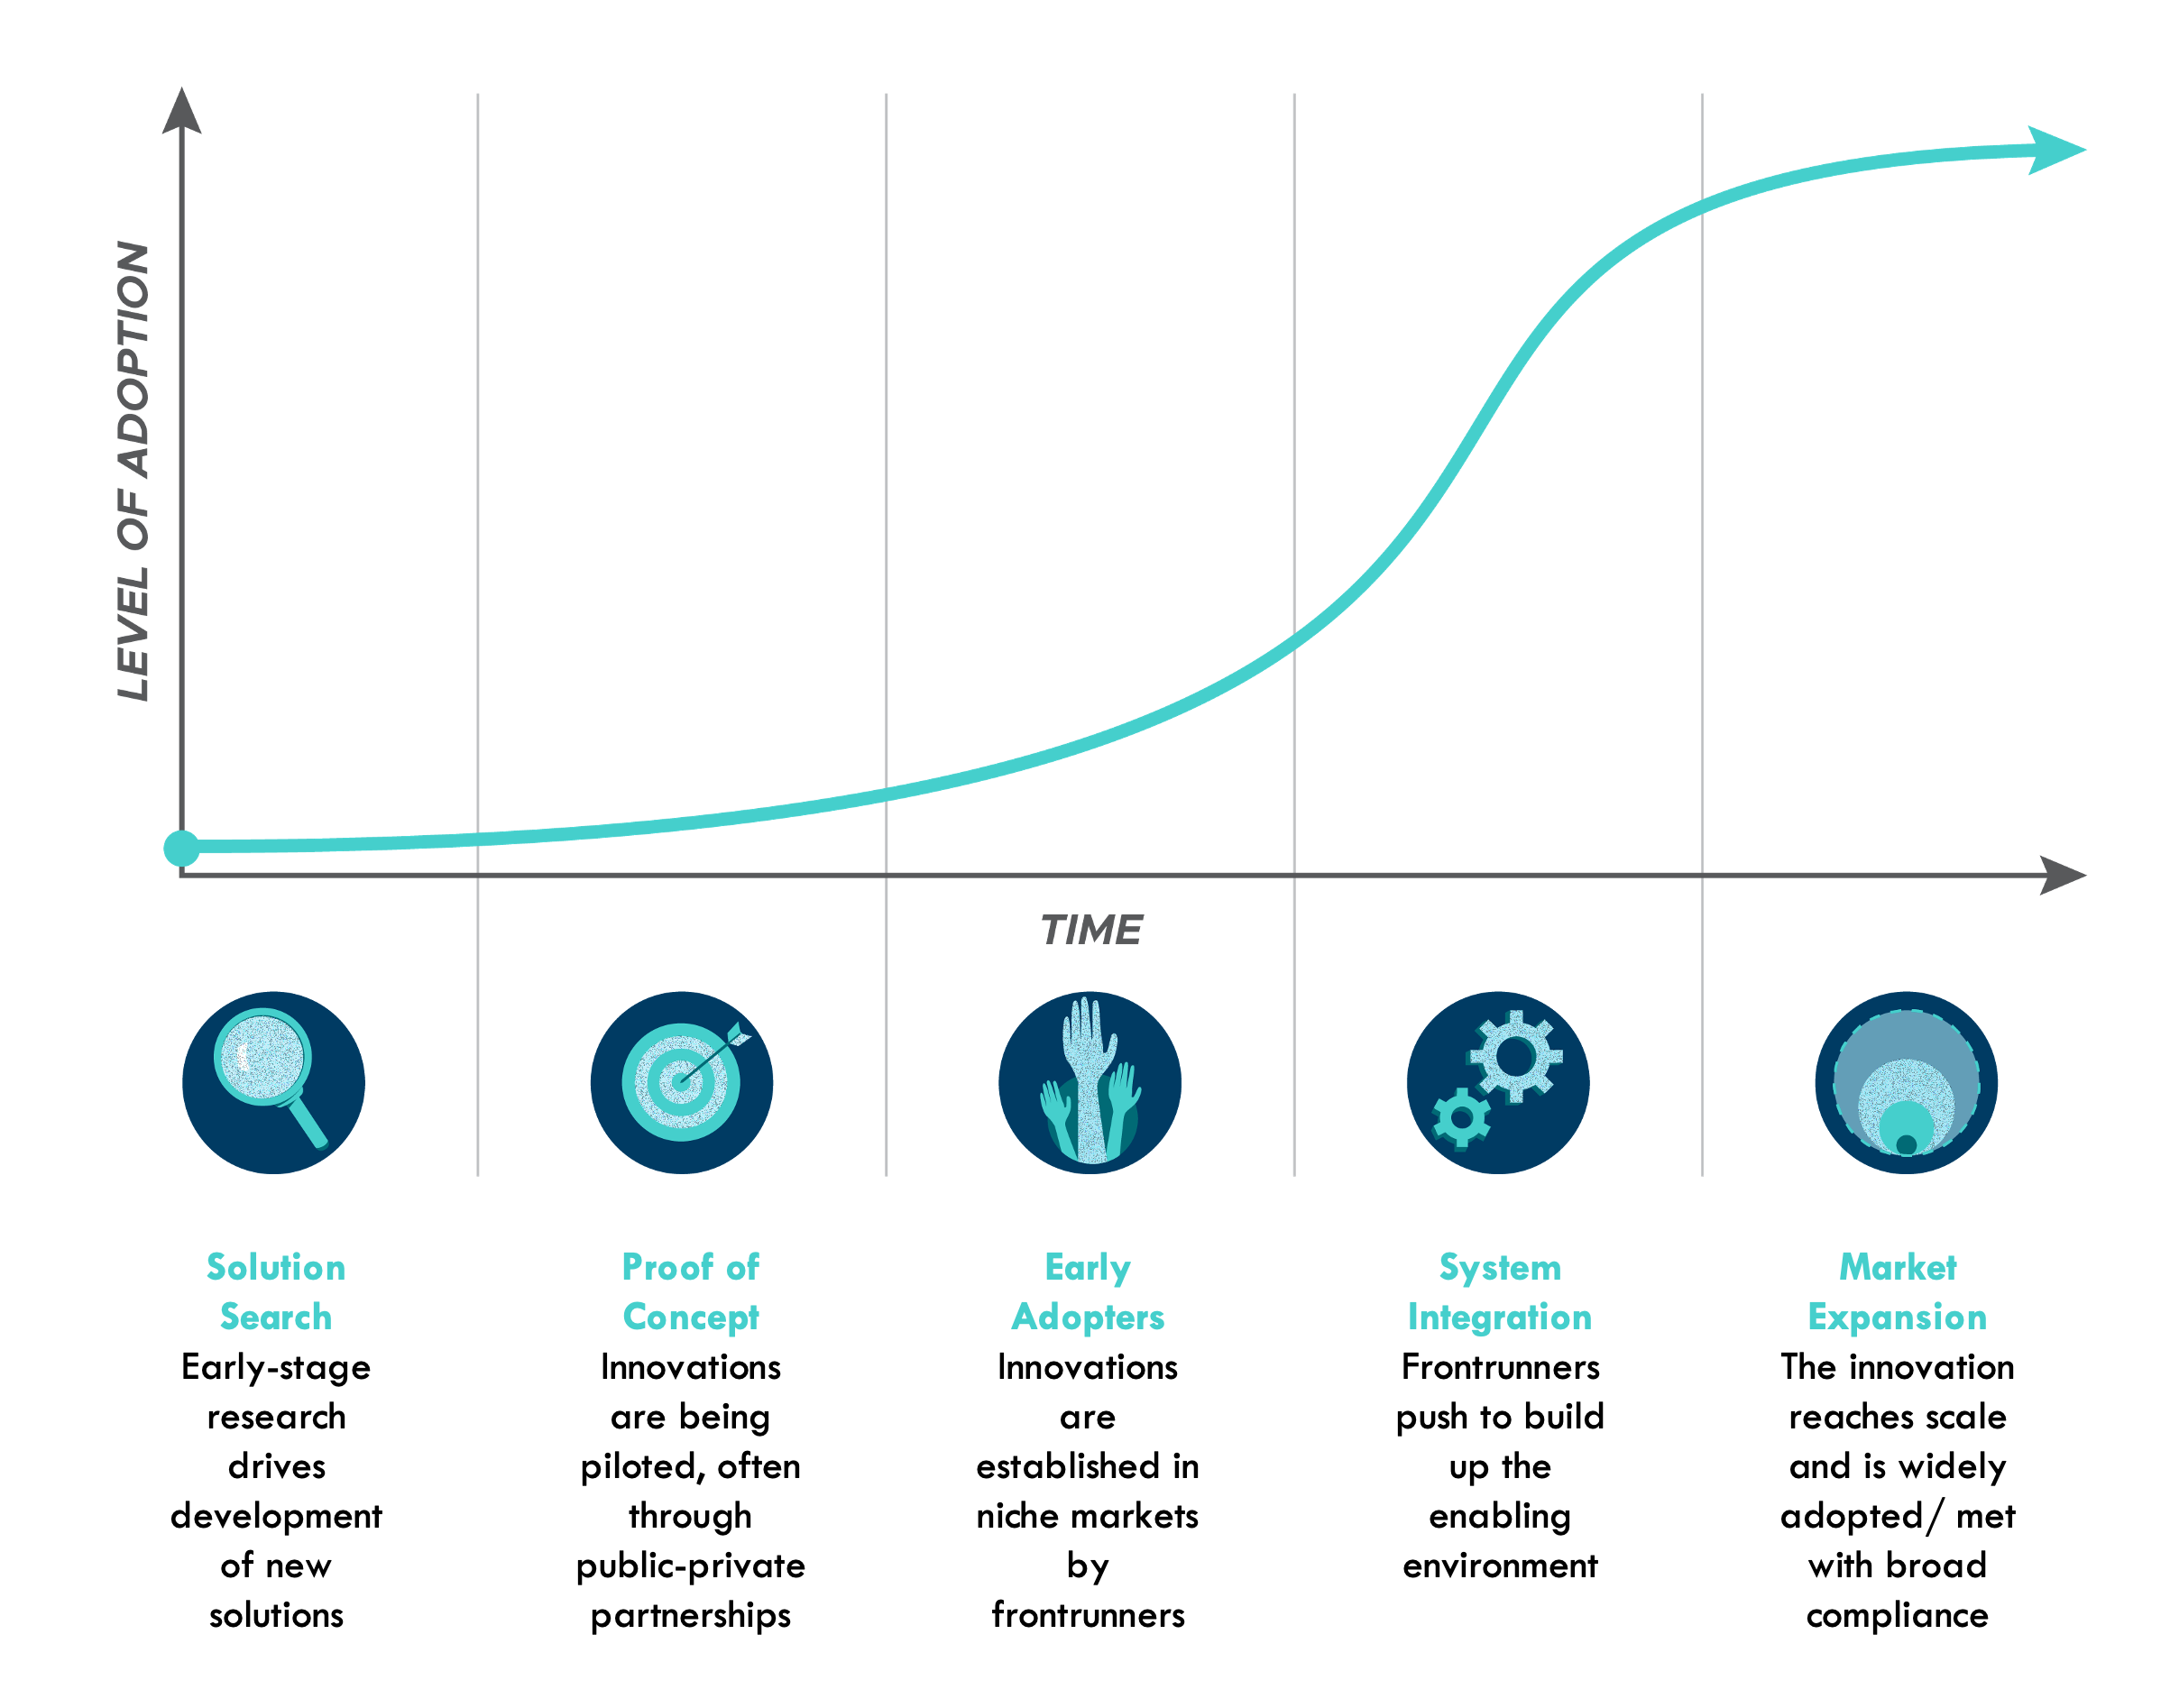
The process of an S-curve is complex and context specific, and some innovations are more likely to scale than others, but all transitions follow the same pattern of shifting dynamics:
- Phase 1: Visionaries recognize a problem or opportunity and conceptualize a better way to do things.
- Phase 2: Innovators move the concept from the laboratory, models, and sketches to working prototypes or pilots.
- Phase 3: Early adopters form niche markets, connecting supply and demand. Performance increases and costs decline but the innovation remains at a premium and not widely available.
- Phase 4: The innovation reaches mass market as it outperforms incumbents in costs and performance. This is the steep part of the S-curve.
- Phase 5: Growth slows as the innovation reaches market saturation. The innovation may be transferred to new markets or serve as the basis for further innovations.
Barriers and system dynamics are predictable, manageable, and solvable through each of these phases. This means that as transitions unfold, stakeholders who have a good understanding of various innovations and their phases can develop targeted strategies to stay ahead of, and take advantage of, new markets. Generally, the fastest movers will stand to capture the biggest rewards, and the slowest movers will be left with the biggest losses.