Learn how we are working to transform how we use and produce energy.
Fleet Electric Vehicle Total Cost of Ownership with and without Federal Tax Credits
Why we share this work for free
RMI is an independent nonprofit working to accelerate the clean energy transition. We publish research like this to inform decision-makers and drive real-world impact.
Our work is supported by philanthropy as well as partnerships, including fee-for-service engagements. This support makes it possible for us to share our independent insights for free.
If you find this work valuable, you can support it anytime.
Get more insights like this
Stay up to date with the latest research, analysis, and tools from RMI by opting in to receive occasional emails below. You’ll get new reports, event invitations, and practical insights to help us all accelerate the clean energy transition.
Loading form...
Your download should start automatically. If it doesn’t, click the download button below.
This work is made possible by philanthropy
RMI is a nonprofit supported by donors and partners. Philanthropy enables us to produce independent research and make resources like this freely available.
If you find this report valuable, please consider supporting our work. You can also explore how we partner with organizations to drive impact.
Jump to Section
For a previous version of this analysis, please see our article: Businesses and Local Governments: It’s Never Been a Better Time to Electrify Your Vehicle Fleet.
Updated RMI analysis demonstrates that electric vehicles are more economical for fleets across light- and medium-duty applications than equivalent fossil fuel vehicles. Even so, total cost of ownership (TCO) for EV fleet vehicles increases if federal commercial vehicle tax credits and charger tax credits are unavailable. Previous analysis has been updated with a wider range of fuel prices and the availability of federal tax credits.
Patrol cars

Image credit: Kevauto, under the Creative Commons Attribution-Share Alike 4.0 International license.
Without tax credits, the TCO for electric patrol cars remains higher than equivalent fossil fuel vehicles unless fuel prices surpass $3.75/gallon. With tax credits, the TCO for electric patrol cars is lower than equivalent fossil fuel vehicles and becomes even more economical as fuel prices rise.
Paratransit vehicles
Even without tax credits, the TCO for electric paratransit vehicles is lower than equivalent fossil fuel vehicles across the range of fuel prices modeled. With tax credits, the TCO for electric paratransit vehicles is even lower than equivalent fossil fuel vehicles. If the paratransit van traveled significantly less than the modeled 22,500 miles per year, the TCO advantage for the electric version would diminish.
Construction contractor vehicles

Without tax credits, the TCO for electric construction contractor vehicles remains higher than equivalent fossil fuel vehicles. With tax credits, the TCO for electric construction contractor vehicles is higher than equivalent fossil fuel vehicles until fuel reaches $3.75/gallon. These results should be considered very conservative if traveling more than 12,000 miles per year.
Private security vehicles

Without tax credits, the TCO for private security electric vehicles remains higher than equivalent fossil fuel vehicles. With tax credits, the TCO for private security electric vehicles is lower than equivalent fossil fuel vehicles and becomes even more economical as fuel prices rise.
Commercial delivery business
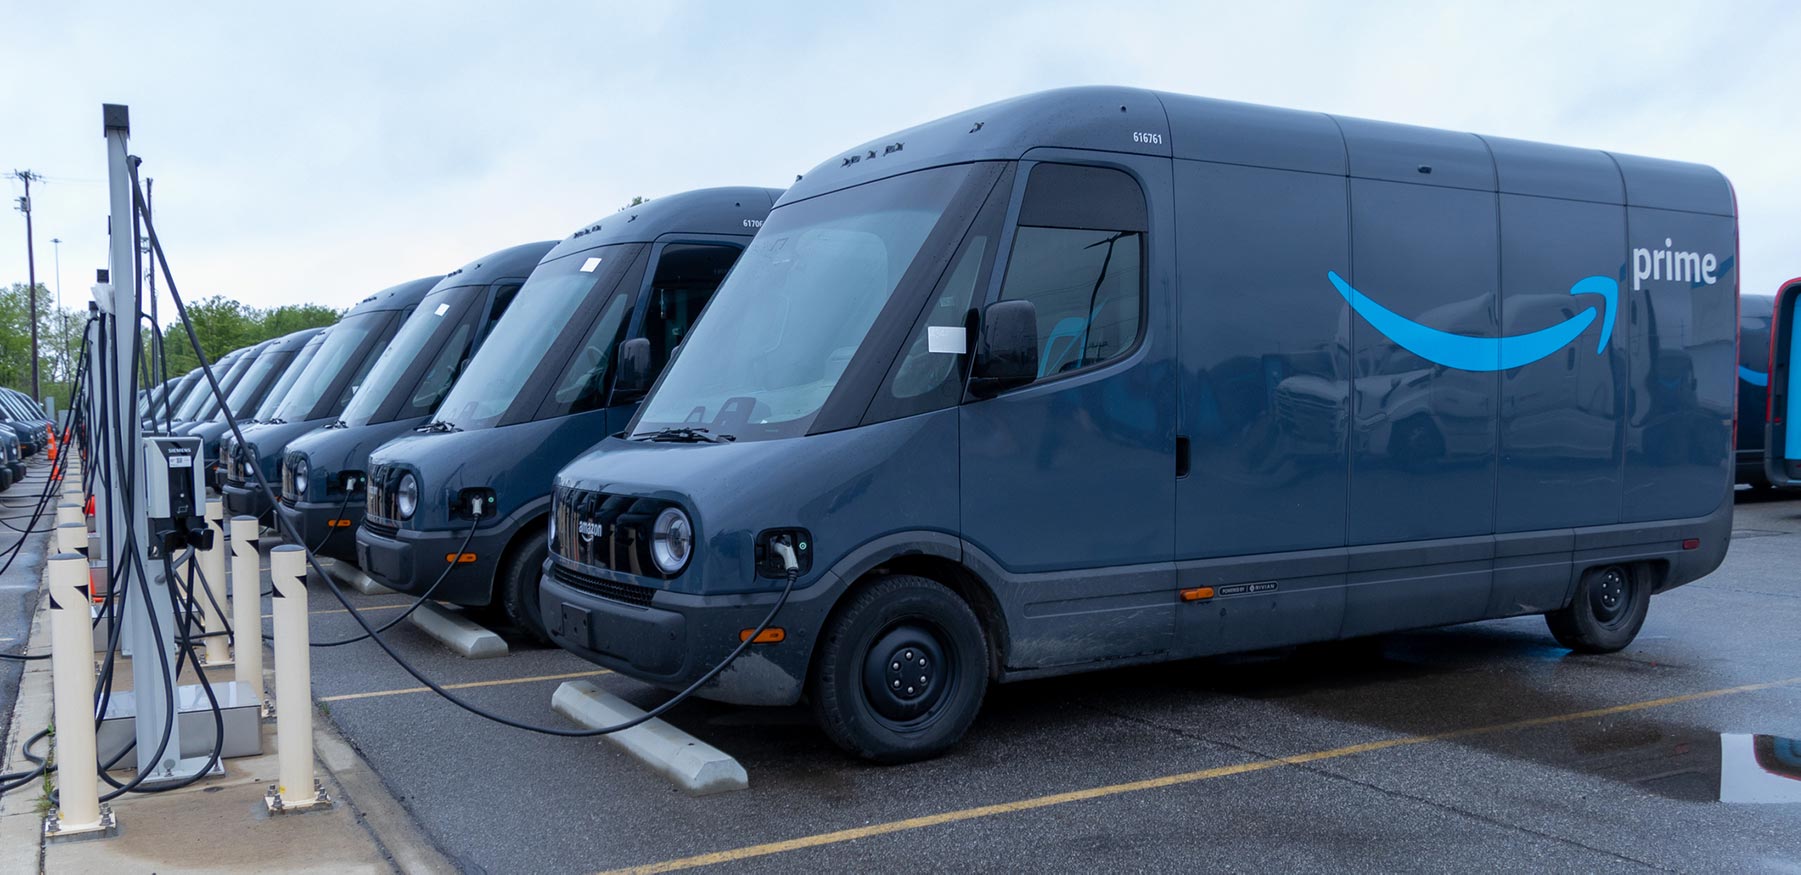
Without tax credits, TCO for large medium-duty delivery business electric vehicles remains higher than equivalent fossil fuel vehicles. With tax credits, TCO for large medium-duty delivery business electric vehicles is higher than equivalent fossil fuel vehicles but approaches parity when diesel fuel prices are $3.75/gallon. These results are somewhat conservative because it does not include the price of diesel emission fluid, and national average diesel prices have been over $4.00 for long durations in the recent past.
Methods
Analysis was performed using the DRVE Tool 2.0 built by Atlas Public Policy and Electrification Coalition. The total cost of ownership estimates do not presume that charging infrastructure is already available, and thus the TCO estimates include the cost of installing and maintaining one level 2 charger per vehicle. Electricity price inputs reflect the national average as of October 2024. Annual mileage inputs should be considered an average and not representative of every situation within a scenario.
Supporting information


Related Insights


Help build the clean energy future. Donate today.
Independent research. Real-world solutions. Supported by donors.
RMI can pursue the highest-impact climate and energy solutions because we’re supported by people who believe change is possible. Every gift helps advance the work needed to make clean energy the default choice worldwide.
For other ways to give to RMI, including checks or gifts of stock, please visit Other Ways to Give.
