
We are seeing more and more electric vehicles (EVs) on US roads every year. And while charging infarstructure is also growing, vehicles are outpacing public charger deployment. To support tomorrow's EVs, utilities, grid operators, and EV service providers need to know where to invest in the grid today, so that we build sufficient charging infastructure in the right places and at the right time.
Supporting strategic investment in grid infrastructure
GridUp forecasts when and where energy and power demand is likely to materialize from EV charging.
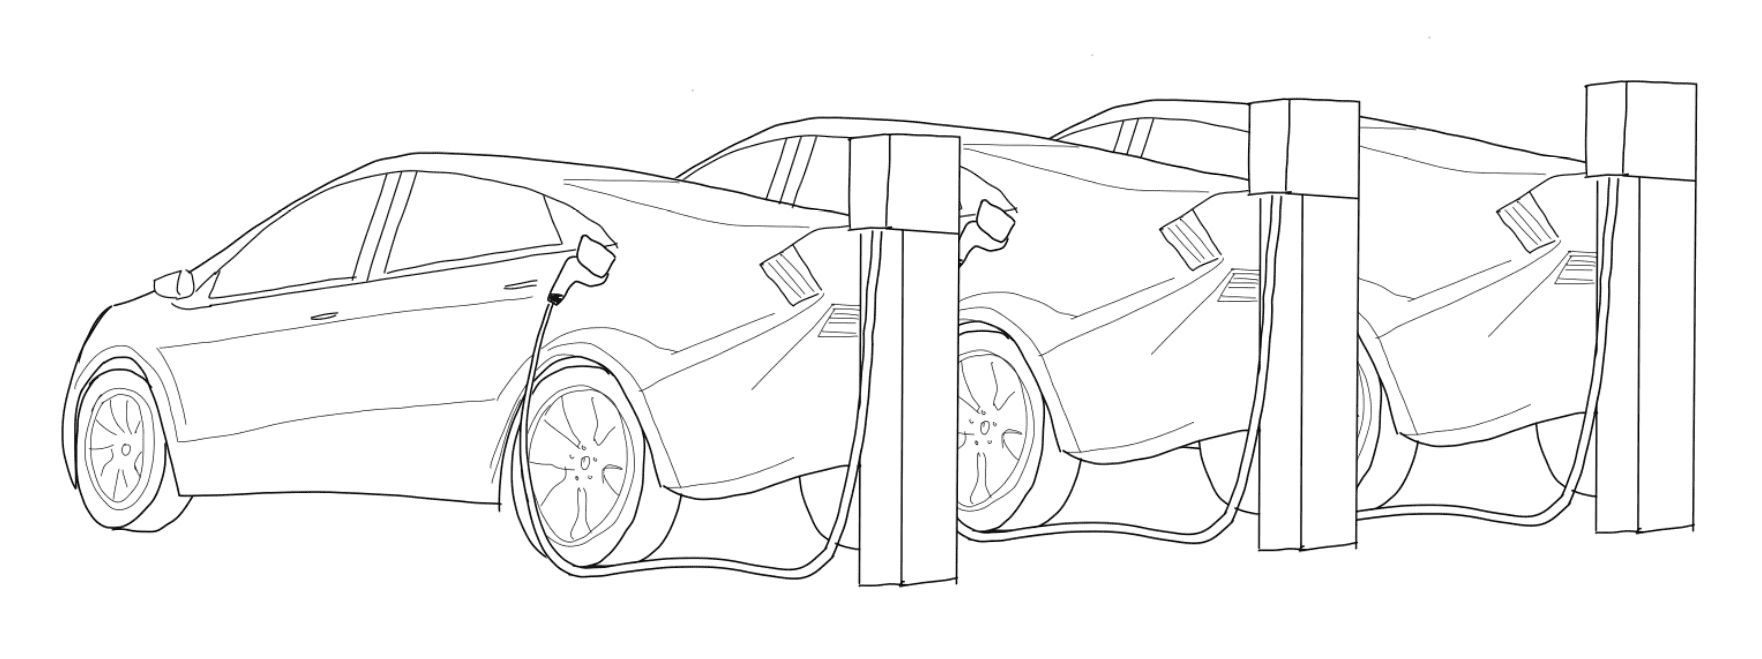
This allows decision makers to identify “hot spot” areas for vehicle charging.
Depending on existing infrastructure, some areas will need grid upgrades to enable rapid EV adoption. Making these upgrades based on longer-term planning and with an eye toward how the EV market may develop can support cost-effective infrastructure buildout that helps manage costs for all utility customers.
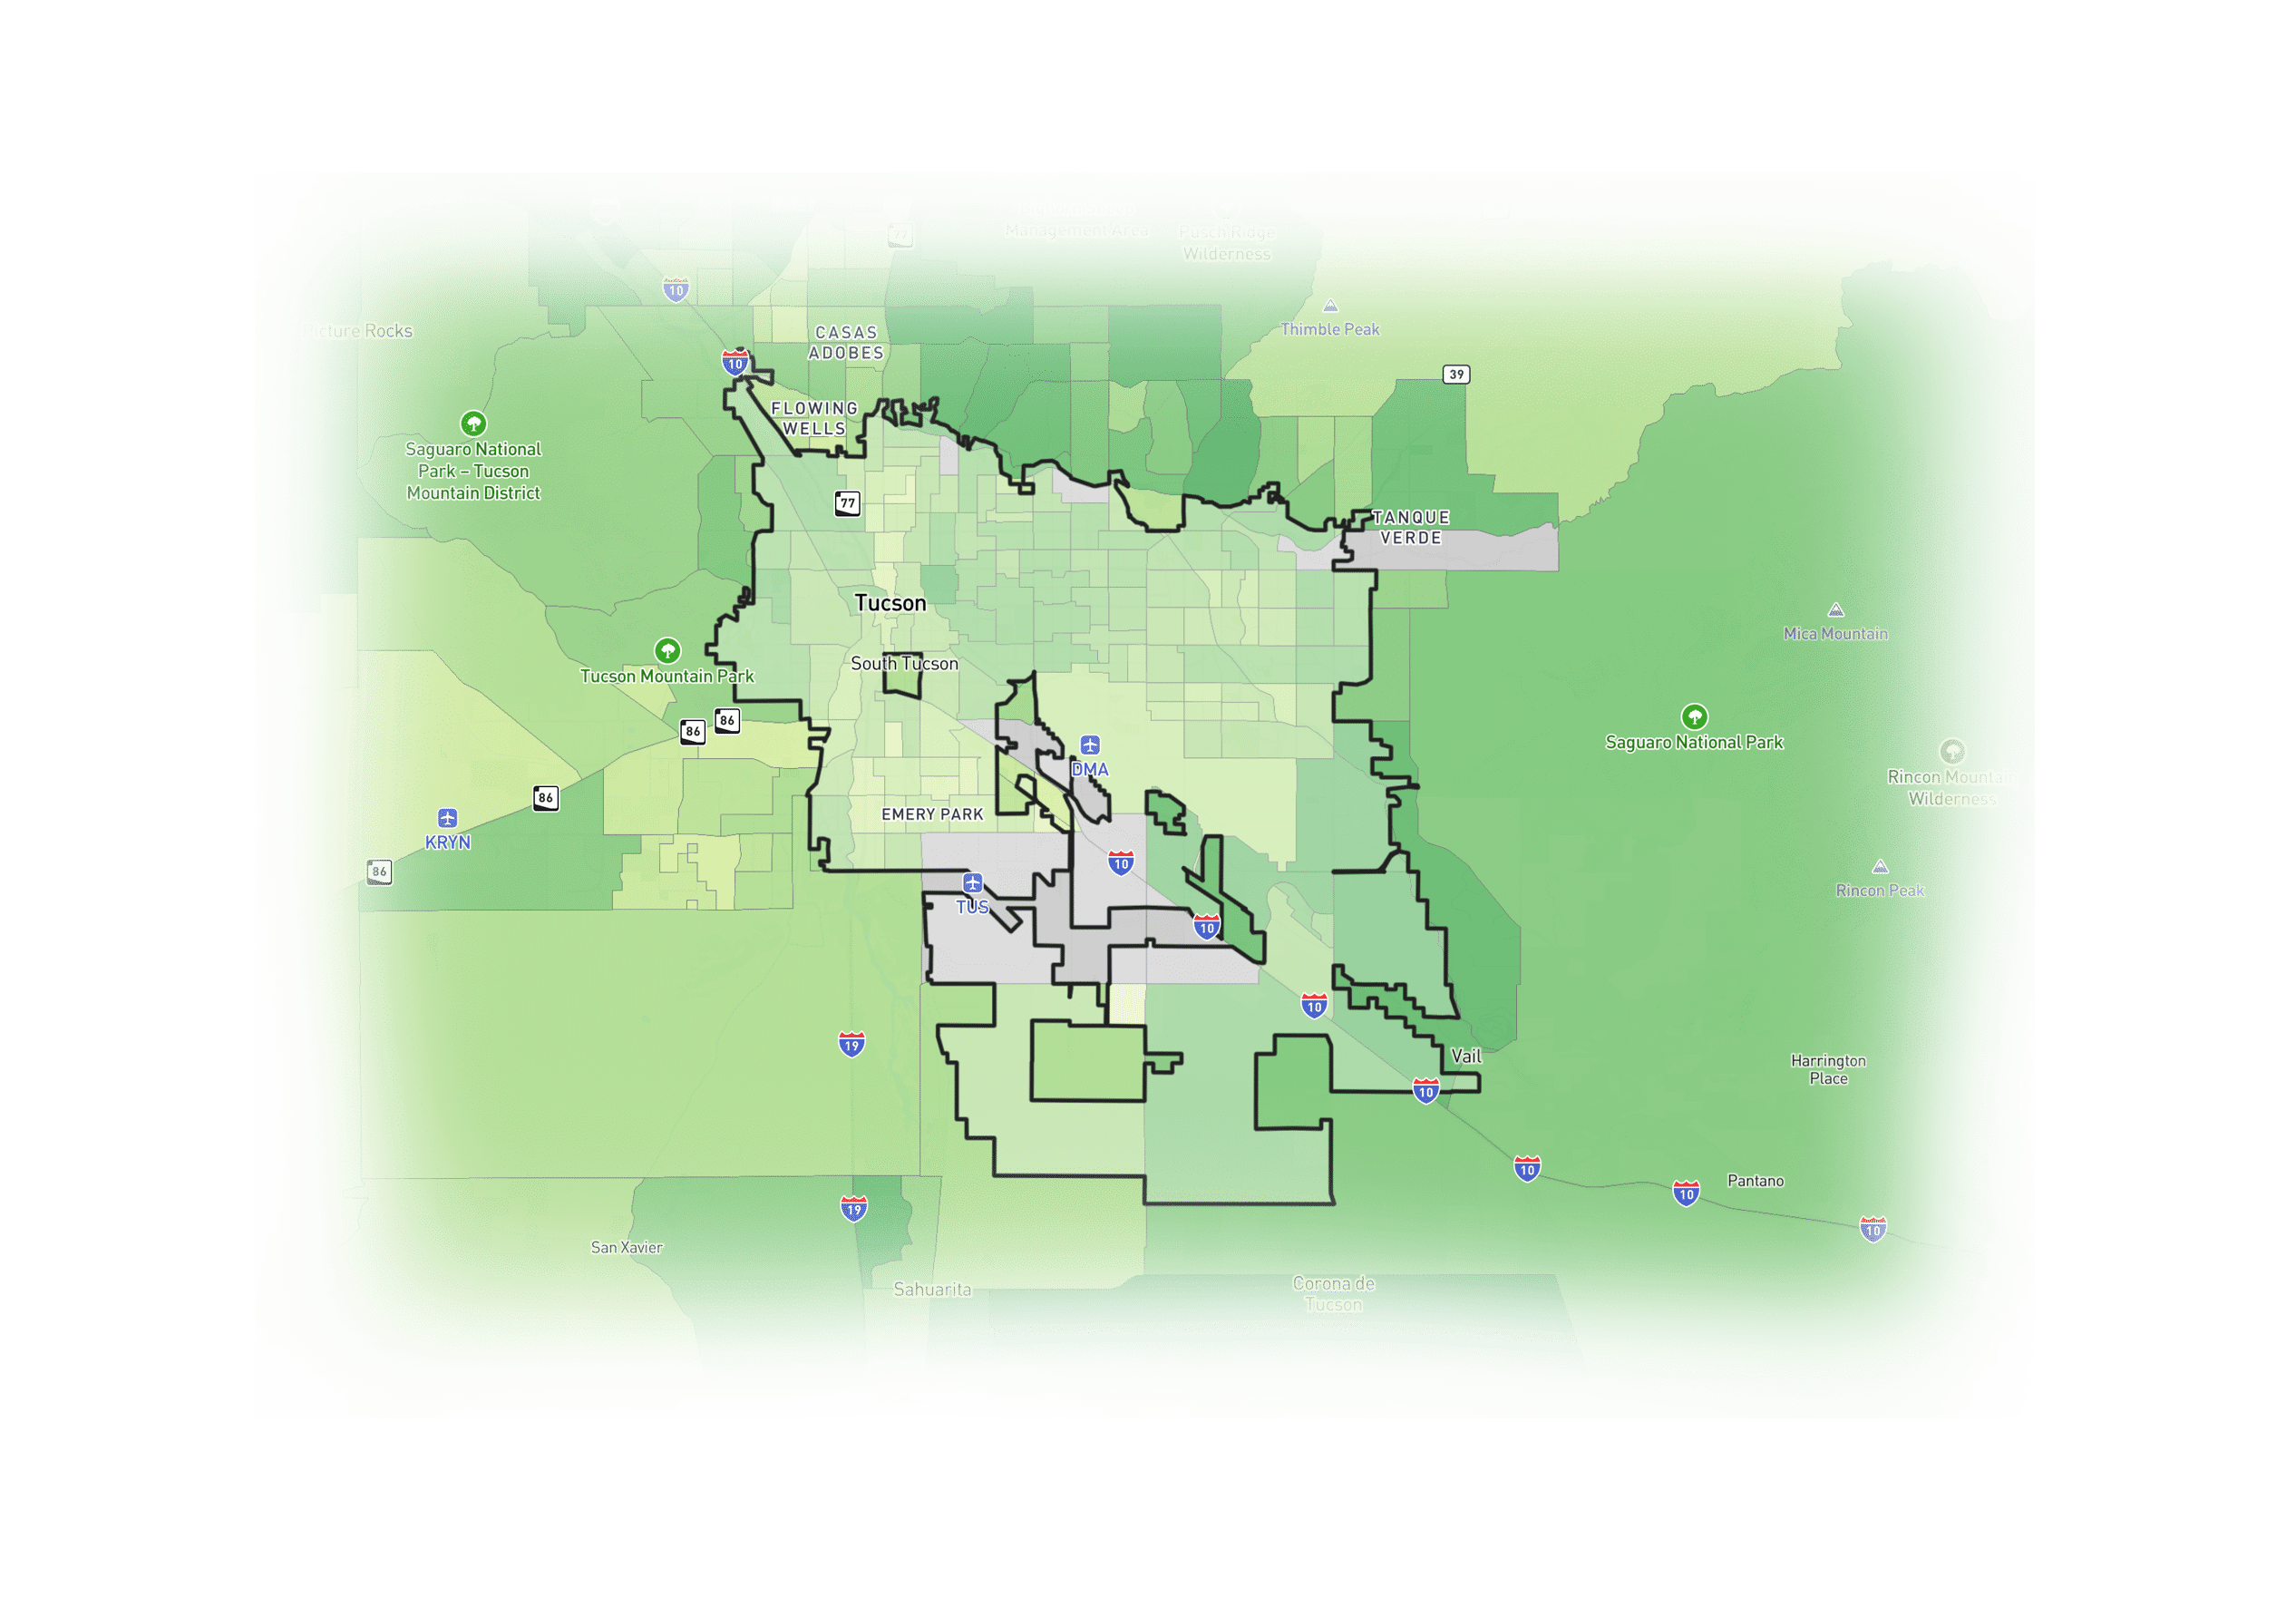
GridUp users can select utility service territories, metro areas, or other regions to see customized forecast results that are tailored to their specific use cases.
City and regional transportation officials can use GridUp to see what mix of charging types are likely to be needed each year so they can develop plans to support vehicle electrification with a robust charging network tailored to local needs, particularly in places where public charging is needed by drivers living in multifamily housing.
L2 = Level 2
Regulators, utility staff, and consumer advocates can download peak load forecasts for specific utility service territories as a benchmark for utility-developed projections or to provide insight when transportation electrification is a new focus area.
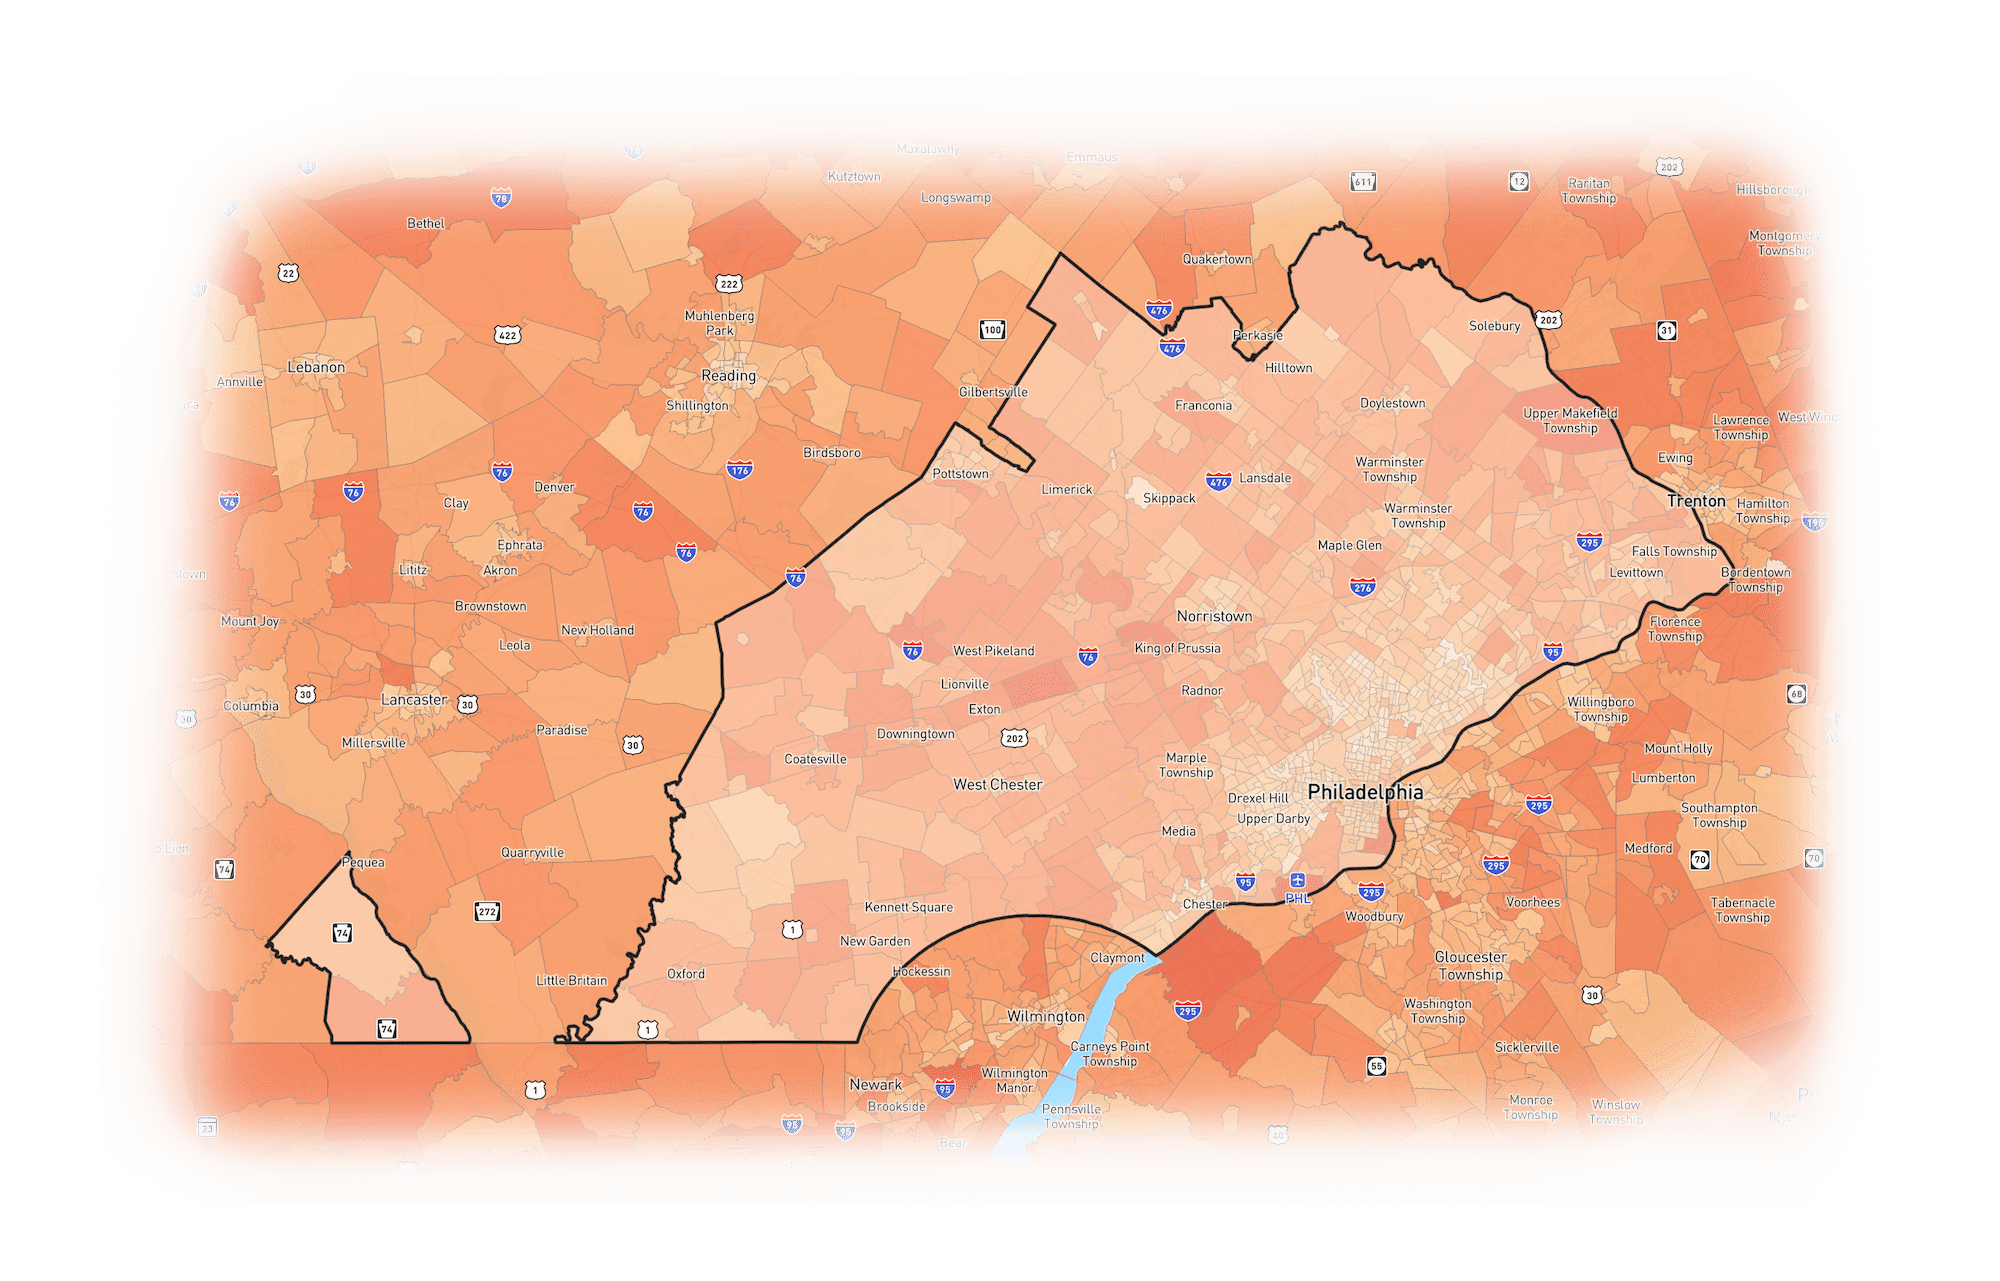
Users can account for different seasons to see how temperature affects vehicle efficiency and demand for energy.
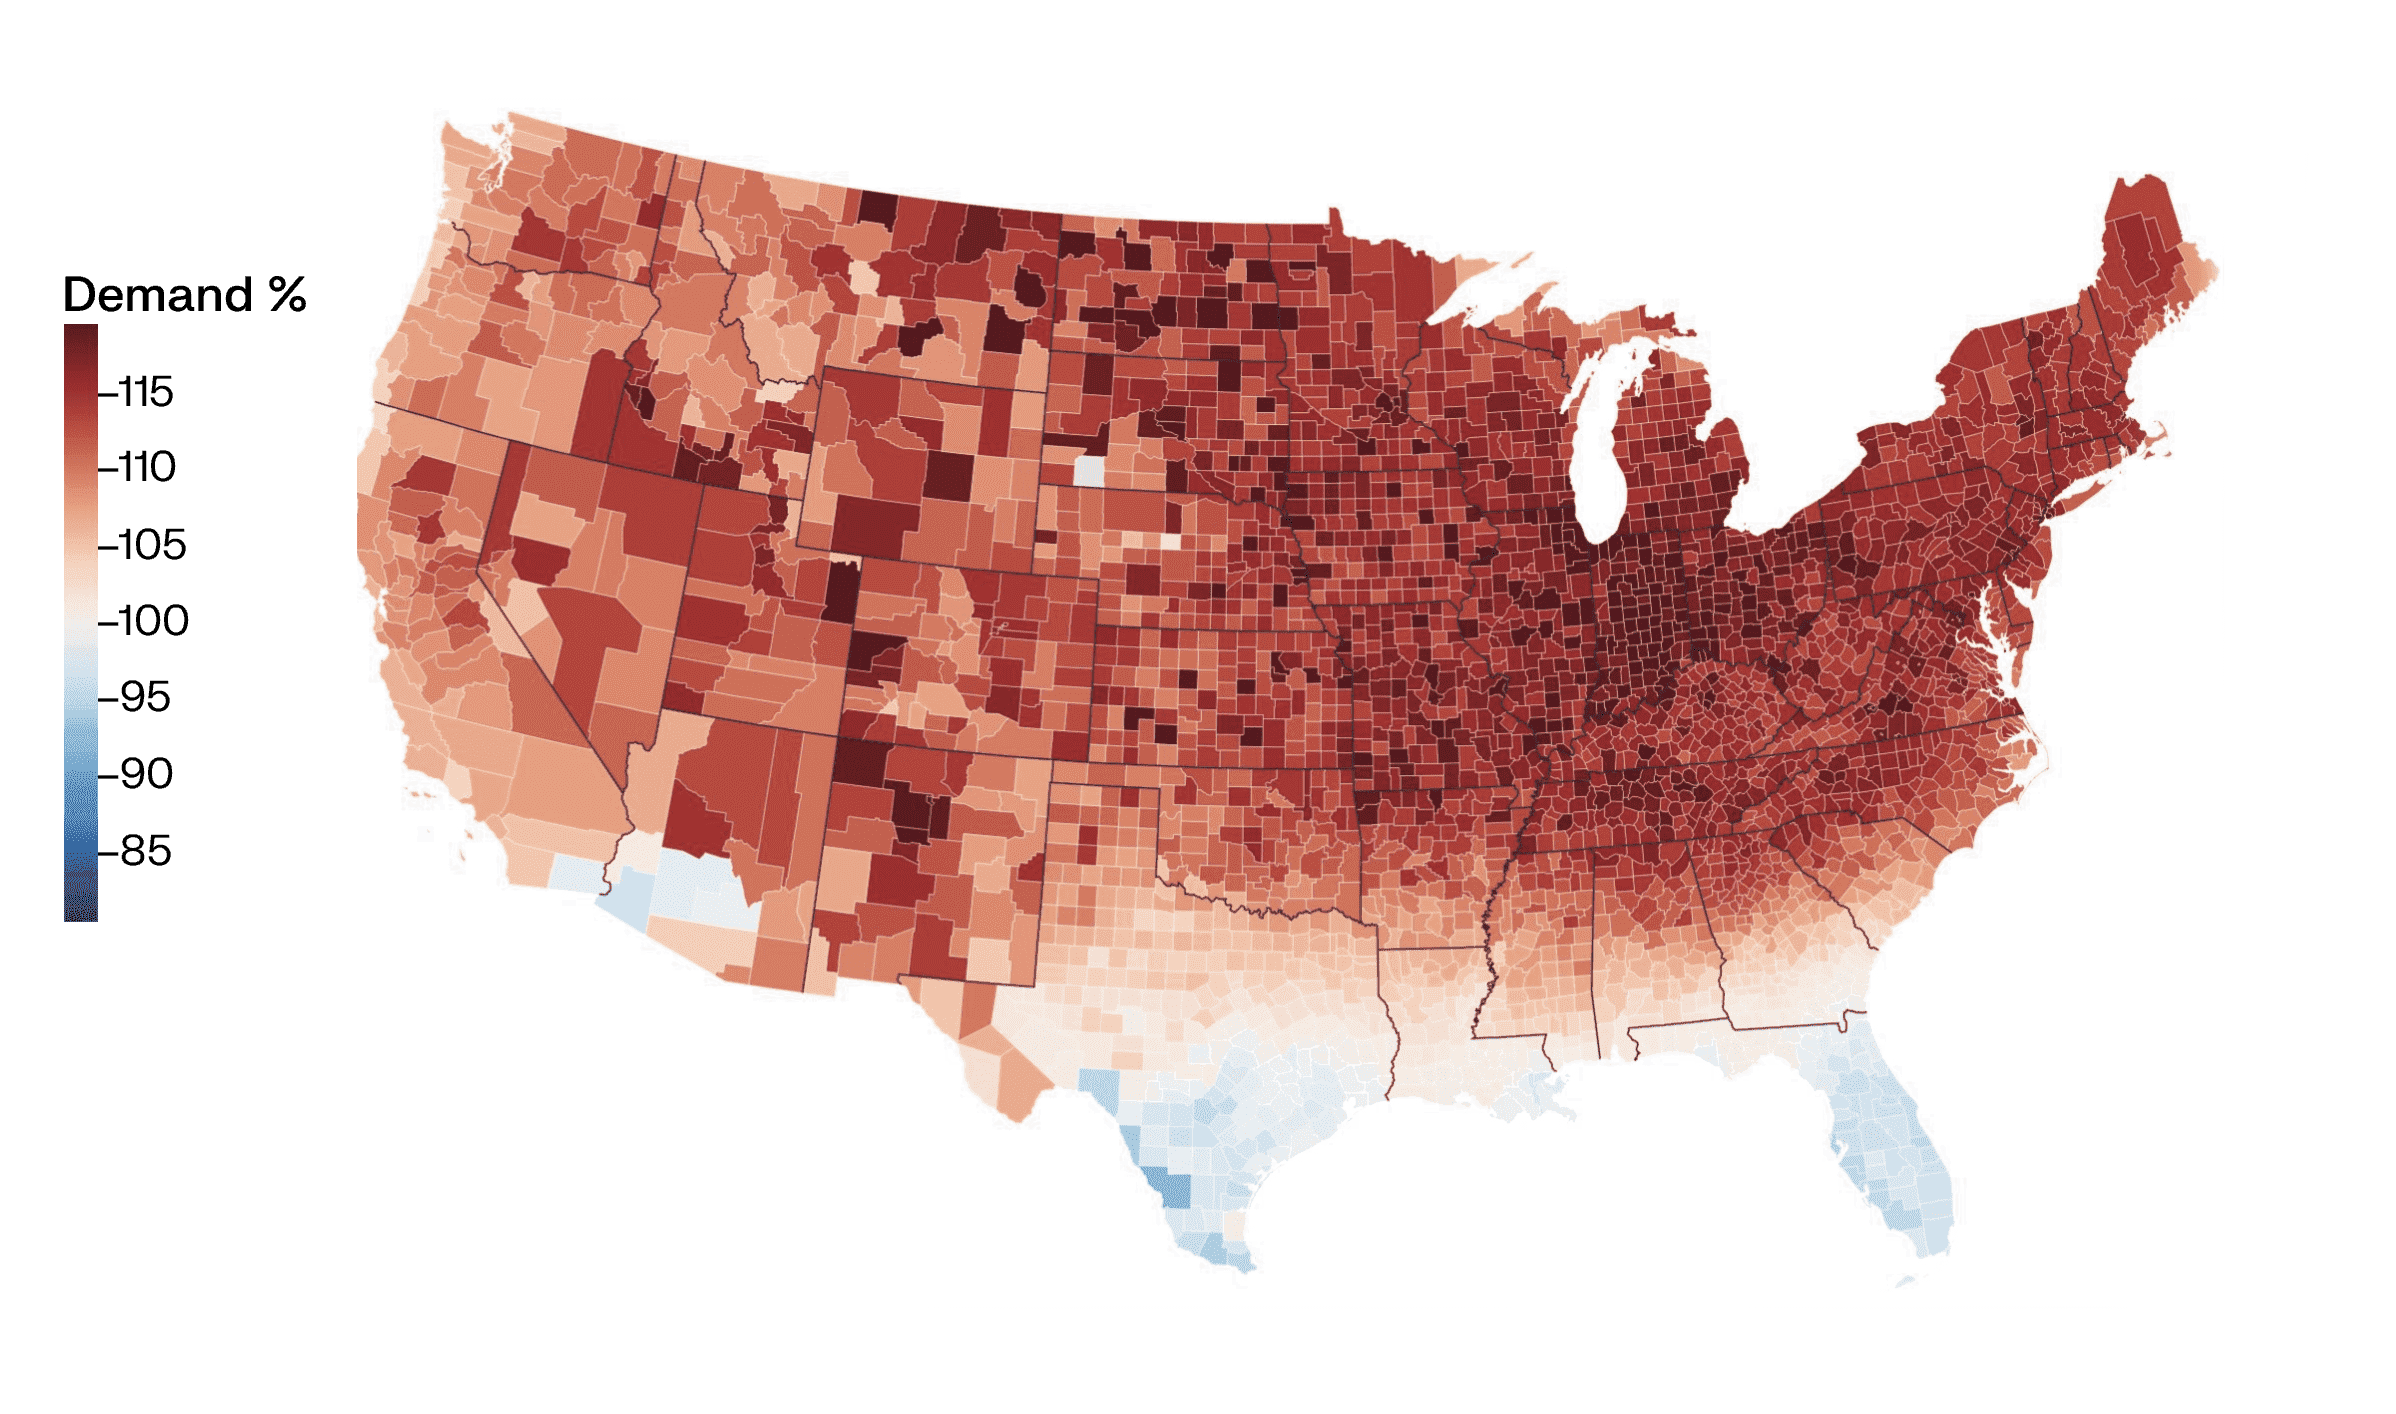
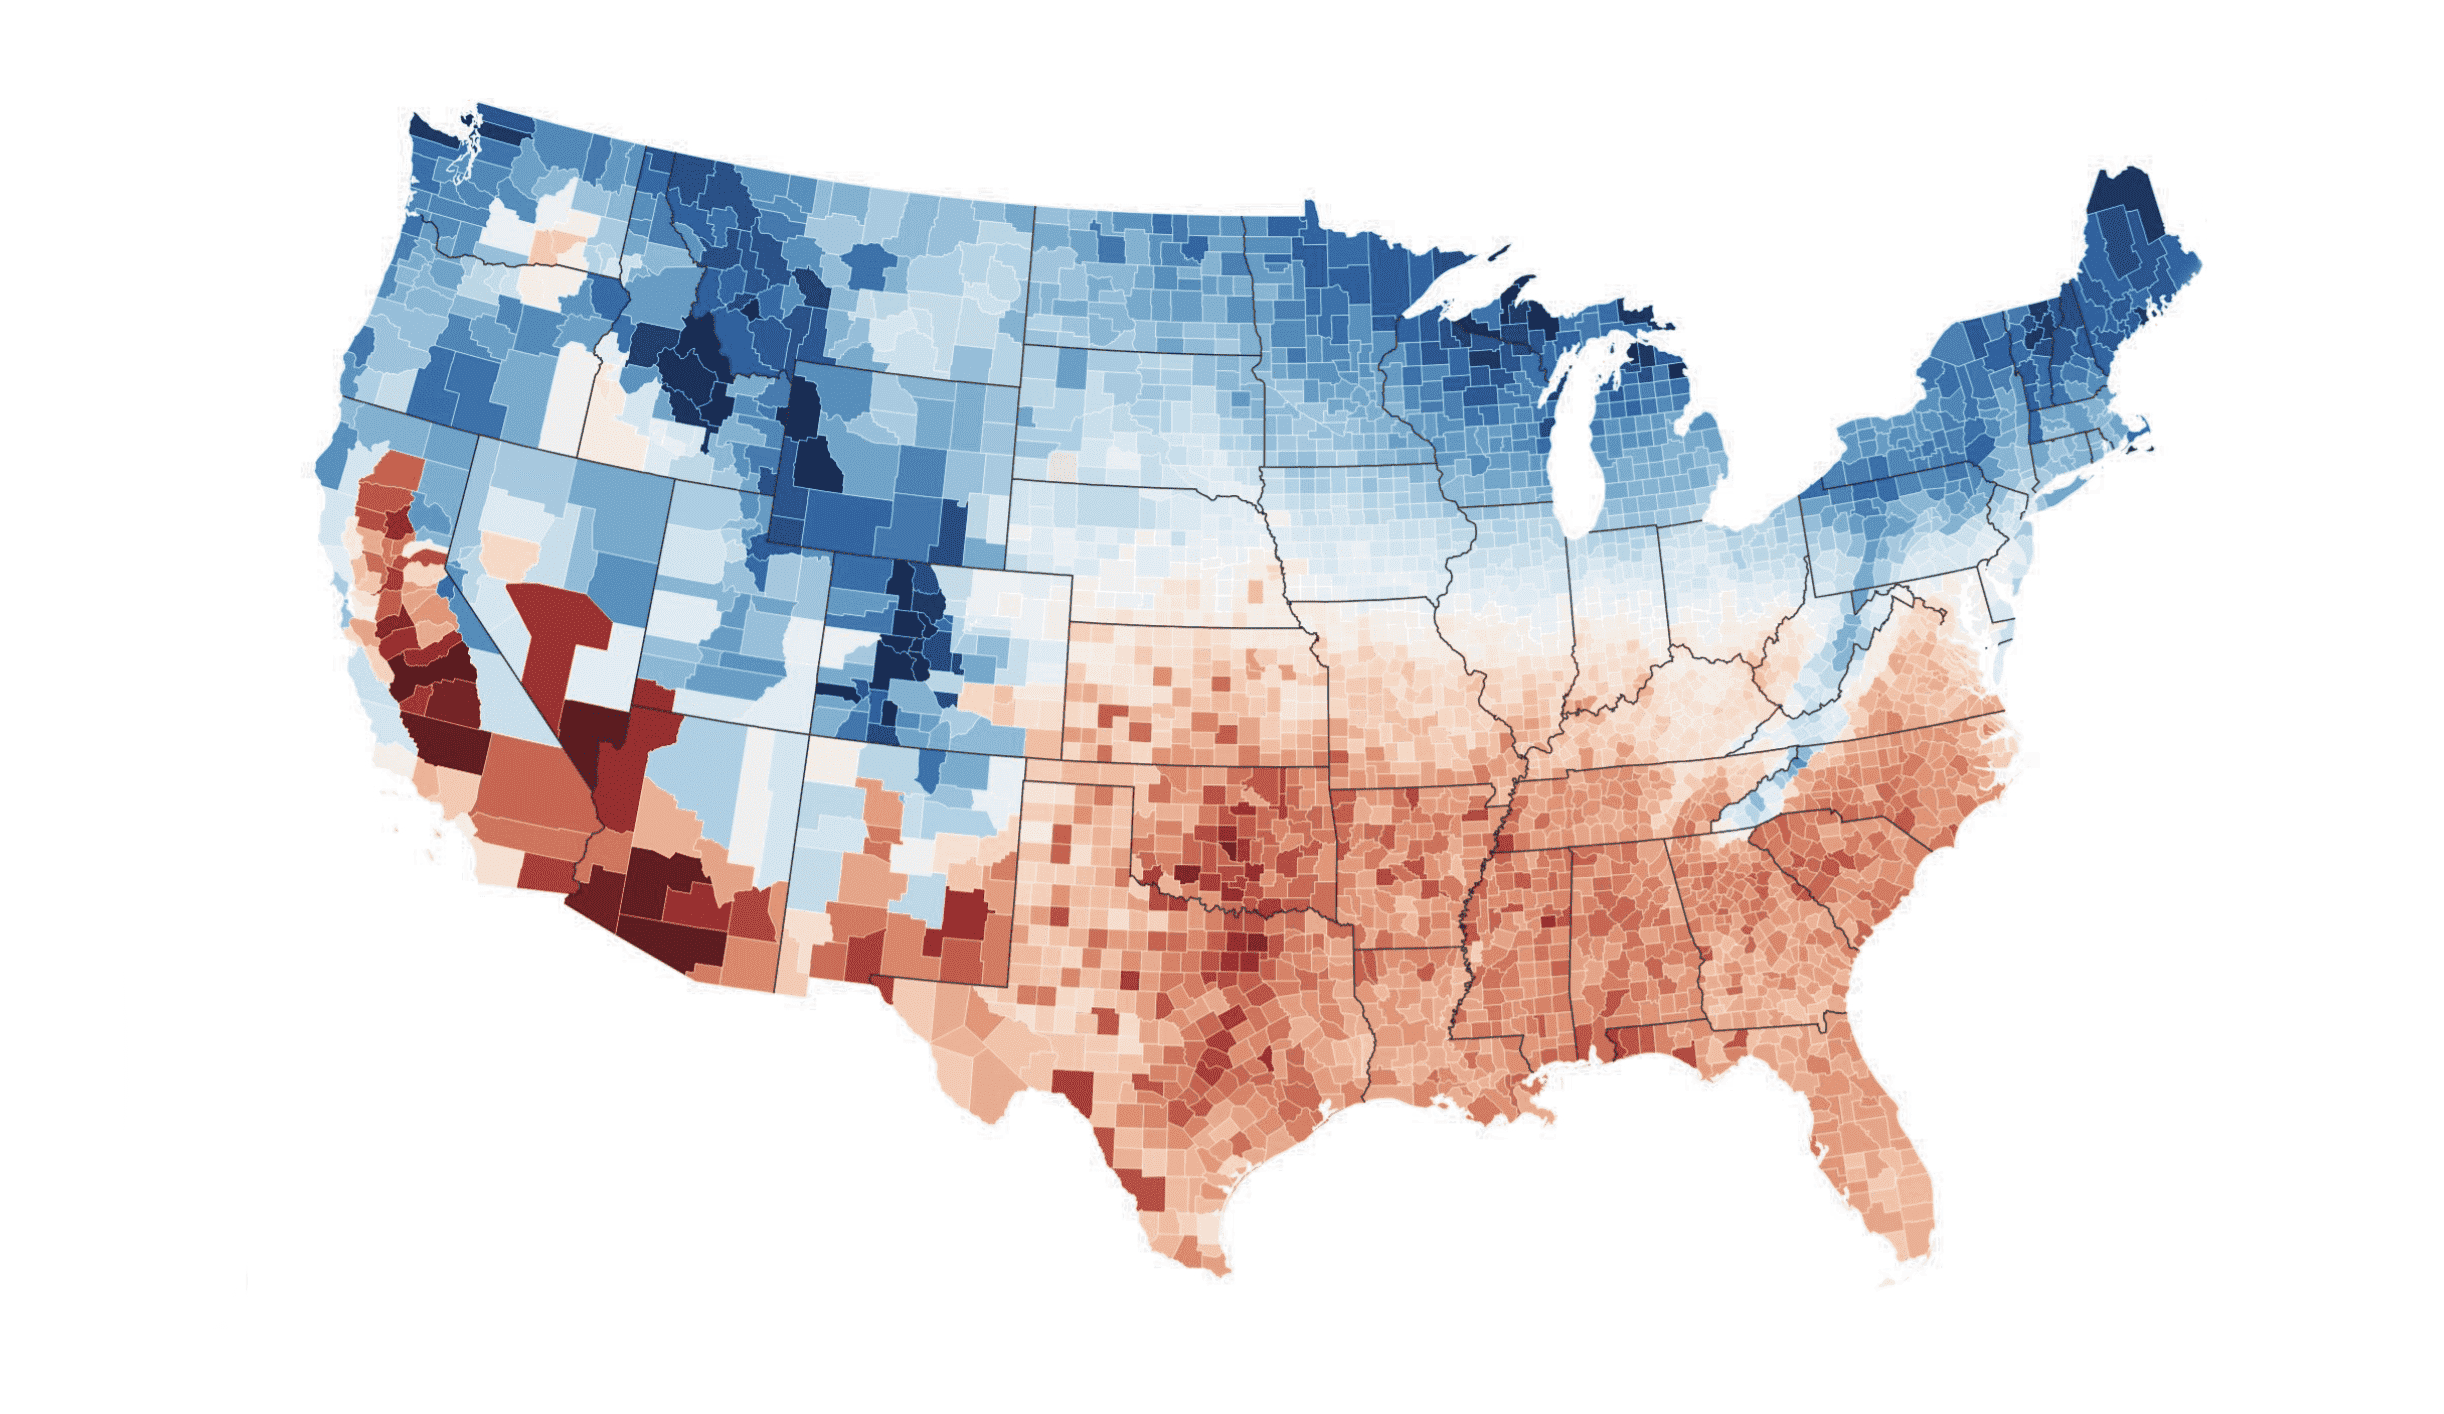
RMI can use GridUp data to help you
RMI also provides customized analysis using the GridUp model, such as helping to optimize the charging mix in a given area to meet specific goals (e.g., the lowest infrastructure cost or the least amount of charging time) or conducting detailed analysis of how estimated EV charging hot spots overlap with utility distribution system capacity.
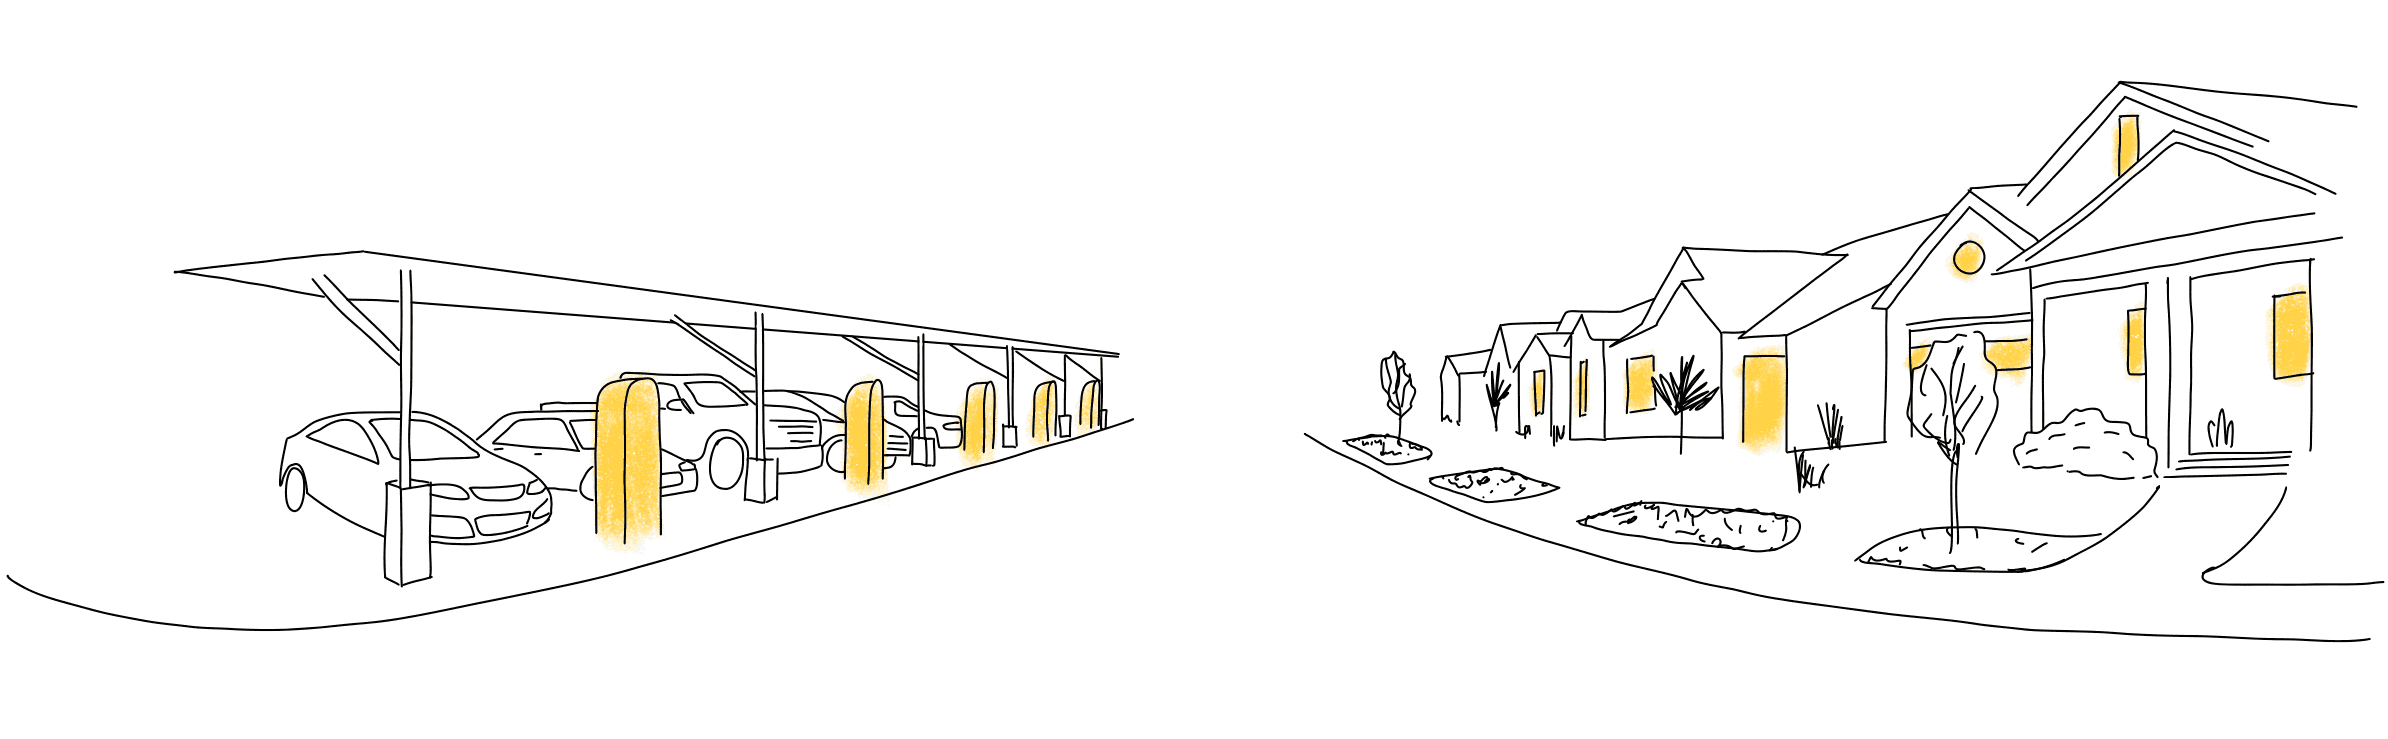
GridUp can help decision makers optimize the charging mix in a given area to meet specific goals.
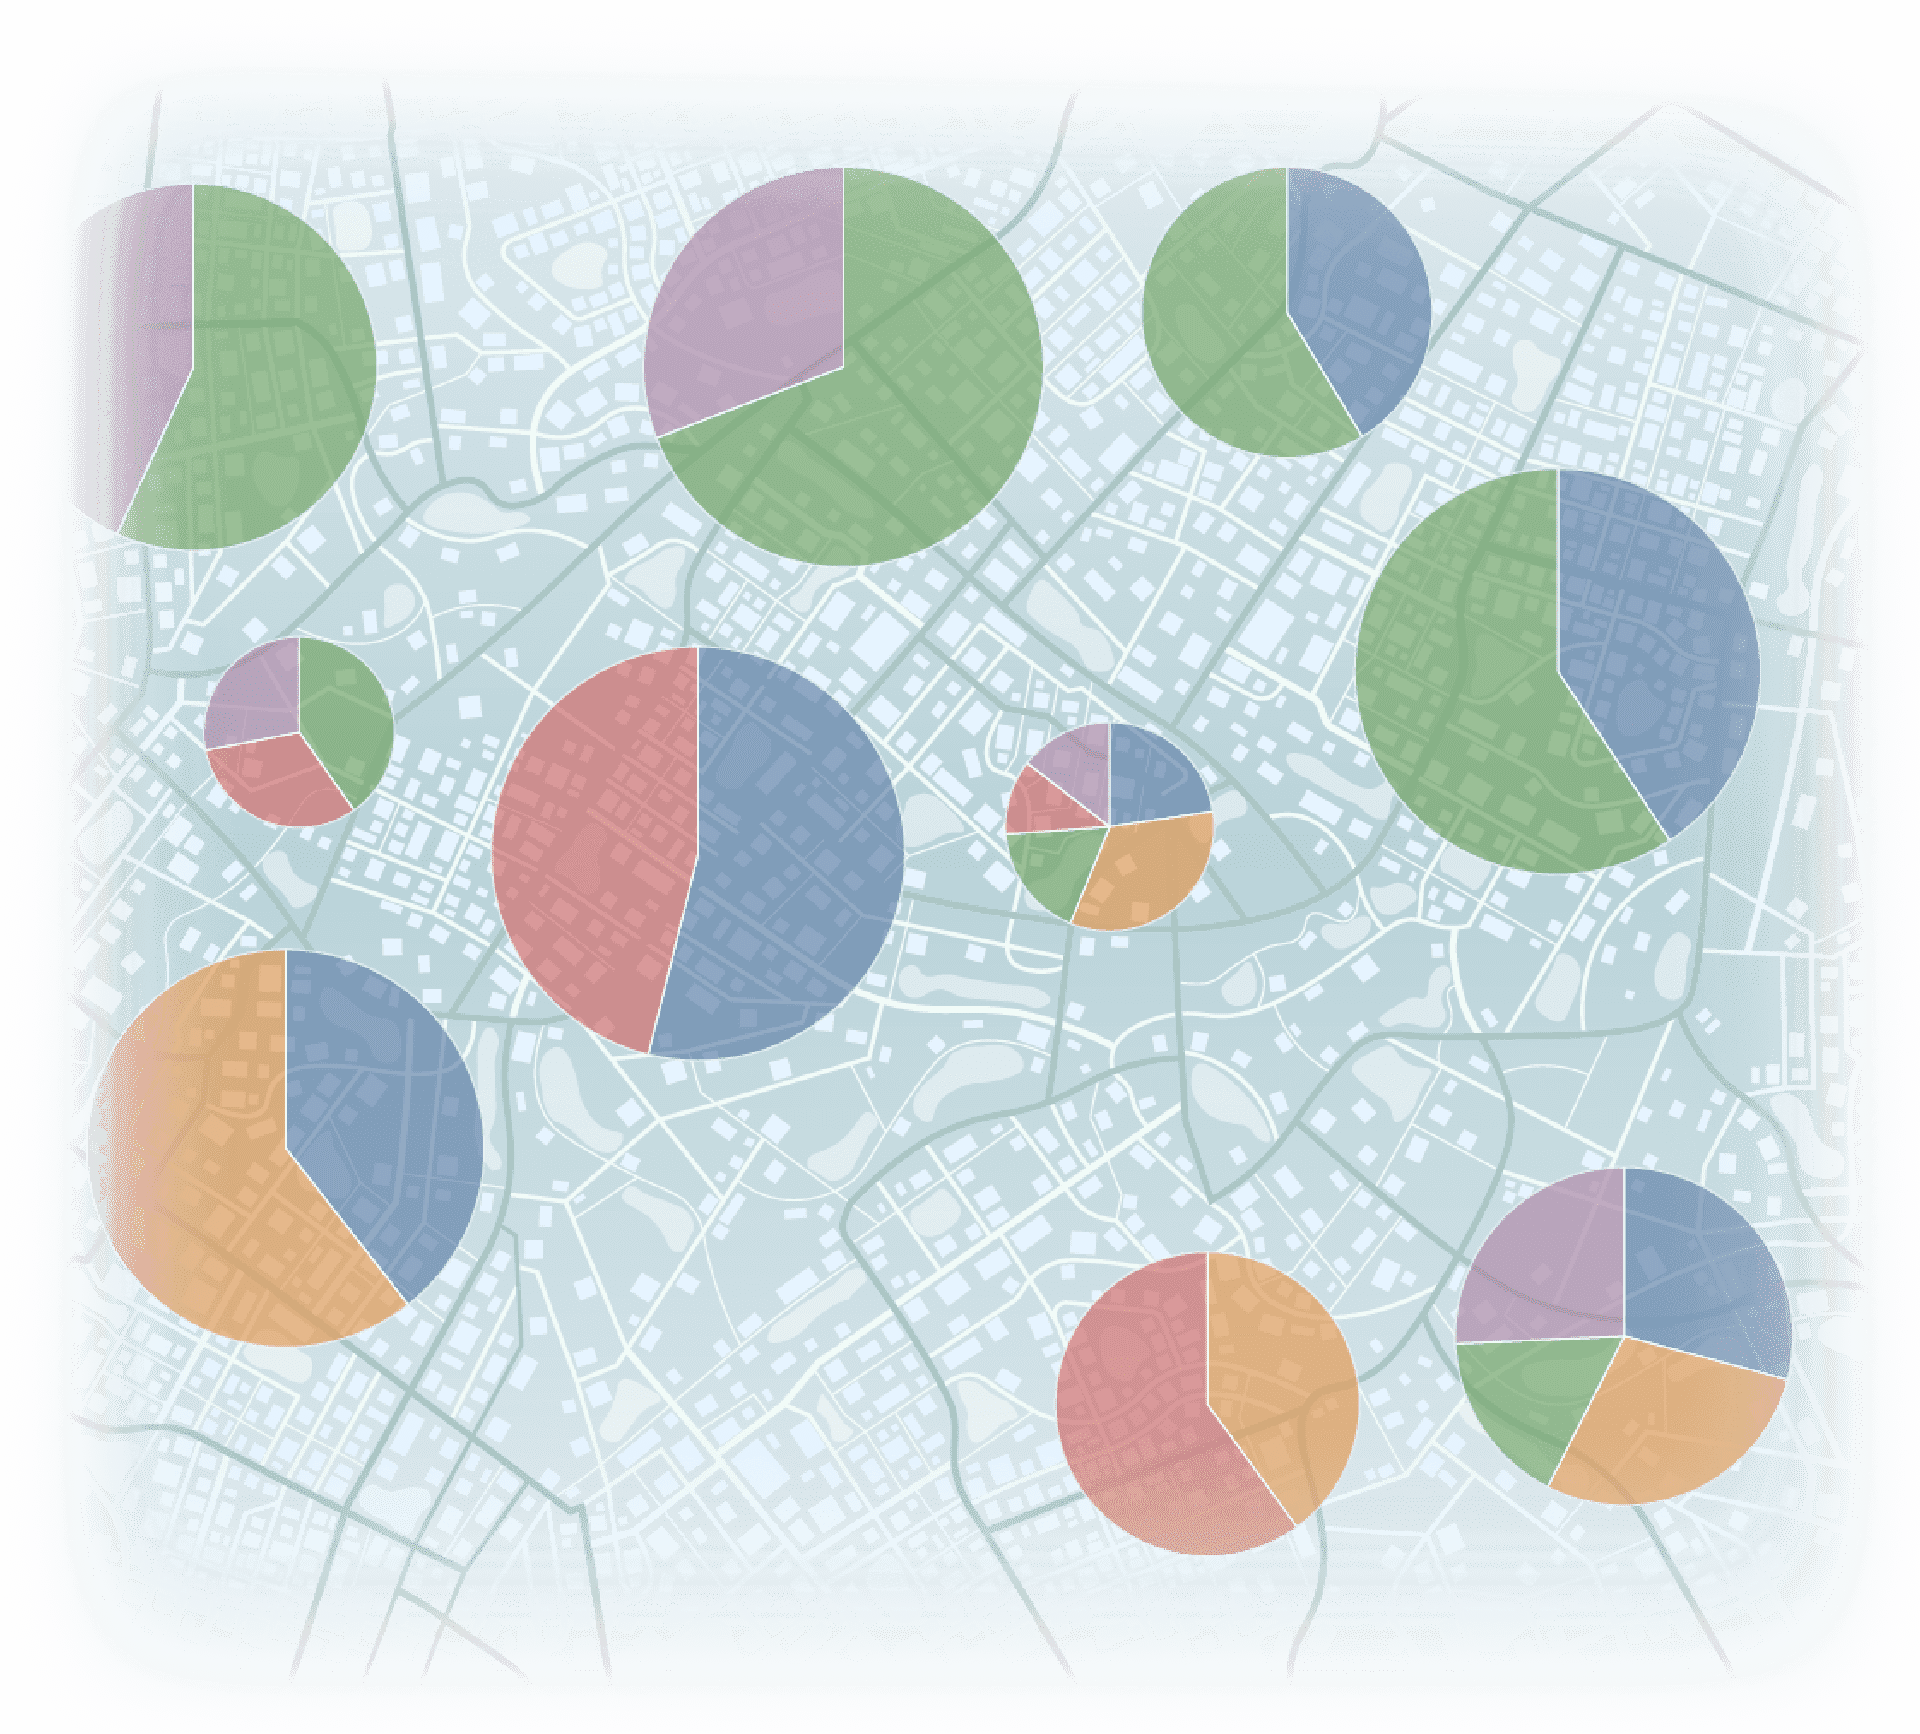
Charging type
- Single-Family Home
- Multifamily Home
- Office
- Public, Level 2
- Public, DC Fast Charging
Our team can also help explore how flexible charging of EVs can minimize peak power demand and related grid upgrades for specific utility infrastructure or entire service territories.
RMI can leverage the highly detailed vehicle information underlying GridUp to match our simulated EV charging sessions with individual pieces of grid equipment down to the feeder level. This detailed matching allows us to analyze when and where EV charging loads could exceed the capacity of the grid and require new investment. Anticipating these investment needs further in advance allows for proactive planning that improves grid reliability, reduces the risk of interconnection bottlenecks, and can provide long-term savings.
Case study: National Grid, Massachusetts
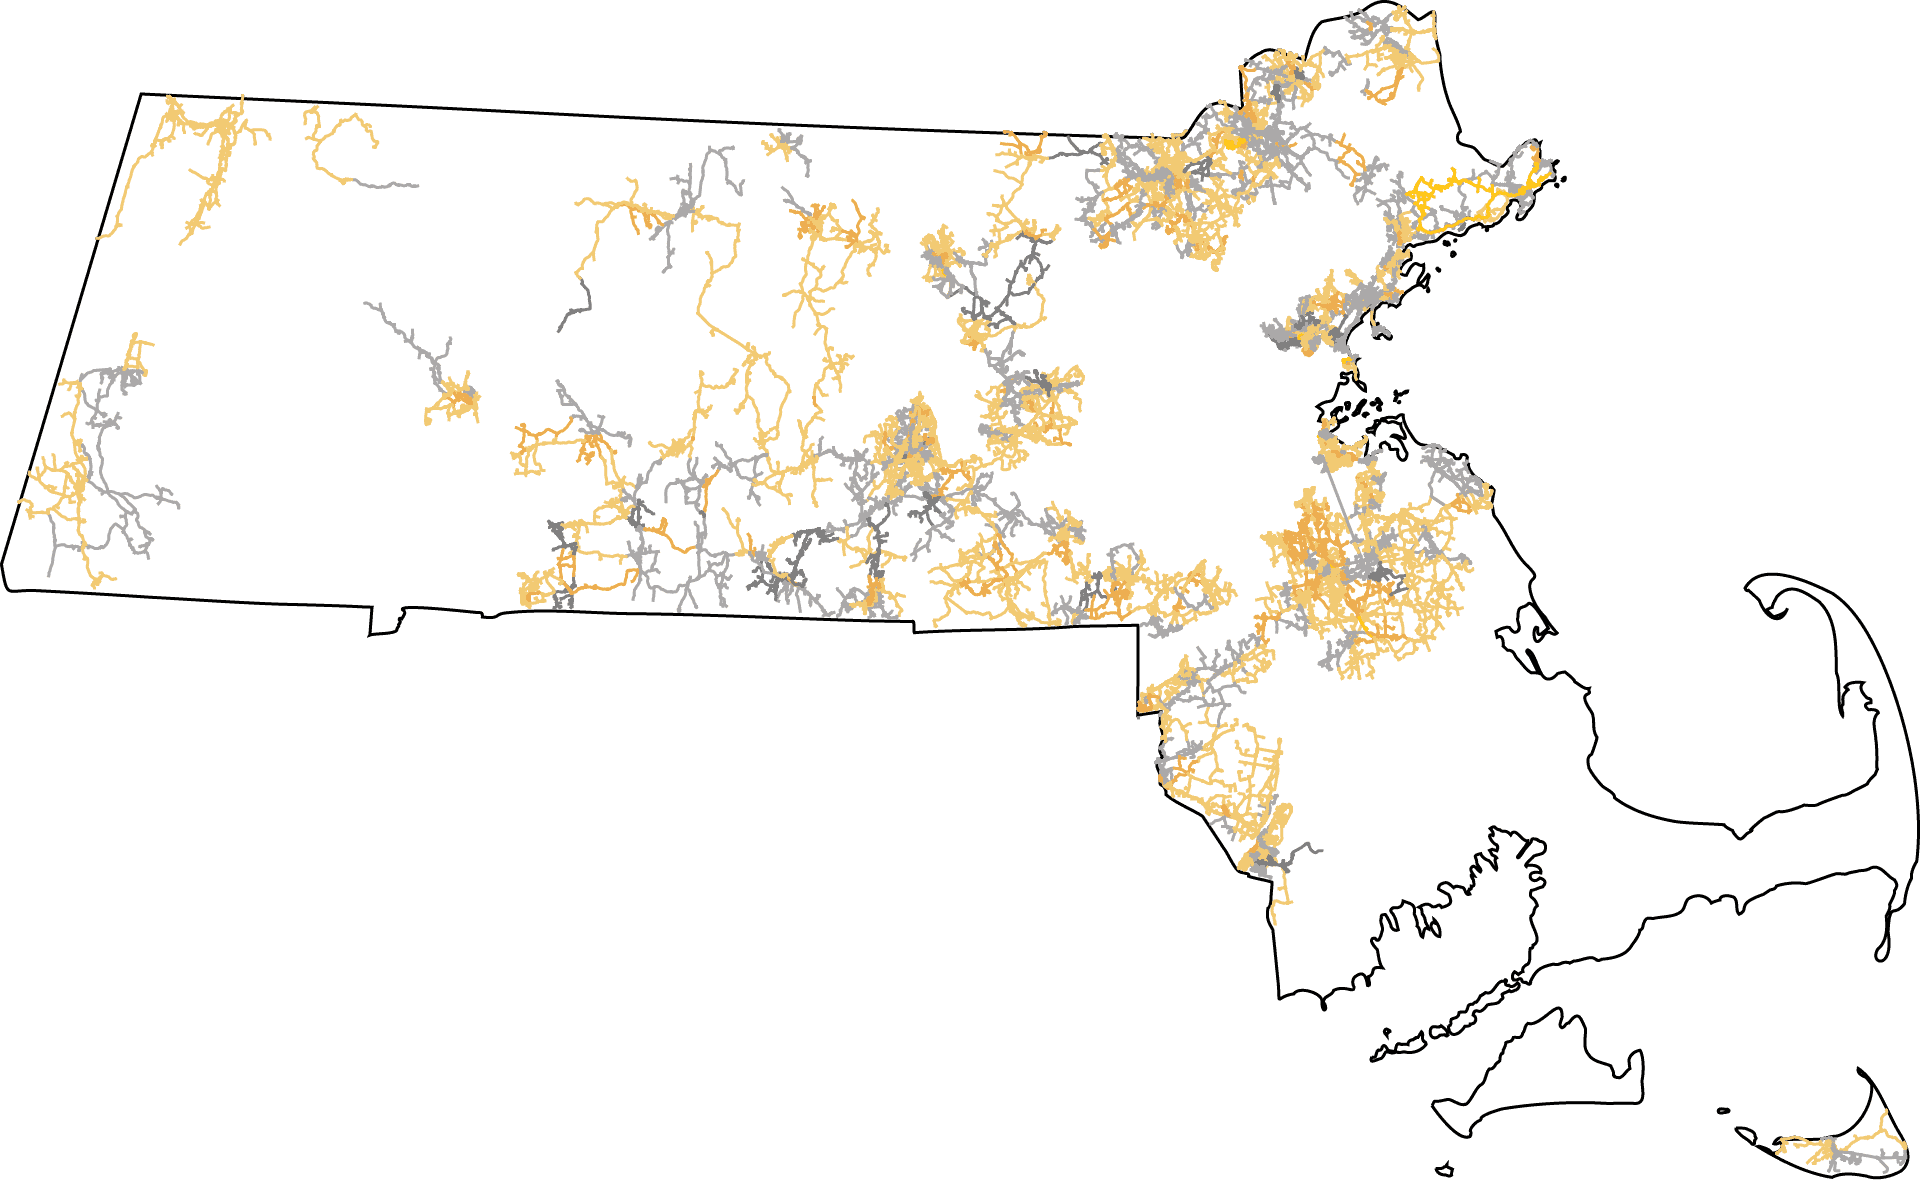
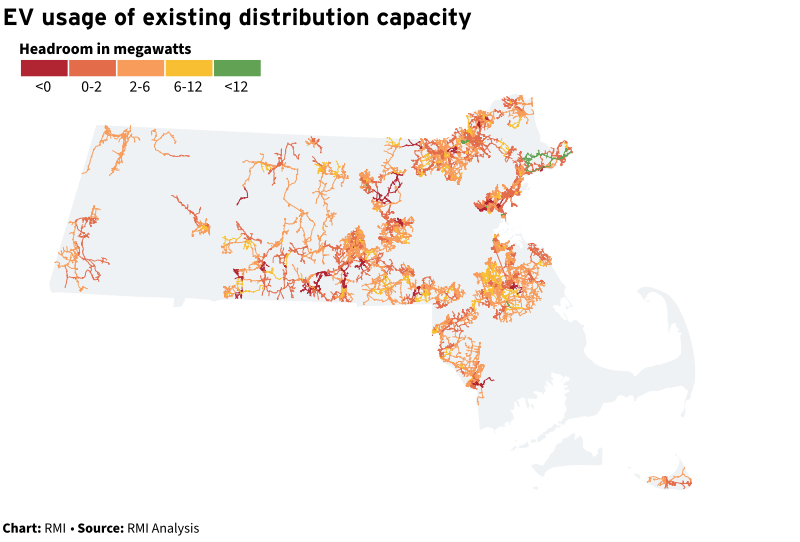
RMI used localized travel data from GridUp to model when and where future EV load may exceed available grid capacity on the equipment in National Grid’s Massachusetts service territory.
GridUp’s detailed, trip-based forecast creates charging load curves for very specific locations — the model can predict EV charging load for areas smaller than one square mile. These forecasts also contain details on the type of charger expected to deliver that power and show how charging load is expected to grow over time.
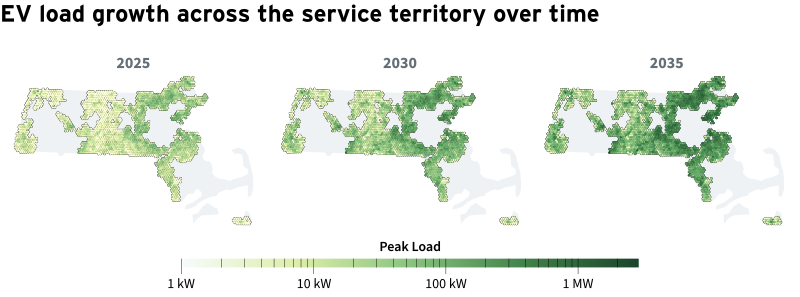
In the National Grid case study, our team used publicly available hosting capacity data, which we matched with GridUp's detailed forecasting, to estimate impacts on specific distribution grid assets.
This matchmaking allowed for EV load to be compared to the available capacity on each circuit. It highlighted that rapid load growth from EV charging will drive necessary upgrades in some locations.
Using GridUp in your work
Are you interested in how EV charging demand will evolve in your area? Do you want to better understand what types of charging are needed, and what the implications may be for the local distribution grid? Please try out the tool, and reach out to the GridUp team for more information.