Learn how we are working to transform how we use and produce energy.
The National Transmission Data We’ve Never Had (and Why We Desperately Need It)
The time is now for us to build a free, easily accessible national dataset on transmission investments.
Why we share this work for free
RMI is an independent nonprofit working to accelerate the clean energy transition. We publish research like this to inform decision-makers and drive real-world impact.
Our work is supported by philanthropy as well as partnerships, including fee-for-service engagements. This support makes it possible for us to share our independent insights for free.
If you find this work valuable, you can support it anytime.
Get more insights like this
Stay up to date with the latest research, analysis, and tools from RMI by opting in to receive occasional emails below. You’ll get new reports, event invitations, and practical insights to help us all accelerate the clean energy transition.
Loading form...
Your download should start automatically. If it doesn’t, click the download button below.
This work is made possible by philanthropy
RMI is a nonprofit supported by donors and partners. Philanthropy enables us to produce independent research and make resources like this freely available.
If you find this report valuable, please consider supporting our work. You can also explore how we partner with organizations to drive impact.
Jump to Section
The US spends $35 billion annually on electric transmission, up from $6 billion (inflation-adjusted) at the turn of the century. This comes at a time when cost pressure for electricity on everyday ratepayers is at an all-time high. But where is that money being spent? Imagine popping open a spreadsheet of data maintained by the federal government that is supposed to contain the explanation of how every dollar of that money is spent and finding rows upon rows of empty cells. How can you possibly draw conclusions from nothing?
That’s the reality facing utility regulators, ratepayer advocates, and other interested parties today: data on transmission in the United States isn’t there, or if it is, it’s highly incomplete or behind an expensive paywall. This makes it nearly impossible for independent entities to conduct thorough analyses of transmission construction and investment, something that is desperately needed as transmission costs nationwide continue to rise. Good transmission data, for instance, can help verify what types of transmission we are seeing investment in and whether investment is happening efficiently.
Why is our national transmission data of such poor quality? What can we do to make it better? In this brief, we address these questions in the hope that we as a nation can improve our transmission data quality to ensure that investments are being made in a wise and transparent fashion.
What are the sources of transmission data available today nationally?
There are several sources of transmission data available today, but each of them has key shortcomings that make detailed analysis difficult to impossible.
On the federal level, the Energy Information Administration (EIA) does not collect any information on transmission lines, although it does collect comprehensive data on electricity generation through sources like EIA-860M. Instead, the only up-to-date database comes from the Federal Energy Regulatory Commission (FERC), which collects transmission data annually through Form 1 on Schedules 422 and 424.[1]
FERC asks major utilities to report technical information — such as length, voltage, and conductor type — for all transmission lines that they own at or above 132 kV. However, FERC data is not comprehensive of all transmission lines because only “major” utilities are required to file under the Federal Power Act, which excludes non-FERC jurisdictional entities, namely federal power marketing administrations like the Bonneville Power Administration, Western Area Power Administration, and Tennessee Valley Authority, which collectively own approximately 7% of the high-voltage circuit miles of transmission in the United States today.[2] Additionally, the 132 kV threshold excludes a significant amount of lower-voltage transmission investment (up to 25% based on the most recent FERC summary of third-party data).
In addition, the raw data can be difficult to work with, for a few reasons.
- Lines are distinguished based only by the qualitative names of their start and end points, which can change over time.
- Errors are common enough to shift national and regional totals but difficult to troubleshoot.
- Without a unique identifier, it’s extremely difficult to match information reported on lines in Form 1 to other regional databases.
- Utilities may not report complete information for all lines, especially on cost. Because FERC does not require full completion, 78% of capital expenditure cost information is blank or zero (see Exhibit below).
And yet because our federal transmission data is so piecemeal, FERC itself does not use its own transmission data in its reports. In its latest State of the Markets report, FERC used Yes Energy transmission data rather than Form 1 data. The Department of Energy in its latest National Transmission Needs Study also used Yes Energy data rather than FERC data. Yes Energy data is behind a paywall and inaccessible to the general public, making it difficult for stakeholders to replicate FERC’s findings.
FERC also collects detailed technical data on transmission modeling input files from grid operators via FERC Form No. 715 for all integrated transmission system facilities rated 100 kV and higher, but this data is considered Critical Energy Infrastructure Information (CEII) and is thus inaccessible without applying for special permissions. This data also does not include information on project cost, making it less relevant for analyses related to ratepayer affordability, which we and many other researchers are often focused on.
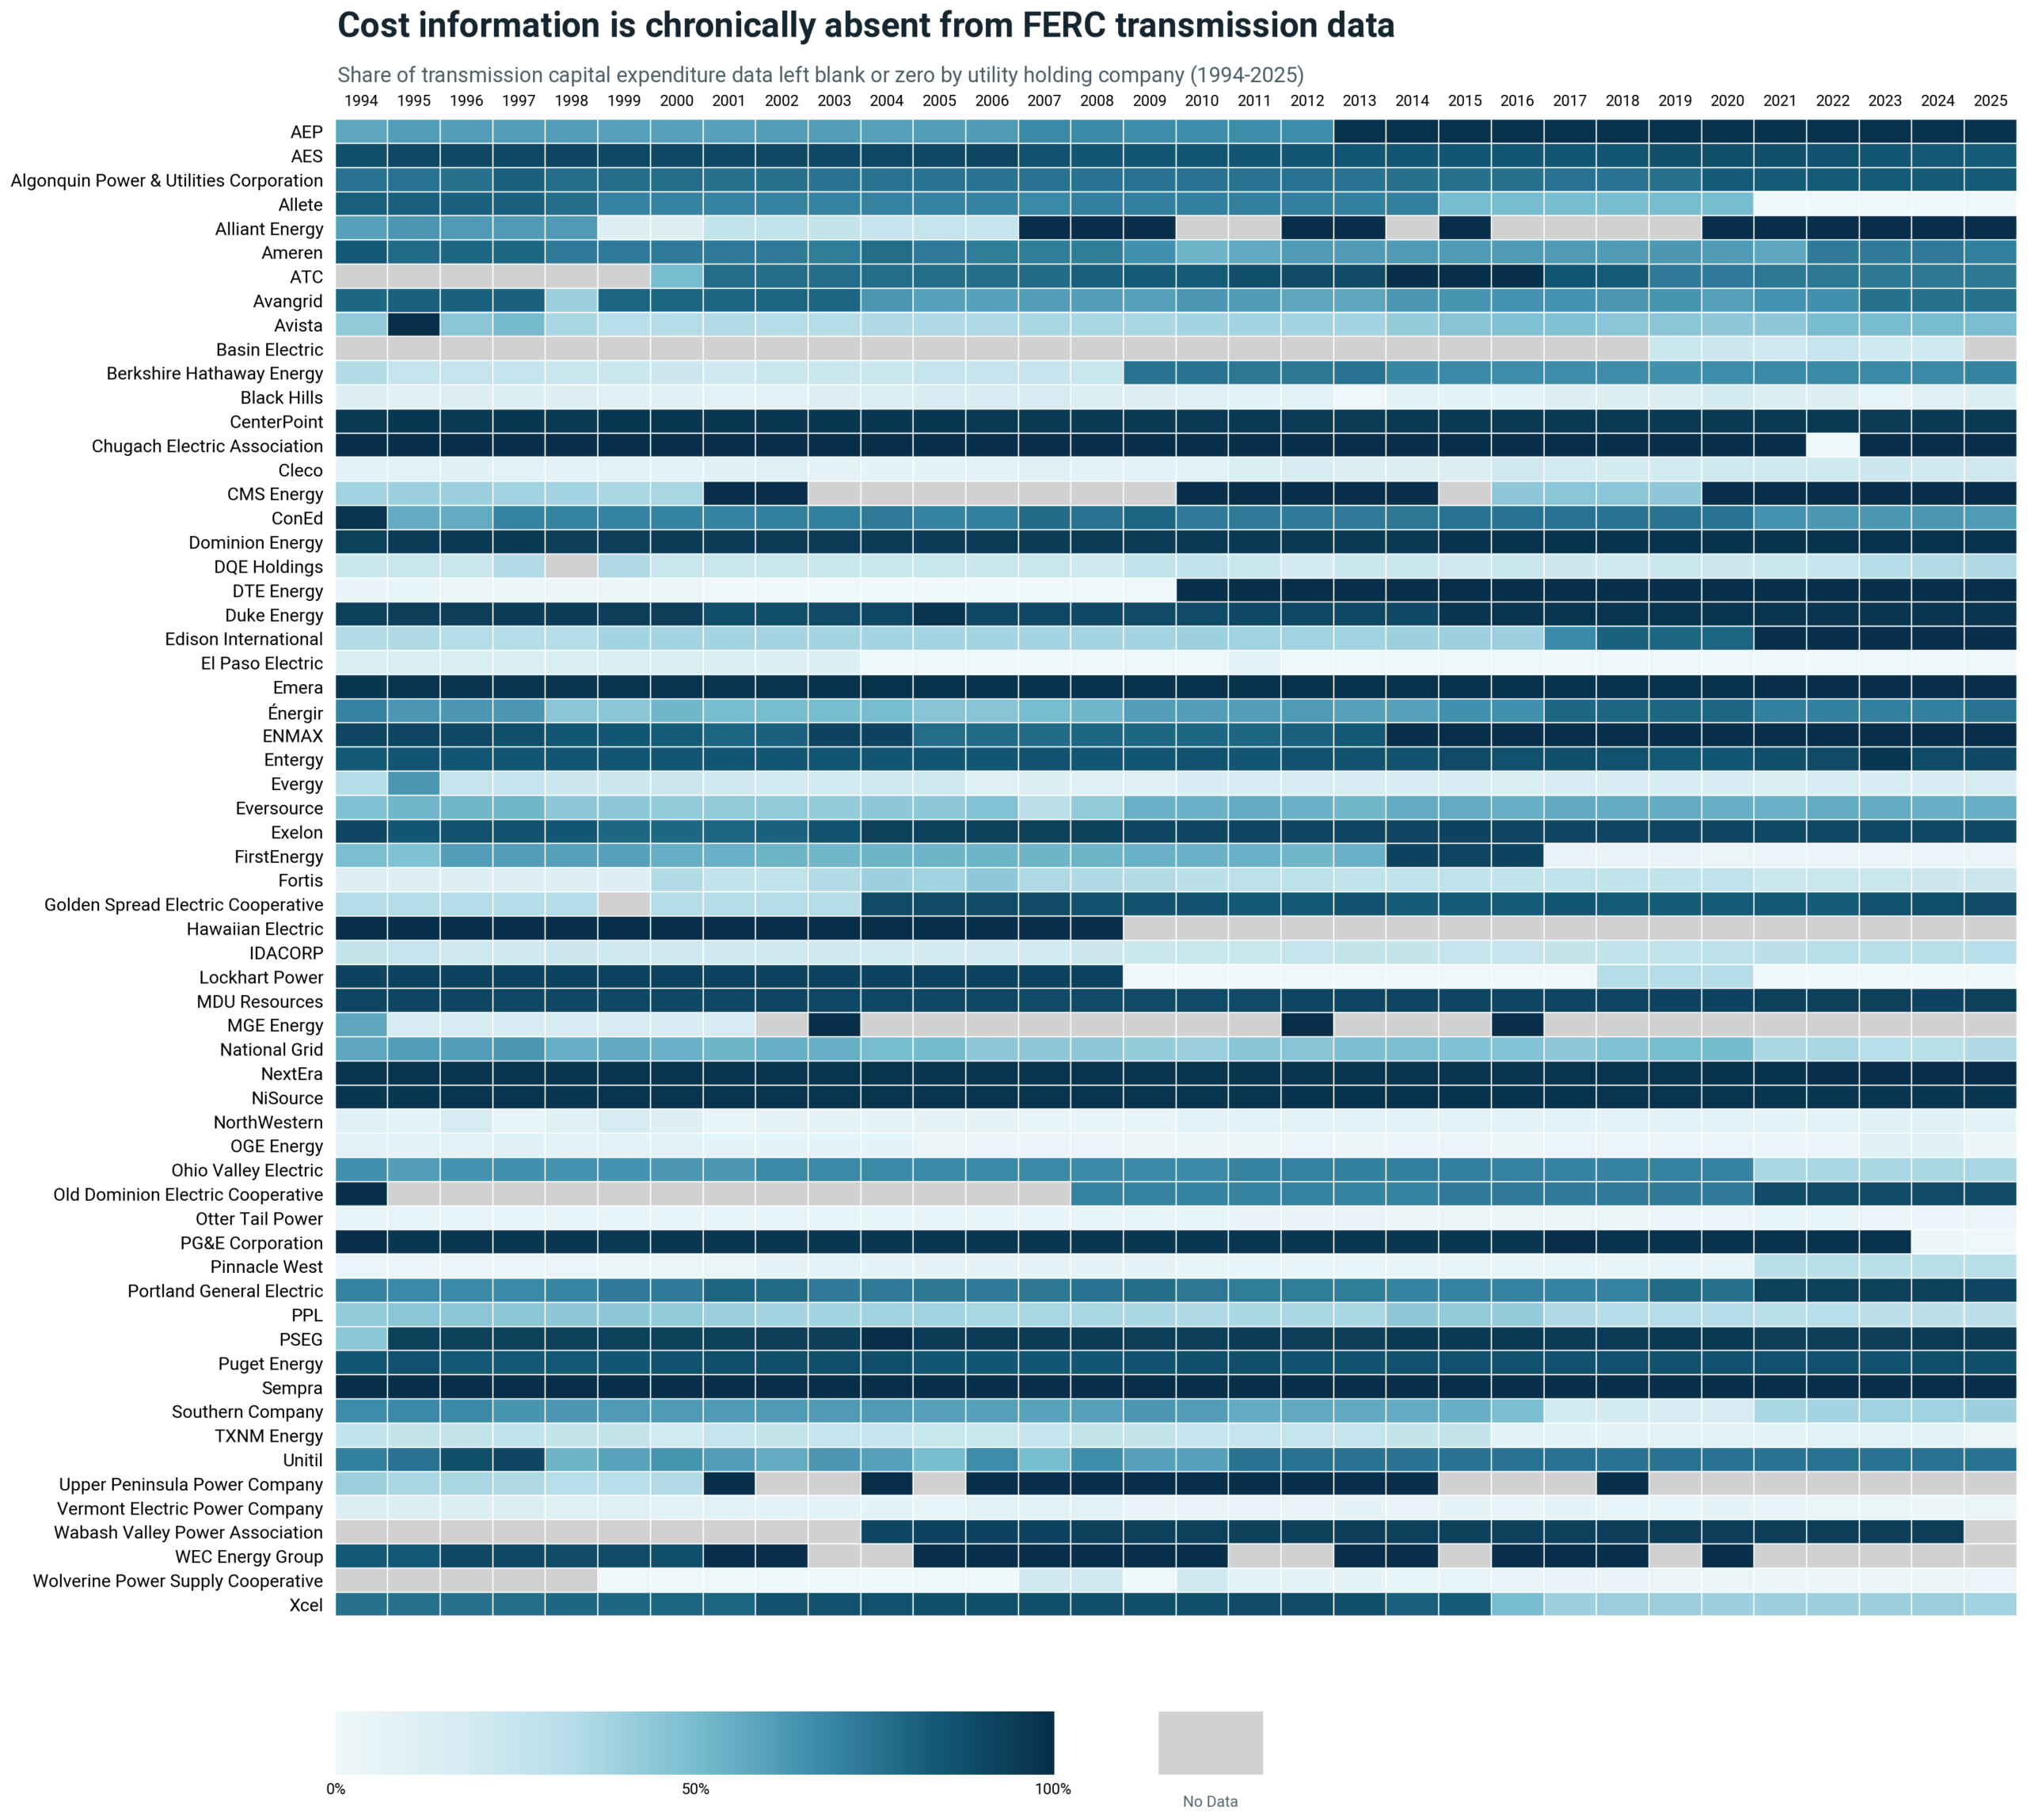
At the regional level, regional transmission organizations (RTOs) and independent system operators (ISOs) each have their own transmission databases (see the Appendix), which vary in terms of the quality of the data shared and frequency at which it is updated. For instance, PJM shares transmission data in its TC Planner tool, which is fairly comprehensive but lacks some useful information such as whether a project used incentives. In addition, based on RMI analysis of TC Planner data, the initial and final project cost data points are the same 75% of the time, raising the question of whether utilities are accurately reporting final costs.
The lack of standardization across RTOs/ISOs can make it difficult for experts to perform cross-regional analyses, which are essential for understanding how costs compare across regions and identifying best practices. And, in non-RTO/ISO regions, there may not be any comprehensive regional data available, only FERC data and utility-developed local transmission plans, which are forward-looking and do not capture investment trends and historical data.
How can we improve federal transmission data collection?
First, FERC can make material improvements to its Form 1 data collection process, including:
- Requiring all utilities to complete the form in its entirety upon submission (no blank cells allowed)
- Adding additional fields to Schedules 422 and 424 to provide additional depth to the data, including
- RTO/ISO project ID (if applicable)
- Original (proposed) and final in-service dates
- Original and final project cost (to identify if cost overruns occurred or if utilities were able to develop projects under budget)
- Whether the project is a new build or modification or rebuild of existing infrastructure
- Whether the project was open to a competitive solicitation and/or cost-benefit analysis
- Whether a project used incentives
- Geographic location (e.g., state[s] crossed).
Second, FERC could require all regional transmission planning entities (i.e., Order 1000 planning regions, including RTOs/ISOs where applicable) to share a standardized minimum set of transmission data publicly in accordance with FERC-established data-sharing standards. This would allow for regional flexibility while ensuring that key information is available at both the regional and utility levels. This regional data would supplement FERC Form 1 data with additional detail, including on project status and RTO-specific terminology and cost allocation mechanisms. The data should be made accessible in widely used/user friendly formats, such as Excel spreadsheets. FERC’s Office of Public Participation could then create a landing page on the FERC website with a link to each regional planning entity’s transmission database and a guide on how to access the data. Such standards could include:
- Original (proposed) and final in-service date
- RTO/ISO approval date (if applicable)
- Project ID, either RTO/ISO (if applicable) or utility (in non-RTO/ISO planning areas)
- Voltage level
- Application of grid-enhancing technologies
- Mileage (if a transmission line)
- Whether alternative transmission upgrades were evaluated, including the type of upgrade, estimated costs, and whether GETs were considered
- Original and final cost
- Project status (e.g., in-service, under construction, delayed, proposed)
- Whether the project is a new build or rebuild of existing infrastructure
- Whether the line was open to competitive solicitation (linking to the competitive window and full set of competing proposals if applicable)
- Whether the line was subject to a cost-benefit analysis (linking to the analysis if one was performed)
- Geographic location (state[s])
- Cost allocation by transmission owner zone
- Category of transmission project (each regional planner has different categories) with an associated legend
Third, and ideally, as a one-time measure, utilities should be required to go back and enter and verify as much of the historic data as possible that is currently missing from FERC Form 1 so that the public has a baseline to compare future investment against.
The result of these reforms: a robust national transmission database with more in-depth regional databases that collectively allow any entity to analyze transmission spend at the state, regional, and national levels. This can enable more transparency and proper tracking of transmission projects to ensure we are spending ratepayer dollars efficiently and appropriately.
Some questions that we could answer with this data include:
- At what voltage levels are we investing in the most today compared to 10 or 20 years ago? Is our investment trending toward lower or higher voltages?
- Context: RMI has done research on how we as a nation are increasingly investing in lower-voltage local transmission projects rather than higher-voltage regional projects. In doing this research, we have nevertheless struggled to adequately interrogate nationwide trends due to data inaccessibility.
- What percentage of projects are rebuilds of existing infrastructure versus new builds?
- Context: Related to the previous point, given rising spend on transmission, it would be useful to know how much spend is going toward rebuilding the existing grid compared to building out new infrastructure. This can help to determine whether costs are increasing due to the need to replace aging infrastructure or the need to build out new infrastructure.
- What percentage of transmission projects have been open to competitive solicitation?
- Context: In Order No. 1000 issued in 2011, FERC required competitive solicitation for transmission projects but left some exemptions in place for certain types of projects such as local transmission projects. Fifteen years later, how are we doing? How pervasive are competitive solicitations today?
- What percentage of transmission projects experience cost overruns, and by what amount? Are cost overruns more common with specific utilities or competitive vs non-competitive projects?
- Context: With ratepayer bills rising in part due to transmission spend, it would be good to be able to compare nationally how often cost overruns occur and whether they are more prevalent in certain regions.
- What percentage of projects experience delays in their construction (original proposed in-service date as compared to final in-service date) and by how much? Have delays been increasing in length?
- Context: Several utilities have anecdotally reported project delays due to challenges such as labor shortages, supply chain delays, inflation, siting, and other factors. Permitting reform to accelerate transmission construction timelines has also gotten much attention in recent years at the state and federal levels. It would be good to understand the trends behind delays to help inform potential solutions to accelerate construction.
- What percentage of projects are using rate incentives?
- Context: FERC first enabled rate incentives for transmission in Order No. 679, issued in 2006 after the Energy Policy Act of 2005 required FERC to examine transmission rate incentives. 20 years later, how widespread are these incentives, and is their usage aligned with their original intent?
With transmission spending rising and ratepayers rightly focused on affordability, the first step that our policymakers and regulators should demand of utilities is transparency.
Appendix: Regional Transmission Datasets
| RTO/ISO | Data Source(s) |
| PJM | TC Planner contains a downloadable database for all PJM transmission projects. It requires a user login and includes all projects proposed from 2005 until present.Some data fields are not present in TC Planner (voltage level, original/proposed in-service date, state) but are available on the “Project Status & Cost Allocation” webpage. The two databases can then be merged by project ID. We are unclear as to why there are two separate databases, as it would be easier if they were combined. |
| MISO | MISO transmission data is accessible on the MISO Help Center with a user login. It is split between two pages, MTEP Projects and Project Facilities. These two databases can be merged by project ID. |
| SPP | SPP posts zip files containing Appendix 1 Excel files for each year’s Transmission Expansion Plan on the SPP Documents & Filings webpage (under Engineering & Planning > Transmission Planning > SPP Transmission Expansion Plan). Users must manually copy and paste each year’s Excel file data together to create one multi-year database, which is not ideal. |
| ERCOT | ERCOT posts a single spreadsheet of proposed transmission projects through its Transmission Project and Information Tracking (TPIT) report. The file includes the status, cost, and expected in-service date of planned transmission projects 60 kV and above, including projects initiated by transmission service providers. ERCOT does not appear to post data on existing transmission publicly. ERCOT also provides an archive of TPIT reports. While this archive could in theory be used to create a more complete database of in-service and proposed transmission projects in ERCOT, in practice this would require significant manual labor and would exclude significant transmission infrastructure put in service prior to ERCOT’s archive, which seems to go back to 1999. |
| CAISO | CAISO posts two spreadsheets of transmission project status data biannually as part of the Transmission Development Forum (TDF). One file contains approved projects from CAISO’s regionally planned projects (built by investor-owned utilities or independent transmission developers) and the other is for network upgrades triggered by generation interconnection. In addition, CAISO posts transmission projects that are owner initiated as part of the Transmission Project Review Process (TPR), also in a biannual spreadsheet posted by each transmission owner. CAISO does not appear to post data on existing transmission publicly. |
| NYISO | NYISO publishes proposed transmission facilities annually in its Load & Capacity Data Report (Gold Book). Section VII identifies proposed transmission facilities, including firm projects reported by transmission owners, local transmission owner projects, public policy transmission projects, and certain transmission upgrades associated with generator interconnection. To our knowledge, this data is only available via the PDF and is not available as a spreadsheet. NYISO does not appear to post data on existing transmission publicly. |
| ISO-NE | ISO-NE publishes quarterly project lists on its Regional System Plan webpage. These lists contain complete quarterly historic data looking back to late 2010, which is the most extensive out of any RTO/ISO database. Projects are grouped into two files: “Final RSP Project List” and “Final Asset Condition List.” RSP projects are those that are regionally planned by ISO-NE. Asset condition projects are planned by each member utility of ISO-NE. These datasets collectively represent the pool transmission facility (PTF) spending in the region but do not capture non-PTF spending. ISO-NE does not publish centralized data on non-PTF facilities publicly. This is a major data gap that ISO-NE could fill. |
| Key features of each dataset | |||||||
| RTO/ISO | Original (Proposed) In-Service Date | Final In-Service Date | Transmission Owner | Project ID | Voltage Level | Mileage | Alternatives Evaluated? † |
| PJM | X | X | X | X | X | ||
| MISO | X | X | X | X | X | ||
| SPP | X | X | X | X | X | ||
| ISO-NE | X | X | X | ||||
| ERCOT | X | X | X | X | X | X | |
| CAISO – TDF | X | X | X | X | P* | P* | P* |
| CAISO -TPR | X | X | X | X | X | X | X |
| NYISO | P‡ | X | X | X | |||
| RTO/ISO | Original Cost | Final Cost | Project Status | Project Type | New Build or Rebuild? | Open to Competitive Solicitation? | Cost-Benefit Analysis? | Geographic Location (State(s)) | Cost Allocation by Transmission Owner |
| PJM | P§ | X | X | X | X | X | |||
| MISO | X | X | X | X | X | P‖ | |||
| SPP | X | X | X | X | X | X | |||
| ISO-NE | X | X | X | X | X | ||||
| ERCOT | X | X | X | ||||||
| CAISO | P* | P* | P* | P* | P* | P* | P* | P* | |
| NYISO | P¶ | P†† | X |
P = partial, X = complete
* Only for CAISO TPR database
Notes:
† This includes whether alternative transmission upgrades were evaluated, including the type of upgrade, estimated costs, and whether GETs were considered.
‡ NYISO publishes the proposed in-service date or the final in-service date, but not the original proposed in-service date.
§ Approximately 75% of the time, the original cost figure is equivalent to the final cost figure.
‖ For many entries, MISO notes that this information is “not shared” and does not provide an explanation.
¶ NYISO categorizes the transmission projects by driver, but does not include a column for this.
†† NYISO describes the project in detail, but does not include a column for rebuild/new build.
[1] Other sources used to include the Department of Homeland Security’s Homeland Infrastructure Foundation-Level Data (HIFLD), but the public HIFLD dataset was discontinued in September 2025. The North American Electric Reliability Council also publishes some transmission data, but its dataset is largely forward-looking (i.e., projects under development), with some completed projects included but going back only until 2017.
[2] Major utilities are defined as utilities whose sales exceeded, in each of the three previous calendar years, any one of the following thresholds: 1 TWh in total annual sales, 100 MWh annual sales for resale, or 500 MWh of annual power exchanges delivered or wheeled for others. Bonneville Power Administration owns 15,000 miles of high-voltage transmission. Western Power Area Administration owns over 17,000 miles of high-voltage transmission. The Tennessee Valley Authority owns 16,400 miles of high-voltage transmission. The US EIA estimates the total amount of high-voltage transmission circuit-miles in the US to be 700,000.


Related Insights


Help build the clean energy future. Donate today.
Independent research. Real-world solutions. Supported by donors.
RMI can pursue the highest-impact climate and energy solutions because we’re supported by people who believe change is possible. Every gift helps advance the work needed to make clean energy the default choice worldwide.
And right now, your impact goes twice as far. Thanks to generous donors and our special match, every $1 you give becomes $2, up to $150,000, through December 31, 2026.