Learn how we are working to transform how we use and produce energy.
The More We Look, the More We Find
What Tanager-2 Means for Methane Detection
Why we share this work for free
RMI is an independent nonprofit working to accelerate the clean energy transition. We publish research like this to inform decision-makers and drive real-world impact.
Our work is supported by philanthropy as well as partnerships, including fee-for-service engagements. This support makes it possible for us to share our independent insights for free.
If you find this work valuable, you can support it anytime.
Get more insights like this
Stay up to date with the latest research, analysis, and tools from RMI by opting in to receive occasional emails below. You’ll get new reports, event invitations, and practical insights to help us all accelerate the clean energy transition.
Loading form...
Your download should start automatically. If it doesn’t, click the download button below.
This work is made possible by philanthropy
RMI is a nonprofit supported by donors and partners. Philanthropy enables us to produce independent research and make resources like this freely available.
If you find this report valuable, please consider supporting our work. You can also explore how we partner with organizations to drive impact.
Jump to Section
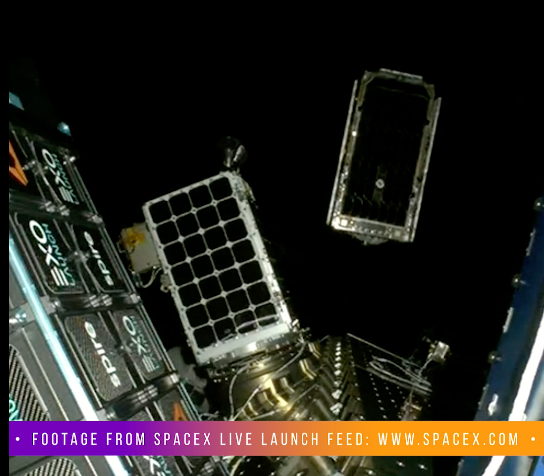
In 2024, RMI was on the ground at the launch of Tanager-1, a methane-sensing satellite brought to life by the Carbon Mapper coalition, a public-private partnership that RMI is proud to be a member of. Two years later, Tanager-1 now has a companion floating 300 miles above the Earth.
Tanager-2 launched on October 1, 2026, has already been at work retrieving images from space. This newest satellite — and its methane data that Carbon Mapper will publicly share — is worth celebrating. It also merits unpacking a perplexing reality: more methane observations will likely increase (not decrease) evidence of global methane emissions. But even as this signals daunting environmental realities, this is actually a sign of progress.
Tanager-2 deployment into orbit
Two Tanagers are better than one
Methane can be purposely emitted or inadvertently escape from energy, waste, and agricultural systems, anywhere and at any time. But one satellite can only be in one place at a time. That means any given facility gets imaged by a single satellite only as often as the orbit allows, and a lot can happen on the ground between overpasses.
Tanager-2 fixes part of that problem. Two Tanager satellites roughly double revisit frequency over a given location, which matters because super-emitting events aren’t constant. A stuck valve, an unplanned event, a compressor that starts failing on a Tuesday and gets fixed by Friday — a satellite that only passes every week or two can miss these entirely.
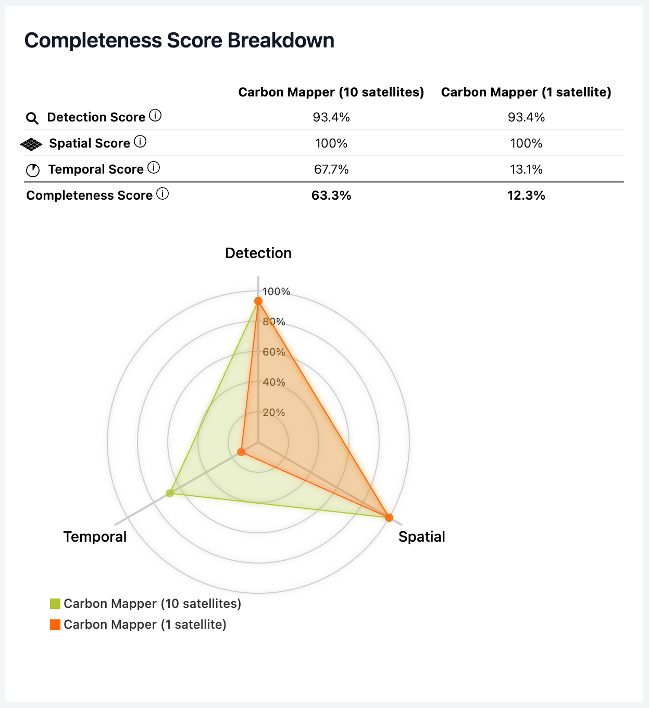
More revisits also mean more data: The Carbon Mapper data portal has published more than 9,500 methane plumes from roughly 4,400 oil and gas sources alone since Tanager-1 went up in August 2024. A second satellite means that public dataset keeps growing faster. RMI’s SPECT (Satellite Point source Emissions Comparison Tool) shows how every additional satellite to the Carbon Mapper constellation improves temporal coverage of methane plume detection.
RMI’s SPECT tool shows that additional satellites in Carbon Mapper’s constellation increase temporal coverage of methane plumes
Building data to action
More data only matters if it reaches the people who can act on it, and that’s the goal of scaling the constellation. Governments, regulators, operators, and international bodies all need asset-level information that’s current enough to act on. A faster-growing, more current public dataset is what lets an operator or state regulator move at the pace methane leaks demand given the energy, economic, and environmental risks associated with large releases of a valuable gas commodity that is explosive, contains toxins, and is a powerful pollutant.
Detection makes the headlines, but the harder, less visible work is tracking a flagged plume through notification, operator response, and confirmed repair. That pipeline is already producing results: since 2025, Carbon Mapper has delivered or supported more than 460 methane notifications across the United States, leading to 68 confirmed mitigations, with most of that growth happening in 2026 as the program expanded into 13 states. More Tanagers also offer the opportunity for operators to benchmark themselves against their competitors in preventing super-emitting events.
More coverage changes what’s possible politically, not just technically. As more locations get covered, the stronger the evidentiary basis becomes for regulators and legislators who want to build methane policy around real measurement instead of self-reported estimates. New Mexico’s proposed methane abatement rule — which would require operators to investigate, repair, and report on methane detected via remote sensing — is a preview of this. Once the data exists and is credible enough to stand up to scrutiny, it becomes something policymakers can use in legislation. A bigger satellite constellation makes programs like this feasible.
To paint a picture of what methane measurement success looks like, Carbon Mapper’s first big mitigation win came within two months of Tanager-1 launching in 2024: a Permian Basin gathering-pipeline leak emitting roughly seven metric tons (Mt) of methane per hour, fixed within two weeks of notification. Across the oil and gas sector, the organization’s mitigations to date are estimated to have kept 7.8 million Mt of CO2-equivalent out of the atmosphere — about the same as pulling 1.8 million gas-powered cars off the road for a year. That’s the kind of outcome a second satellite is meant to scale and multiply.
The paradox: more observations can make the problem seem bigger
As methane-detecting satellites and aircraft campaigns have expanded over the past several years, inventoried methane emissions in a lot of regions have gone up, not down. It’s tempting to read that as the problem getting worse. But for the most part, it isn’t necessarily the problem getting worse — it’s the measurements getting better.
Traditional greenhouse gas inventories are built bottom-up. Engineering estimates, emission factors, and self-reported activity data are added up across equipment and processes to estimate routine emissions. But that methodology is bad at catching the intermittent, abnormal emissions from malfunctioning or failing equipment. Super-emitters are exactly what a bottom-up estimate is bad at characterizing.
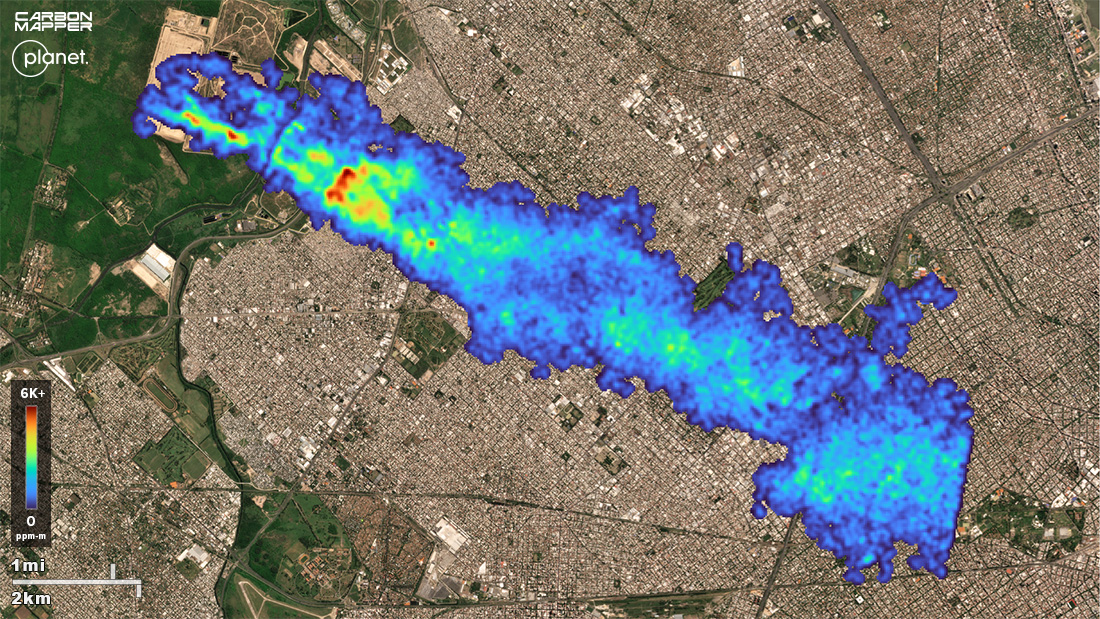
Satellites work from the other direction. They measure what’s actually in the atmosphere and trace it back to a source, whether or not that source ever showed up in an inventory. So, when a region gets measured for the first time, or measured more completely — better sensitivity, wider coverage, more frequent passes — the resulting number often comes in several times higher than what the inventory assumed. This has played out again and again in basin-scale studies of US oil and gas regions, where measured emissions have landed well above official estimates. Operators didn’t start emitting more overnight; the emissions were there all along, invisible until now.
RMI’s OCI+ (Oil Climate Index plus Gas) methodology was built to reconcile asset-level, bottom-up engineering model estimates with top-down satellite observations. Our team has learned over time that a larger emissions estimate actually means it is “more complete” rather than just “worse.”
Mapping super-emitter’s share of oil and gas methane intensity
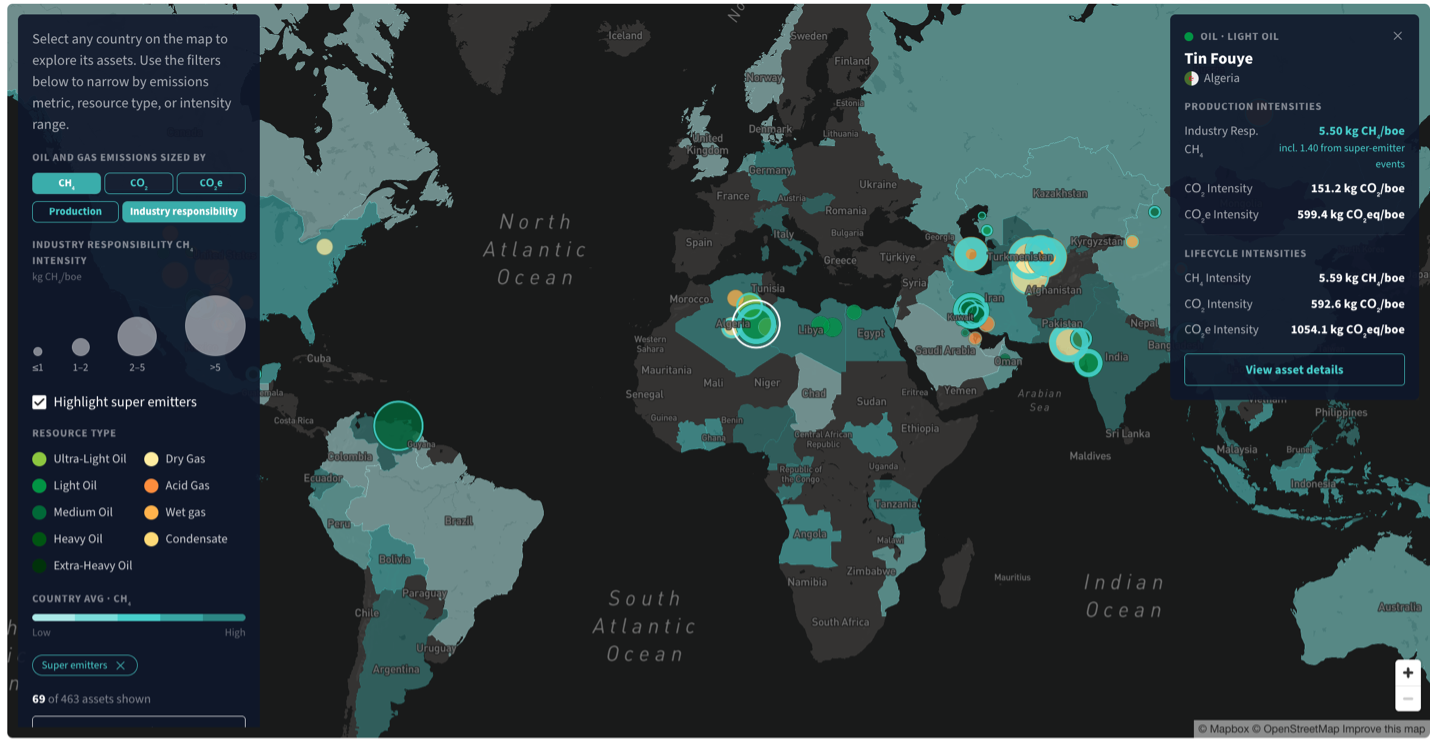
Note: Blue rings depict share of methane intensity from Carbon Mapper detected super-emitter events.
It is reasonable to expect reported methane to keep climbing in some regions as the Tanager constellation (and others like it) grows more capable, even while real mitigation is accelerating in parallel. That’s the picture getting sharper, not the problem getting bigger. These newly visible super-emitting sources tend to be some of the least expensive and quickest methane tons to cut. Once you can see a leak, fixing it is usually weeks of work, not years. And because methane warms 82 times more than carbon dioxide on a 20-year timeframe, this is real climate mitigation potential.
One piece of a bigger system
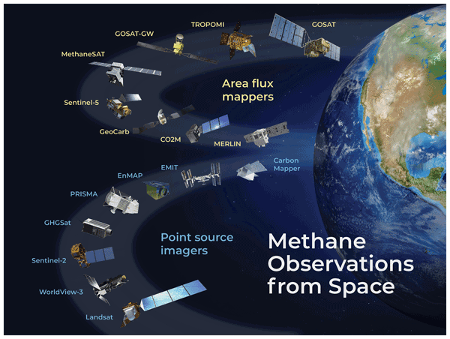
It’s worth remembering that Tanager-1 and Tanager-2 are not working alone. RMI has made the case before that methane satellites shouldn’t fly solo — different instruments are built for different jobs, and the real value comes from stacking them to get a fuller picture of emissions from oil and gas operations. VIIRS tracks flaring globally, night after night. NASA’s EMIT, built originally to study dust, turned out to be a methane-plume detector too, and covers different ground than Tanager does. TROPOMI, for example, gives you the regional picture of methane that can true up state or national inventories. The Tanager instrumentation specializes in facility-level precision — the layer you need to actually pinpoint and attribute a single super-emitter. All of these weave together into a stronger methane-measuring tapestry.
The array of methane-measuring satellites
We can expect that the measurement landscape will keep expanding in the near future. Carbon Mapper has said it plans to deploy at least two more broad-spectrum Tanagers, plus a satellite optimized for short-wave infrared imagery, with aircraft testing of that newer technology starting in 2027.
A methane measurement milestone
Tanager-2’s launch is a real milestone that heralds better revisit rates, wider coverage, and an additional stream of data feeding methane mitigation work on the ground. But its bigger significance is in what it will do for completeness of greenhouse emissions estimates of methane and other gases. When methane inventories climb over the next few years, it will be important not to read that as emissions getting worse by default. It might mean that measurements are finally catching up to a problem that was always this size. Tools like SPECT and OCI+ exist to help tell those two stories apart. With Tanager-2 in orbit, that job just got easier.
Acknowledgments
The authors thank Carbon Mapper for their contribution.
Additional contributor: Sasha Bylsma


Related Insights

Turning Buyer Demand into Lower-Emissions Copper Production
Help build the clean energy future. Donate today.
Independent research. Real-world solutions. Supported by donors.
RMI can pursue the highest-impact climate and energy solutions because we’re supported by people who believe change is possible. Every gift helps advance the work needed to make clean energy the default choice worldwide.
And right now, your impact goes twice as far. Thanks to generous donors and our special match, every $1 you give becomes $2, up to $150,000, through December 31, 2026.