Learn how we are working to transform how we use and produce energy.
Ground Source, Grid Value: The Power-System Impacts of Geothermal Heating and Cooling
How geothermal heat pumps can reduce peak demand, improve grid utilization, and lower utility system costs
Why we share this work for free
RMI is an independent nonprofit working to accelerate the clean energy transition. We publish research like this to inform decision-makers and drive real-world impact.
Our work is supported by philanthropy as well as partnerships, including fee-for-service engagements. This support makes it possible for us to share our independent insights for free.
If you find this work valuable, you can support it anytime.
Get more insights like this
Stay up to date with the latest research, analysis, and tools from RMI by opting in to receive occasional emails below. You’ll get new reports, event invitations, and practical insights to help us all accelerate the clean energy transition.
Loading form...
Your download should start automatically. If it doesn’t, click the download button below.
This work is made possible by philanthropy
RMI is a nonprofit supported by donors and partners. Philanthropy enables us to produce independent research and make resources like this freely available.
If you find this report valuable, please consider supporting our work. You can also explore how we partner with organizations to drive impact.
Jump to Section
Introduction
With the rapid growth in data centers and the transition to a more electrified economy,1 electricity demand patterns are shifting across the United States. This shift is creating an urgent need to manage loads to maintain grid reliability and minimize escalating utility bills for customers. This places new pressures on electricity systems that were not designed for this rapid transition, and as a result, utilities and their regulators are increasingly focused on strategies that can reduce peak demand and improve overall system utilization.
In cold-climate states such as Pennsylvania and Massachusetts, these trends are expected to fundamentally reshape seasonal demand patterns. Historically, electricity demand has peaked in the summer in these states. However, with increased electrification of space heating, they are likely to see electricity demand peak in winter. The future winter electricity peak will be driven largely by building space heating loads, making effective management of winter demand critical to maintaining grid reliability and containing utility infrastructure costs.
In warm-climate states like Texas, the challenge takes a different but equally pressing form. Rapid growth of data centers, alongside continued electrification of buildings and transportation, is intensifying already high summer peak demand driven by space cooling. In these regions, addressing cooling demand from buildings is essential to reducing grid strain and mitigating the required capital investment for electricity system expansion.
This report provides summaries highlighting how the utility system value of ground-source heat pumps differs across climates, building sectors, and future electricity demand scenarios, focusing on Pennsylvania, Massachusetts, and Texas. There are also links to the full analysis for each state. Together, these analyses demonstrate that GHPs can consistently reduce peak demand and improve grid utilization, while illustrating the state-specific opportunities for utilities and policymakers to better capture these benefits through planning, regulation, and customer programs.
Geothermal Heat Pumps
Geothermal heat pumps (GHP), or ground source heat pumps, offer a compelling but underutilized solution for both climates. Compared to conventional air conditioners and air-source heat pumps, GHPs deliver higher efficiency on average, with even greater performance advantages during extreme temperatures due to the relatively stable ground temperature that provides the heat source (during heating) and sink (during cooling). This makes them particularly well-suited to addressing both winter heating peaks in cold climates and summer cooling peaks in warm climates.
GHPs can be deployed as individual systems serving a single building or as thermal energy networks (TENs), where multiple buildings share a common underground geothermal loop to provide heating and cooling across the network. However, adoption has been constrained by high up-front costs and a limited pool of experienced contractors, especially those with the specialized drilling expertise required for installation. These challenges create a significant barrier to wider adoption despite the technology’s strong operational savings and potential for peak demand reduction.
Against this backdrop, the goal of this analysis is to assess the practical potential of geothermal heating and cooling to deliver value to the utility system by shaving peak demand and reducing annual energy consumption. It also examines whether this value is appropriately being captured in utility bill savings, and identifies policy and regulatory levers that could better translate these benefits into financial incentives to support broader deployment of GHPs.

Analysis Overview
This analysis evaluates the system impacts of GHP adoption across climates, states, building types, and timeframes. The analysis focuses on three representative states: Massachusetts and Pennsylvania in cold climates, and Texas in a warm climate.
In the cold-climate states, the analysis centers on residential buildings, including both single-family and multifamily homes, where space heating demand plays a significant role in shaping electricity use. For Massachusetts, the analysis also considers the benefits of serving residential buildings through TENs in mixed-use settings, where residential and commercial load diversity can improve system efficiency.
In contrast, the warm-climate analysis focuses on commercial buildings, where consistent cooling demand throughout the year and relatively higher energy use per site make these buildings strong candidates for near-term GHP deployment. Within this sector, office buildings and retail stores are the primary focus of the core scenarios as they represent the largest contributors to commercial cooling energy use,2 while hotel and warehouse buildings are included in an additional scenario to capture the incremental impacts of expanding GHP adoption to a broader set of commercial building types.
Building on the 2023 Oak Ridge National Laboratory study, Grid Cost and Total Emissions Reductions Through Mass Deployment of Geothermal Heat Pumps for Building Heating and Cooling Electrification in the United States,3 which evaluated the national-scale impacts of deploying GHPs to all applicable building floor space by 2050, this analysis focuses on regionally relevant, near- and mid-term deployment pathways that could help drive practical adoption. The study assesses the impacts of GHP adoption across different scales of deployment through four adoption scenarios:
- Low: 2% of single-family and multifamily dwelling units or office and retail buildings
- Medium: 10% of single-family and multifamily dwelling units or office and retail buildings
- High: 20% of single-family and multifamily dwelling units or office and retail buildings
- Very High: 50% of office and retail buildings and 20% of hotel and warehouse buildings
Exhibit 1
The analysis considers two timeframes to reflect both current and evolving load growth conditions:
- Today (2025): Representing current load profiles and predominantly summer-peaking systems across all three states.
- Electrified Future (2040): Reflecting increased electrification across buildings,4 transportation, and industry, resulting in higher overall electricity demand. Remains summer-peaking system in warm climate and flips to winter peaking in cold climate.
Following are the state summaries.
Note: The per-ton GHP costs shown in this report are not directly comparable across states because the Massachusetts and Pennsylvania costs are for residential systems, while the Texas cost is for commercial systems; commercial GHP systems generally have lower costs per ton than residential systems. GHP costs also vary substantially by state due to factors such as the availability of an existing drilling workforce, with the Texas costs on the lower end compared with states such as Arizona.
Cold Climate
Warm Climate
Considerations Beyond Quantified Utility Savings
While this analysis quantifies utility system savings from geothermal heat pumps, several important considerations should be kept in mind. Some costs are measured on different cost bases, and several sources of system value are not captured in the quantified utility system savings estimates.
- GHP installation costs and utility system savings are measured on different cost bases. GHP installation costs include contractor overhead and profit (O&P), while electricity system savings are based on avoided wholesale system costs and do not include utility O&P, which is typically recovered through retail rates. This difference likely overstates the cost gap but is unlikely to materially change the overall results.
- Interconnection value is not captured. As electricity demand grows from data centers and electrification, actively reducing peak demand can help free up grid capacity and accelerate new customer interconnections. This “speed-to-power” value may become increasingly important as large new loads seek timely access to the grid.
- Future electricity system costs may be higher than assumed. The avoided generation, transmission, and distribution costs used in this analysis are based on data that largely predate the recent surge in data center-driven load growth. Future system expansion may face supply chain and labor constraints that increase the cost of new infrastructure, increasing the value of demand reduction.
- Transmission expansion challenges are not fully reflected. The transmission cost values used in the analysis do not capture many of the practical challenges associated with expanding the grid, including lengthy permitting processes, siting constraints, local opposition, and project delays that can increase costs and slow deployment.
- Avoided gas infrastructure investments are not included. The analysis does not quantify the potential to avoid investments in aging natural gas distribution infrastructure, whose replacement costs have increased significantly over time. In some locations, GHP deployment can serve as a cost-effective non-pipeline alternative to avoid or defer costly pipeline replacements and system upgrades.5
Policy Recommendations
While GHP installation costs in the United States are high, mature European markets such as Switzerland demonstrate substantial potential for cost reduction. As the Swiss GHP market expanded, inflation-adjusted installation costs for a typical single-family system fell by more than 50% over roughly two decades.6 Additional research shows a strong relationship between increasing cumulative deployment and declining costs in the Swiss market, with greater supply chain competition, imported components, advances in borehole drilling technology, and higher equipment utilization contributing to cost reductions.7 This points to the importance of policies that support greater market penetration and industry development to help drive similar cost reductions in the United States.
In the near term, state and utility programs can be strategically coordinated with federal geothermal heat pump investment tax credits for commercial buildings while they are still available to narrow the cost gap and accelerate market uptake and industry development. In Texas, for example, the federal tax credit could close the modeled cost gap, making GHP deployment cost-effective from the utility perspective and demonstrating the opportunity to leverage the remaining tax credit runway while supporting longer-term cost reductions.
Current programs, incentives, and utility cost-effectiveness inputs do not always fully recognize the broader utility system value of GHPs quantified in this analysis, including peak demand reduction, improved grid utilization, and lower long-term system costs, leaving geothermal heating and cooling undervalued in utility planning and customer programs. States and utilities can quantify the value of GHPs for their own climates and energy systems and better capture those benefits through the following actions:
- Establish targets for utilities to achieve through customer programs, either directly for geothermal heating and cooling or for achieving the peak demand benefits that geothermal heating and cooling can provide. This can encourage utilities to introduce geothermal programs where they do not yet exist and expand or prioritize existing programs.
- Establish incentives for utilities to deploy effective customer programs for GHPs, including TENs. This can include utility performance incentives that reward efficient grid management during periods of peak demand, while ensuring program designs appropriately balance costs and benefits across participating and non-participating customers. States may also consider recognizing geothermal heating and cooling within renewable portfolio standards or other clean energy policies, where appropriate.
- Update inputs to utility program cost-effectiveness tests to better recognize the value of GHPs and enable larger program budgets and customer incentives. This can include more fully recognizing both summer and winter peak capacity values, where applicable, and evaluating GHPs against appropriate future technology baselines, such as air-source heat pumps in electrification scenarios, to better capture their electricity demand reduction benefits.
- Launch or expand utility programs for GHPs, including TENs, targeted to the electric and gas grid locations and customer segments where they provide the greatest system value. While gas system infrastructure was not explicitly analyzed here, coordinating deployment with both electric and gas system planning can maximize infrastructure savings while delivering the greatest grid benefits.
- Encourage new large electricity loads to invest in demand-side measures alongside their own demand flexibility, helping offset growing capacity needs and enabling more efficient grid expansion. Such investments can support faster interconnection while helping limit infrastructure costs that might otherwise be borne by existing utility customers.
- Invest revenues from carbon markets and other state funding sources to support effective demand reduction, including GHPs. These funding sources can complement utility programs by supporting deployment that improves grid management while advancing state electrification and climate goals.
Conclusion
As electricity demand grows from electrification and data centers, utilities will increasingly need demand-side resources that improve system efficiency while reducing the need for costly infrastructure expansion. Across all three states evaluated, this analysis demonstrates that GHPs can provide meaningful utility system value by reducing peak demand, lowering energy consumption, and improving utilization of existing electric infrastructure. While the magnitude and timing of these benefits vary by climate and utility system, the overall conclusion is consistent: GHPs represent a scalable utility system resource, and through improved grid utilization, can help support long-term energy affordability for all ratepayers.
The analysis also shows that current utility planning, cost-effectiveness methodologies, and customer programs do not always fully recognize these broader system benefits. At the same time, continued cost compression through prioritizing workforce development and technology innovation will be critical to realize the full potential of GHP deployment. Better aligning these frameworks with the full value that GHPs provide, while continuing to reduce installation costs, can support more efficient grid investment while improving reliability, affordability, and progress toward state energy and climate goals. Geothermal heating and cooling technology deserves consideration not solely as a building technology, but also as part of a broader strategy for managing peak demand, improving grid utilization, and reducing long-term infrastructure costs.
Methodology
Exhibit 2 illustrates the overall analytical framework. The analysis begins by modeling demand-side impacts, estimating hourly energy savings and peak demand reductions from GHP adoption at each penetration level derived from the National Laboratory of the Rockies’s (NLR) ResStock and ComStock 2024.2 dataset.8 These are then mapped to each state’s hourly load profile from the 2024 Annual Decarbonization Perspective for both the Today and Electrified Future timeframes.9 High savings potential building samples were selected to reflect the buildings most likely to be targeted for GHP deployment.
Exhibit 2
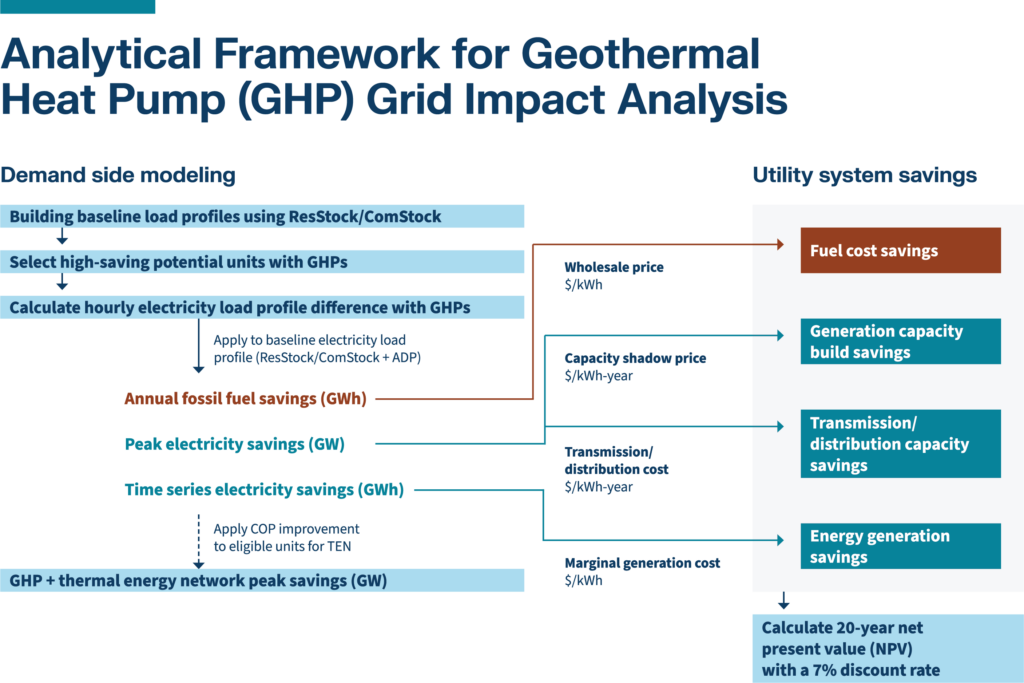
These demand-side results are then translated into customer bill savings and utility system savings, including generation capacity expansion, energy generation, transmission and distribution infrastructure, and wholesale fossil fuel use for heating. Generation capacity impacts are evaluated using a range of cost assumptions, with capacity shadow prices from NLR Cambium data representing a lower bound and gas turbine capital costs from GridLab’s Gas Turbine Costs Report (approximately $1,500/kW) representing a higher bound.10
Energy generation savings are calculated based on marginal generation cost from NLR Cambium 2024. Transmission/distribution capacity values are derived from a combination of sources including California Public Utility Commission’s Avoided Cost Calculator Integrated Calculation Model and The Value of, and Compensation for, Distributed Energy Resources in Illinois. Wholesale fossil fuel savings are derived from US Energy Information Administration (EIA) Natural Gas Citygate Price and Wholesale Weekly Heating Oil and Propane Prices.11
Customer bill savings are estimated using state-average retail electricity prices from the EIA, and results from ResStock and ComStock for fossil fuel bill savings. All results are presented as 20-year net present values (to represent a conservative estimate of the average GHP indoor equipment lifetimes12) using a 7% discount rate. Cost results are expressed in dollars per ton of heat pump capacity (one ton equals 12,000 Btu/hr), based on heating capacity in Massachusetts and Pennsylvania and cooling capacity in Texas, to provide a consistent basis for comparison with available cost data. The appendix describes our methodology in more detail.
Additional Contributors:
Xing Chen and Mike Henchen
Endnotes
- American Edge Project. America’s AI Surge: Powering Growth in Every State, 2025, https://americanedgeproject.org/wp-content/uploads/2025/12/Americas-AI-Surge-Powering-Growth-in-Every-State.pdf. ↩︎
- Based on modeled data from ComStock. Note that ComStock only models 64% of total commercial building energy use in the United States. ↩︎
- Xiaobing Liu, et al., Grid cost and total emissions reductions through mass deployment of geothermal heat pumps for building heating and cooling electrification in the United States, Oak Ridge National Laboratory, 2023, https://doi.org/10.2172/2224191. ↩︎
- The Electrified Future is based on the 2024 Annual Decarbonization Pathway central scenario, which projects that 76% of residential space heating is electrified by 2040 and 94% by 2050. Although the scenario includes a mix of heating technologies, this analysis assumes buildings receiving GHPs would otherwise have installed air source heat pumps, the predominant technology. ↩︎
- Dammel, J., Teener, J., Prieto, O., & Henchen, M., Service line NPAs: Unlocking savings and driving electrification, 2025, RMI, https://rmi.org/service-line-npas-unlocking-savings-and-driving-electrification/; and Non-pipeline alternatives: Emerging opportunities in planning for US gas system decarbonization, RMI and National Grid, 2024, https://www.nationalgridus.com/media/pdfs/other/CM9904-RMI_NG-May-2024.pdf. ↩︎
- Rybach, L, “Geothermal heat pump production sustainability: The basis of the Swiss GHP success story,” Energies, 15(21), 7870, 2022, https://doi.org/10.3390/en15217870. ↩︎
- Heptonstall, P. & Winskel, M., Decarbonising home heating: An evidence review of domestic heat pump installed costs, UK Energy Research Centre, 2023, https://ukerc.ac.uk/publications/heat-pump-cost-review/. ↩︎
- Philip R. White, et al., ResStock 2024 Release 2. Dataset. National Laboratory of the Rockies, 2024, https://doi.org/10.2172/2340765; and Chris CaraDonna, et al., ComStock Standard Dataset Release: Commercial 2024 Release 2, 2025, https://www.nlr.gov/docs/fy25osti/92766.pdf. ↩︎
- Jones, R.A., Haley, B., et al., Annual Decarbonization Perspective: Carbon Neutral Pathways for the United States 2024. Evolved Energy Research, 2024. ↩︎
- Gas Turbine Cost Report, GridLab, https://gridlab.org/portfolio-item/gas-tubine-cost-report/. ↩︎
- Natural Gas Prices: Citygate Price, US Energy Information Administration, https://www.eia.gov/dnav/ng/ng_pri_sum_a_epg0_pg1_dmcf_a.htm; and Weekly heating oil and propane prices (wholesale heating oil data series), US Energy Information Administration, https://www.eia.gov/dnav/pet/pet_pri_wfr_a_EPD2F_PRS_dpgal_w.htm. ↩︎
- “Ground source (geothermal) centrally ducted system for a two-story home,” NYS Clean Heat, accessed Sep 2, 2026, https://cleanheat.ny.gov/ground-source-heat-pump-for-a-two-story-home/#tabcordion_primary. ↩︎
Appendix: Methodology
This document lays out the methodology used to quantify the impacts of geothermal heat pump (GHP) adoption including demand-side modeling, utility system savings, customer bill savings, incremental GHP costs, and emissions savings. It provides additional detail on the data sources, assumptions, and analytical methods underlying the results presented in the main report.
Exhibit A1: Analytical Framework
Exhibit A1 illustrates the overall analytical framework used in this study. The analysis first modeled peak demand and energy savings from GHPs at various adoption levels. These demand-side impacts were then translated into utility system savings from reductions in generation capacity build needs, transmission and distribution capacity expansion, energy generation, and wholesale fossil fuel costs associated with heating.
Demand-Side Modeling
To estimate the energy and peak demand savings from GHPs, hourly electricity load profiles for GHP upgrades were generated and compared against baseline load profiles for both the Today (2025) and Electrified Future (2040) timeframes.
Baseline hourly electricity load profiles across the residential, commercial, transportation, and industrial sectors were sourced from the 2024 Annual Decarbonization Perspective (ADP 2024) Central Scenario,1 using 2024 load profiles for the Today timeframe and projected 2040 load profiles for the Electrified Future timeframe.
The following methodology was used to develop hourly GHP electricity savings profiles for residential buildings in Massachusetts and Pennsylvania and commercial buildings in Texas.
GHP upgrade load profiles
1. Obtain GHP upgrade results
Hourly electricity load profiles and annual energy savings associated with GHP upgrades were obtained from National Laboratories of the Rockies’ (NLR) ResStock and ComStock datasets.
For the residential analysis in Massachusetts and Pennsylvania, the Energy Star Geothermal Heat Pump measure from the ResStock 2024.2 dataset was used.2 This measure has a rated heating coefficient of performance (COP) of 4 and cooling energy efficiency ratio of 20.5. To align with ResStock’s modeled eligibility criteria for this measure, filters were applied to include dwelling units with ducted HVAC systems and no shared HVAC equipment. Additional filters were applied to represent typical occupied homes under realistic operating conditions, including occupied dwelling units, a heating setpoint of 65°F, a cooling setpoint above 80°F, the presence of a cooling system, and a 100% cooled floor area.
For the commercial analysis in Texas, the Packaged Water-to-Air Geothermal Heat Pumps measure with an average cooling COP of 6.7 and average heating COP of 3.84 from the ComStock 2024 dataset was used. This upgrade represents one of the most common commercial GHP system configurations, utilizing packaged water-to-air heat pumps.
2. Calculate GHP energy savings
For the Today (2025) timeframe, hourly energy savings were calculated as the difference between the baseline building and the GHP upgrade scenario.
For the Electrified Future (2040) timeframe, buildings were assumed to be largely electrified; therefore, hourly energy savings were calculated relative to the business-as-usual (BAU) electrification technology — the Cold Climate Air Source Heat Pump with Electric Backup upgrade in ResStock for residential buildings and Heat Pump Rooftop Unit (HP RTU) upgrades in ComStock for commercial buildings.
3. Select representative models
The distribution of annual GHP energy savings was analyzed to identify representative building models. Buildings with negative modeled savings or statistical outliers were excluded. High-savings buildings, defined as those near the 75th percentile of the savings distribution, were selected to represent achievable GHP performance across the penetration scenarios evaluated in this study.
4. Scale hourly electricity savings
Hourly electricity savings from the representative building models were normalized and scaled according to each adoption scenario. For Massachusetts and Pennsylvania, savings were normalized on a per-dwelling-unit basis and scaled according to the number of applicable dwelling units. For Texas, savings were normalized on a per-square-foot basis and scaled according to the applicable commercial floor area.
5. Develop statewide GHP load profiles
The scaled hourly electricity savings profiles were applied to the corresponding ADP baseline load profiles to generate statewide hourly electricity load profiles under each GHP adoption scenario.
Peak electricity demand reductions and annual electricity savings were then calculated by comparing the GHP adoption load profiles against the corresponding baseline load profiles. These demand-side results served as the primary inputs to the utility system savings analysis.
Hotel and warehouse GHP upgrade load profiles
A simplified approach was used to estimate GHP impacts for hotel and warehouse buildings in the Very High adoption scenario by scaling results from the office and retail analysis under the assumption that load shapes are broadly similar.
- Hourly heating and cooling loads for office and retail buildings were estimated using average hourly energy savings, baseline HVAC annual average heating and cooling COPs, and GHP heating and cooling COPs. The ratio of annual heating to cooling demand was used as a proxy to separate hourly total savings into heating and cooling savings. All HVAC loads from mid-May through September were assumed to represent cooling only, reflecting the cooling-dominant climate in TX.
- Hotel and warehouse hourly heating and cooling loads were then estimated by scaling the office and retail results using the ratio of annual heating and cooling demand for each building type. These adjusted loads, combined with annual average baseline HVAC and GHP heating and cooling COPs for hotel and warehouse buildings, were used to calculate hourly energy savings for hotels and warehouses.
- The resulting hourly savings for 20% of hotel and warehouse buildings were combined with savings from 50% of office and retail buildings and integrated into the baseline and electrified baseline load profiles from ADP to produce the total electricity load profiles for the Very High adoption scenario.
This approach assumes that hotel and warehouse load shapes are similar to those of office and retail buildings. However, this assumption may not fully reflect actual operating conditions, as hotel loads may more closely resemble residential load patterns — aligning more closely with system peak hours — while warehouse loads may exhibit flatter load profiles. As a result, this approach may underestimate potential peak demand savings.
Thermal energy networks
Modeling thermal energy networks (TENs) is substantially more complex than modeling individual GHP systems because system performance depends on the diversity and interaction of connected building loads. Rather than developing a detailed TEN model, this analysis uses a simplified methodology to estimate the incremental peak demand reduction resulting from the higher system COP achieved by balancing heating and cooling loads for Massachusetts’ Electrified Future High Adoption scenario.
The proportion of buildings appropriate for TEN deployment remains uncertain. For this analysis, TEN deployment was evaluated only in medium-density, mixed-use districts, which were assumed to have greater peak savings potential. ResStock, which incorporates data from the American Community Survey, was used to identify dwelling units located in the “metro area, principal city,” “metro area, not/partially in principal city,” and “not/partially in metro area” location categories. For this analysis, all multifamily dwelling units and 50% of single-family dwelling units located in the “metro area, not/partially in principal city” category were assumed to represent medium-density mixed-use districts. Based on these assumptions, within the High Adoption Scenario, approximately 40% of the single-family homes and 68% of the multifamily homes receiving GHP upgrades were assumed to be deployed as TENs.
Given the uncertainty surrounding achievable TEN performance, two COP assumptions were evaluated. A winter heating COP of 8.9 was based on the Colorado Mesa University TEN analysis, where diverse heating and cooling loads across the campus improve winter system performance.3 Because this value may represent the upper end of expected performance, a more conservative COP of 5 was also evaluated based on values commonly reported in the literature.4 A weighted-average heating COP across buildings receiving stand-alone GHPs and TENs was then calculated. Based on the modeled heating load, the improvement in heating COP was used to estimate the additional peak demand reduction attributable to TEN deployment.
Utility System Savings
To estimate utility system savings, electricity system cost savings and avoided wholesale fossil fuel costs associated with GHP adoption were quantified using the methodology described below. Annualized values were converted to a 20-year net present value (NPV) using a 7% discount rate, consistent with the assumed lifetime of GHP systems.
Electricity system savings
The following electricity system cost components were quantified based on the peak demand reductions and hourly electricity savings developed through the demand-side modeling analysis.
- Generation capacity savings were calculated based on peak demand reductions, which reduces the amount of new generation capacity required. Two cost assumptions were evaluated:
- Low estimate: State-specific annual capacity shadow prices ($/MW firm-year) from the NLR Cambium 2024 High Demand Growth Scenario, converted to a 20-year NPV. Shadow prices were only available at five-year intervals, so linear interpolation was used for intermediate years. These values are derived using a marginal least-cost methodology from NLR’s ReEDS capacity expansion model, which allows for delayed retirements, increased transmission, or the cost of new entry for new generation. Notably, these estimates were developed before the recent data center boom.
- High estimate: A combustion turbine (CT) capital cost of $1,500/kW, based on GridLab’s Gas Turbine Cost Report, assuming all new peak demand would otherwise be met by gas CTs. Although the report estimates that recently constructed CT projects can cost up to $2,000/kW, the more conservative $1,500/kW estimate, representing the average cost of the plants evaluated in the study, was used for this analysis.
- Energy generation savings are the savings that result from requiring less generation to meet the estimated hourly demand. Hourly electricity savings from the demand-side modeling analysis were multiplied by hourly marginal generation costs ($/MWh) from the NLR Cambium 2024 dataset to estimate annual generation savings. MWh savings were assumed to remain constant each year in the 20-year NPV calculation.
- Transmission and distribution (T&D) capacity savings are the savings that result from lowered capacity, which reduces the T&D infrastructure needed to deliver power. Cost assumptions were informed by the DER Cost-Effectiveness Avoided Cost Calculator Integrated Calculation Model, The Value of, and Compensation for, Distributed Energy Resources in Illinois, and discussions with distribution system experts at RMI. Distribution costs were assumed to be $106/kW-year, while transmission costs were assumed to be $80/kW-year, with annual savings converted to a 20-year NPV.
The three components were summed to estimate total electricity system cost savings.
Fossil fuel savings
Fossil fuel savings were only quantified for the Today timeframe. By the Electrified Future timeframe, buildings were assumed to be largely electrified, and reliable projections of wholesale fossil fuel prices are not available; therefore, fossil fuel savings were not estimated for 2040.
Fossil fuel cost savings were calculated by multiplying annual fossil fuel savings estimated from ResStock and ComStock by state-specific wholesale and citygate fuel prices for natural gas, propane, and heating oil (using 2024 state-specific data). Wholesale and citygate prices were used to reflect avoided utility fuel costs rather than retail customer energy bills. A 4% methane leakage rate was assumed.5
The following data sources were used:
- Natural gas prices: EIA Natural Gas Citygate Prices
- Propane and heating oil prices: EIA Wholesale Weekly Heating Oil and Propane Prices
- Natural gas heat rate: EPA AP-42, Compilation of Air Pollutant Emissions Factors from Stationary Sources – External Combustion Sources
- Propane heat rate: DOE Alternative Fuels Data Center Fuel Properties Comparison
- Fuel oil heat rate: EIA British Thermal Units
Fossil fuel cost savings were added to electricity system savings to estimate total utility system savings for the Today timeframe.
Bill Savings
The following describes how electricity and fossil fuel bill savings associated with GHP adoption were quantified to estimate total customer bill savings. Annual values were converted to a 20-year NPV using a 7% discount rate. This analysis assumes that large changes in utility demand profiles would not significantly impact the volumetric retail electricity or fossil fuel rates charged to residential and commercial customers.
- Electricity bill savings were calculated by converting total electricity savings into per-unit savings for residential buildings and per-square-foot savings for commercial buildings, then multiplying those savings by state-average residential or commercial retail electricity rates from the EIA State Energy Profiles. Savings were scaled according to the applicable dwelling units or commercial floor area under each GHP adoption scenario.
- Fossil fuel bill savings were obtained directly from the ResStock and ComStock datasets, which use state-average retail utility rates for natural gas, propane, and heating oil. Savings were normalized using the output metrics from ResStock and ComStock and scaled according to the applicable dwelling units or commercial floor area under each GHP adoption scenario.
GHP Incremental Cost
To estimate the investment required to achieve the quantified utility system savings, the incremental cost of a GHP system relative to the expected BAU replacement system was estimated using the methodology described below. For the Today (2025) timeframe, the BAU replacement system was assumed to be a gas furnace plus central air conditioner (central AC) for residential buildings and a natural gas rooftop unit (NG RTU) for commercial buildings. For the Electrified Future (2040) timeframe, the BAU replacement system was assumed to be an air-source heat pump (ASHP) for residential buildings and an HP RTU for commercial buildings.
Incremental GHP costs were calculated as the difference between the total installed costs of the GHP and BAU systems. HVAC system capacity (tons) for each adoption scenario was estimated using the NLR ResStock and ComStock datasets (Massachusetts and Pennsylvania analyses use reported heating capacity, and Texas analysis uses reported cooling capacity), while state-specific installed cost assumptions for both GHP and BAU systems were obtained on a $/ton basis. Total installed system costs for each scenario were then calculated by multiplying the estimated HVAC capacity by the corresponding $/ton cost assumptions.
For Massachusetts and Pennsylvania, electrical panel upgrade costs were also included in the incremental cost calculation for the Electrified Future (2040) timeframe to account for panel upgrades that may be triggered by the installation of ASHPs. Because it is difficult to determine which individual homes would require panel upgrades, this analysis assumed that a panel upgrade would be required whenever the combined amperage of the ASHP and electric backup heating exceeded 60 amps. The percentage of homes requiring panel upgrades was estimated from the representative ResStock dwelling units and scaled across each adoption scenario. GHPs are modeled and sized without electric resistance backup, so panel upgrades were not assumed for GHP installations.
GHP system costs were obtained using the following state-specific installed cost assumptions:
- Massachusetts: Residential GHP installed costs were obtained from the Massachusetts Heat Pump Incremental Cost Research Memo and adjusted from 2023 to 2025 dollars using the US Bureau of Labor Statistics CPI Inflation Calculator.
- Pennsylvania: Residential GHP installed costs were derived by adjusting Massachusetts GHP costs using RSMeans-based labor and material cost indices from the Heat Pumps in the Northeast and Mid-Atlantic: Costs and Market Trends report, then adjusted from 2023 to 2025 dollars.
- Texas: Commercial GHP installed costs were based on cost information provided by industry partners from real-world low-enthalpy geothermal projects in commercial buildings, as standardized cost datasets for these systems are limited.
BAU System Costs were obtained using the following state-specific installed cost assumptions:
- Massachusetts: Residential natural gas furnace plus central AC (Today) and ASHP (Electrified Future) installed costs were obtained from the Massachusetts Heat Pump Incremental Cost Research Memo and adjusted from 2023 to 2025. Electrical panel upgrade costs were based on Rewiring America estimates using an average installed cost of $3,000 per panel upgrade.
- Pennsylvania: Residential natural gas furnace plus central AC (Today) and ASHP (Electrified Future) installed costs were derived by adjusting Massachusetts costs using the same RSMeans methodology described above, then adjusted from 2023 to 2025 dollars. The same electrical panel upgrade cost from Massachusetts was used.
- Texas: Commercial NG RTU and HP RTU installed costs were obtained from TRC Companies’ 2025 Nonresidential Alterations: Reach Code Study, with HP RTU costs also informed by RMI’s Economics of Electrifying Buildings series. Costs were adjusted from California to Texas using the RSMeans City Cost Index and from 2023 to 2025 dollars.
The state-specific cost assumptions are summarized in Exhibit A2.
Exhibit A2: Average Cost Data ($/ton)
| State | GHP | ASHP | HP RTU | Gas Furnace | Central AC | Gas RTU |
|---|---|---|---|---|---|---|
| Pennsylvania (residential) | $14,930 | $7,730 | – | $2,040 | $5,040 | – |
| Massachusetts (residential) | $15,430 | $7,990 | – | $2,100 | $5,210 | – |
| Texas (commercial) | $6,250 | – | $1,780 | – | – | $1,480 |
Emissions Savings
Fossil fuel emission savings were calculated by applying fuel-specific emission factors from ResStock 2024.2 Dataset shown in Exhibit A3 to annual reductions in gas, propane, and fuel oil consumption based on the existing fuel types represented in the ResStock and ComStock models used for the analysis.
Exhibit A3: On-Site Fossil Fuel Emission Factors
| Fuel Type | Emission Factor (lb./MMBtu) |
|---|---|
| Natural Gas | 147.3 |
| Propane | 177.8 |
| Fuel Oil | 195.9 |
Electricity emission savings were calculated using 20-year levelized annual long-run marginal emission rates (LRMER) from the Cambium 22 LRMER States Workbook.6 The 95% Decarbonization by 2050 scenario was used for Massachusetts and Pennsylvania, while the Mid-Case scenario was used for Texas. The electricity emission factors used in the analysis are summarized in Exhibit A4.
Exhibit A4: Electricity Emission Factors by States
| State | Scenario | Emission Factors (kg CO2e/MWh) | |
|---|---|---|---|
| 2025 | 2040 | ||
| PA | 95% Decarb by 2050 | 228.9 | 70.8 |
| MA | 95% Decarb by 2050 | 198.0 | 71.8 |
| TX | Mid-case | 111.2 | 89.6 |
Appendix Endnotes
- Jones, R.A., Haley, B., et al., Annual Decarbonization Perspective: Carbon Neutral Pathways for the United States 2024. Evolved Energy Research, 2024. ↩︎
- White, P. R., et al., ResStock 2024.2 Dataset. National Renewable Energy Laboratory. NREL/TP-5500-89600, 2024, https://doi.org/10.2172/2340765. ↩︎
- “Evaluating a Community Ground Source Heat Pump System at Colorado Mesa University,” Xcel Energy, 2022. ↩︎
- Geothermal Networks: 2019 Feasibility Study, HEET, and Buro Happold Engineering, 2019 (revised 2023). ↩︎
- Howarth, R. W., "Methane Emissions from Fossil Fuels: Exploring Recent Changes in Greenhouse-Gas Reporting Requirements for the State of New York," Journal of Integrative Environmental Sciences 17 (sup1): 69–81, 2020, https://doi.org/10.1080/1943815X.2020.1789666. ↩︎
- Gagnon, Pieter; Brady Cowiestoll, and Marty Schwarz, Long-run Marginal Emission Rates for Electricity - Workbooks for 2022 Cambium Data, National Laboratory of the Rockies, 2023, https://data.nlr.gov/submissions/206. ↩︎



Related Insights

The Opportunity for Heat Pumps to Put Downward Pressure on Electricity Rates
Building Smarter, More Efficient Air Conditioners for Real World Conditions

How Heat Pumps Reduce Energy Bills and Air Pollution in the San Francisco Bay Area
Delivered Fuel Customers in Maryland See Strong Energy Bill Savings in a Switch to Heat Pumps
Help build the clean energy future. Donate today.
Independent research. Real-world solutions. Supported by donors.
RMI can pursue the highest-impact climate and energy solutions because we’re supported by people who believe change is possible. Every gift helps advance the work needed to make clean energy the default choice worldwide.
For other ways to give to RMI, including checks or gifts of stock, please visit Other Ways to Give.