Learn how we are working to transform how we use and produce energy.
Green Hydrogen Production Pathways for India
Techno-economic considerations for green hydrogen project development
Why we share this work for free
RMI is an independent nonprofit working to accelerate the clean energy transition. We publish research like this to inform decision-makers and drive real-world impact.
Our work is supported by philanthropy as well as partnerships, including fee-for-service engagements. This support makes it possible for us to share our independent insights for free.
If you find this work valuable, you can support it anytime.
Get more insights like this
Stay up to date with the latest research, analysis, and tools from RMI by opting in to receive occasional emails below. You’ll get new reports, event invitations, and practical insights to help us all accelerate the clean energy transition.
Loading form...
Your download should start automatically. If it doesn’t, click the download button below.
This work is made possible by philanthropy
RMI is a nonprofit supported by donors and partners. Philanthropy enables us to produce independent research and make resources like this freely available.
If you find this report valuable, please consider supporting our work. You can also explore how we partner with organizations to drive impact.
Jump to Section
Executive Summary
India’s green hydrogen journey has been marked by ambitious goals and growing investments in renewable energy (RE) sources like solar and wind, aiming to position the country as a global leader in the clean energy transition. The government launched the National Green Hydrogen Mission in January 2023, focusing on boosting the production of green hydrogen, decarbonizing heavy industries, and enhancing energy security. Although national and international players have initiated several pilot projects and collaborations, major development at the project level remains elusive.
This study is an attempt to provide a detailed understanding of the dynamics of green hydrogen — to unpack cost economics, key project development considerations, and project risks, offering insights into India’s evolving landscape at the national and state levels. Using the lens of a project developer, it examines 17 distinct project locations across 17 states. The study examines convergence driven by national-level policies as well as local divergences resulting from state-specific renewable potential and policy support.
An optimization model is used to prioritize the least capital-intensive investments, ensuring efficient asset allocation. Although project configurations can vary widely, the scenarios considered here are representative of the expected developments in India’s green hydrogen ecosystem. These scenarios, though simplified, cover a variety of project configurations and their cost implications, recognizing that actual development will be influenced by economic feasibility, regional policies, and demand expectations. Distribution of production cost and landed power prices across some key scenarios is summarized in Exhibit ES1.

Key findings and insights
- State policy waivers, alongside national mission support, can reduce renewable power costs for green hydrogen projects by over 90%.
In renewable-rich states like Gujarat, Maharashtra, and Rajasthan, on-site solar power costs are as low as ₹2.1 per kilowatt-hour (US$0.26/kWh)[1] and may drop to ₹1.5/kWh ($0.018/kWh) by 2030 due to technological advancements. Off-site projects face transmission charges that can raise the landed cost of power by as much as 104%, depending on state-specific charges and regulations. Under subnational policies, some states, including Odisha and Maharashtra, offer lower or waived surcharges for green hydrogen projects, improving affordability and project feasibility. Waivers in transmission charges across states can reduce landed power costs up to more than 90%. Odisha is leading in this respect by offering an additional ₹3/kWh ($0.036/kWh) waiver. Telangana offers a similar waiver, yet higher up-front charges restrict the reduction in landed power costs to 50%. On-site projects can also benefit from capital subsidies, cutting costs by 30% on average. Odisha’s aggressive policies make it one of the most competitive states for green hydrogen production, slashing landed power costs by up to 94%.
- Stand-alone on-site green hydrogen projects with subnational capital expenditure (capex) subsidies can reduce the production cost by 20%–22%. However, these projects come with land and demand co-location constraints.
Stand-alone green hydrogen projects are among the most cost-competitive arrangements for hydrogen production, with costs ranging from $4.4/kg to $4.8/kg. Various states, including Maharashtra, Uttar Pradesh, and Odisha, offer capital subsidies of 25% to 35%, reducing power costs by 20%–22%. However, the cost gap between green and grey hydrogen remains significant — ranging from $1.6/kg to $3.2/kg. Scalability is also constrained by land availability and proximity to industrial demand centers, as transportation costs can undermine economic advantages. The optimal sizing of these projects depends on local renewable energy potential — with required solar capacities varying from 1.9 to 2.8 gigawatts (GW) to produce 50 kilotonnes per annum (ktpa) of hydrogen, which also requires large parcels of land.
- Projects connected to the Inter-State Transmission System (ISTS) or the Central Transmission Utility of India (CTU) are the first choice for most developers, because they offer production prices that are 20% to 30% lower than projects without subsidies connected to State Transmission Utilities (STU).
Green hydrogen production costs for projects connected to the ISTS range from $4.1/kg to $5.0/kg, influenced by factors like renewable energy sources, grid availability, and storage solutions (placement and technology). CTU-connected projects can offer 20% to 30% lower costs than STU-connected projects, which bear different types of state transmission charges. Although capital subsidies for green hydrogen initiatives can help reduce costs, they typically apply only to specific equipment like electrolyzers and batteries. For ISTS projects sourcing renewable energy from different states, local subsidies may not be applicable, limiting cost-saving potential. For example, in Uttar Pradesh, a 35% capital subsidy can lower the green hydrogen production cost by about 10% for battery-supported solar projects.
- At least 50% reduction in green hydrogen production cost across off-site projects is required to put them in a competitive range with grey hydrogen.
Transmission-related charges can raise the landed cost of power to 1.5–2.5 times the base electricity generation cost from renewable energy. Key factors in incentivizing green hydrogen production include the magnitude and duration of subsidies, which affect the final production costs. State-specific reductions due to waivers and incentives vary widely, from 1% in West Bengal to 61% in Odisha. Long-term economies of scale will enhance competitiveness, with production costs decreasing as projects scale up due to better resource utilization and technology. Odisha has emerged as a leader in cost competitiveness for green hydrogen. The state’s comprehensive incentive package could bring down green hydrogen costs to as low as $3/kg, which is roughly 42% below the average production cost across other states. Given the importance of waivers in the cost economics of STU-connected projects, in the long run, prices are bound to rise if state waivers are discontinued.
Critical considerations for project development
- Better system utilization beyond a threshold yields marginal gains only
Lower utilization rates of around 25% require approximately 2.5 GW of electrolyzer capacity for a project producing 100 ktpa, whereas increasing the utilization to 85% reduces the required capacity by 70% to 720 megawatts (MW). Currently, alkaline electrolyzer costs range from $500/kW to $1,400/kW, and at an average of $741.5/kW, capital requirements decrease from nearly $1.8 billion to ~$537 million when utilization rises from 25% to 85%. Thus, higher system utilization is one of the key priorities for developers. Higher system utilization also significantly reduces the levelized cost of hydrogen (LCOH), with a 22% reduction when increasing system utilization from 25% to 50% and an additional 9% reduction when increasing to 75%. However, gains beyond 75% system utilization are marginal, about 2%. By 2030, as electrolyzer costs decline, the need for up to 100% utilization becomes less critical, allowing for system oversizing without prohibitive capital outlay.
- Choice between battery energy, hydrogen storage or a combination offers flexibility to developers depending on their business models.
When planning green hydrogen projects, developers can optimize for battery storage, hydrogen storage, or a combination of both, significantly influencing project size. Battery storage enables theoretically up to 100% utilization, reducing the size of the electrolyzer required to 610 MW for a 100 ktpa project, but requires over 7 GW of oversized renewable energy (solar and wind) capacity. In contrast, hydrogen storage leads to around 33% utilization, necessitating a larger electrolyzer of approximately 1.9 GW but just 3 GW of renewable capacity. Whereas hydrogen storage limits excess power generation to nearly 20%, battery storage can yield up to 70% excess. The optimal configuration depends on the developer’s business model — and is likely to change as demand for renewable energy grows in India. Although battery storage is currently less economically favorable, cost differences are expected to narrow, potentially making the two options equally viable by 2030. High utilization rates from battery storage may lead to excess generation challenges but can also create additional revenue streams to offset investment costs. An ideal and optimized green hydrogen project would involve a strategic combination of both battery storage and hydrogen storage. This hybrid approach offers multiple advantages, balancing operational flexibility, cost-effectiveness, and resilience.
- The excess power produced from the oversizing of green hydrogen projects can generate additional revenue, helping to offset the LCOH.
Excess solar generation can vary significantly, ranging from 11% to 41% of total solar electricity produced, whereas excess generation with wind power is lower, between 0% and 12%. Wind is usually a complementary source to solar, resulting in smaller-scale installations. In resource-rich states like Rajasthan and Tamil Nadu, excess generation becomes more predictable, with 14% for solar and 2% for wind. This excess generation can unlock an additional flow of revenue through participation in the electricity market. For instance, Maharashtra’s combined solar-wind project has an excess of 22% for solar and 2% for wind. Selling this excess power at the fixed Green Day Ahead Market (GDAM)[2] price can offset the green hydrogen production cost by 15%, lowering it by $3.9–$4.6/kg, considering state transmission charge waivers. In Gujarat, similar project arrangements could reduce production costs by nearly 33%, bringing them down by $3.2–$4.7/kg — with the potential to decrease further with electricity charge waivers.
- Beyond cost considerations, the path from conceptualization to operationalization of green hydrogen projects faces numerous risks that can affect project viability.
There are numerous risks in the project development cycle that can impact their viability. Key risk factors include fluctuating renewable energy costs, regulatory uncertainties, technological challenges, and financial limitations. Green hydrogen production demands substantial capital and operational expenditures for installing electrolyzers and renewable infrastructure. Moreover, the technology, particularly electrolyzers, needs advancements to improve efficiency and durability, which are currently limiting factors. The availability and reliability of renewable power sources also play a crucial role, as variability can affect hydrogen production rates. Infrastructure development for grid integration, storage, and transportation is essential yet costly and underdeveloped. A complex regulatory landscape varies by region, complicating project navigation. Securing end-user adoption is vital for commercial viability, while financing hurdles arise from high costs and perceived risks. Additionally, supply chain disruptions from global dependencies can hinder raw material availability. Addressing safety concerns related to hydrogen handling and investment uncertainty in volatile markets is critical for the long-term success of green hydrogen initiatives.
The way forward
To unlock the full potential of green hydrogen in India, the following areas should be prioritized for future activities:
- Infrastructure development: Policymakers should focus on building robust infrastructure for grid integration, energy storage, hydrogen storage, and transportation. This will be crucial in order to support large-scale green hydrogen production and ensure reliable distribution across industrial hubs, minimizing variability in supply and optimizing energy usage.
- Assessment for India’s Green Hydrogen Backbone: The findings of this report should guide the creation of a comprehensive “Green Hydrogen Backbone” study. This will help design the necessary infrastructure and regulatory framework to support long-term growth, laying out the pathways to develop a robust green hydrogen ecosystem that can meet domestic and international demand.
- Enhanced local supply chains: Strengthening domestic manufacturing of key components like electrolyzers and renewable energy systems is vital. This will reduce India’s dependence on international markets, mitigate potential supply chain disruptions, and ensure a stable and scalable development pipeline for green hydrogen projects.
- Market creation and de-risking opportunities: The study primarily focuses on green hydrogen production pathways, but without addressing offtake risks, the sector may struggle to succeed. Stimulating market demand is essential, including demand aggregation and offering incentives to offset the green premium. Financial instruments or risk-sharing mechanisms can help ensure that a demand pull is created, complementing policy efforts to promote green hydrogen production.
Introduction
Development of green hydrogen projects is gaining momentum. The economic opportunity it offers straddles sustainability and industrial growth.[3] According to the Hydrogen Council’s estimates, more than $300 billion will be invested in the green hydrogen sector over the next decade.[4]
Across the globe, there has been a consistent policy push to support green hydrogen project development. Prominent is the US Inflation Reduction Act, which is offering a tax credit of up to $3/kg of “clean hydrogen” produced.[5] The policy support for tax equity and transferability would unlock $20 billion to finance green hydrogen projects.[6] Similarly, the EU launched the European Hydrogen Bank to unlock private investments in hydrogen value chains, both within the EU and globally, by connecting renewable energy supply to EU demand and addressing the initial investment challenges.[7]
For green hydrogen supply-chain readiness, total investment requirements are an estimated $9.4 trillion by 2050, of which more than 30% is expected to flow to countries with developing economies like India.[8]
India’s National Green Hydrogen Mission, announced by the Ministry of New and Renewable Energy (MNRE), is spearheading the development of the country’s green hydrogen ecosystem.[9] The mission allocates $2.3 billion for supporting the green hydrogen value chain through to 2030.[10]
In addition to national initiatives, state-level policy efforts, including incentives such as capital and operational subsidies and movement to identify green hydrogen as a “sunrise sector,”[11] can help shorten the timeline for green hydrogen project development.[12] More than 15 states are supporting the green hydrogen sector either through dedicated policy or as a part of other industrial, renewable, or land allocation policies.
Beyond government support, the private sector is also championing green hydrogen ecosystem development in India. Industry leaders across a range of sectors have announced projects for green hydrogen and its derivatives, with a capacity of some 12 million tonnes per annum for end products and end uses including ammonia, exports, power-to-x products,[13] methanol, blending with gas, etc.[14] This announced volume is equivalent to 20 GW of electrolyzer capacity.
To date, India has approved projects worth $2 billion.[15] The investments are anticipated to be more than $12 billion in the coming years for green hydrogen production.[16]
Though there is consensus among industrial leaders on the potential of green hydrogen, approaches to project configuration vary based on the project’s size, end-use expectations, and renewable energy (RE) availability, which are the three key determinants of project competitiveness.[17]
Project scale significantly influences the approach to be adopted. Small-scale projects, such as pilot initiatives, assess feasibility and address localised energy needs with minimal investment. Medium-scale projects serve regional demands and specific industrial applications, balancing size with impact. Large-scale projects, requiring substantial investment and coordination, aim for national or international impacts, often targeting export-oriented production, serving large clusters and hubs of domestic consumption, or a combination of both.
End-use expectations also dictate project requirements. Industrial applications, like high-temperature processes in steel manufacturing and as feedstock in chemicals and fertilizers, demand continuous and high-volume supplies of hydrogen or ammonia. On the other hand, in heavy-duty transportation, hydrogen fuel cell electric vehicles require hydrogen refueling stations and distribution networks supported by decentralized production from small- to medium-sized projects.
The availability of affordable and reliable renewable power is the third crucial parameter for green hydrogen project development. Solar power is ideal for regions with abundant sunlight, whereas wind power suits coastal and offshore locations. A combination of wind and solar resources can ensure a degree of stable energy supply and better project utilization. The wide availability of the grid, coupled with adequate policy waivers related to wheeling and transmission charges, facilitates connection of high-potential renewable energy sites to consumption centers, addressing challenges related to resource availability and land constraints. These pathways influence the logistical setup of projects on the ground.
The variation in sourcing power for hydrogen production can be witnessed around the globe. Large projects like BIG HIT: Building Innovative Green Hydrogen Systems in Isolated Territories: A Pilot for Europe; H2 proposition Zuid-Holland/Rotterdam; H2ISEO: An Italian hydrogen valley for sustainable mobility; and SoHyCal, a solar photovoltaic hydrogen production plant in central California, demonstrate diverse approaches.[18]
These projects use different power sources, such as solar photovoltaic (PV), offshore wind, and biofuels. They also employ various transportation and storage methods, including containers, pipelines, and cylinders, for end uses like export and fueling cars, trucks, and trains. These projects reflect the broad range of factors involved, including the type of energy used, the scale of the project, and regional economic conditions.
Despite growing momentum in project development, insights on techno-economics, project feasibility, and risks in the system remain limited. Comprehensive economic analysis on the costs associated with building and retrofitting facilities is inadequate, leaving uncertainties about the long-term financial viability of these projects. Additionally, there are significant knowledge gaps regarding the integration of green hydrogen systems with existing energy grids and industrial processes. The feasibility of large-scale projects is uncertain due to technical challenges, regulatory hurdles, and the need for substantial investments. Risk assessment frameworks for green hydrogen projects are also underdeveloped, making it difficult to evaluate potential risks and devise mitigation strategies. These risks include technological failures, supply chain disruptions, market volatility, and policy changes.
To address the identified gaps, this study focuses on offering insights into the following three elements:
- First, it examines various configurations of green hydrogen project development.
- Second, it delves into the techno-economic aspects, encompassing detailed analysis of production costs, efficiency enhancements, and potential cost reductions facilitated by technological advancements and economies of scale. Understanding these factors is crucial for enhancing the competitiveness of green hydrogen relative to conventional energy sources.
- Third, the study provides a comprehensive exploration of decision-making considerations for project developers, such as project utilization strategies, storage options, and system oversizing. It also discusses the interplay of these choices with different systemic risks that developers must mitigate to ensure successful and profitable investments.
Scope of the Study
System overview and boundaries
The green hydrogen value chain is much broader than typically considered when assessing production costs and ecosystem readiness. It can be divided into two primary areas:
- Renewable electricity: This encompasses the generation, transmission, and distribution of green power.
- Green hydrogen: This includes production, transportation, storage, and consumption across various end-use sectors (see Exhibit 1).
This report focuses on analyzing production pathways for green hydrogen, emphasizing the upstream stages of renewable electricity, the production of green hydrogen, and the co-located hydrogen storage with the production unit. It does not delve into the conversion of green hydrogen into derivatives like ammonia or methanol, nor its adoption across different sectors as fuel or feedstock.
There are multiple pathways to procure renewable power for green hydrogen projects, each subject to different charges for transmitting power. Consequently, the landed cost of green power — and therefore the cost of green hydrogen production — is significantly influenced by the location of the green hydrogen production and renewable energy assets.

Assessment locations
To provide a comprehensive national overview of green hydrogen production costs and offer insights from a project development perspective while accounting for regional differences, this report evaluates green hydrogen production costs across 17 states (see Exhibit 2). These states are either pioneers in developing the green hydrogen ecosystem or have the potential to become leaders in the field.

Three key variables were considered when selecting the states: existing policy momentum and acceptance of green hydrogen, existing green hydrogen demand centers, and interest from public or private industry players in investing in green hydrogen or related projects. However, this list (Exhibit 3) should be seen as representative rather than exhaustive, encompassing states with different subnational economic structures, availability of renewable resources, and government approaches to developing a green hydrogen ecosystem.

For the analysis, the production locations are selected based on either the presence of industries with green hydrogen demand or the area’s prospects to become a green hydrogen hub due to its proximity to promising demand centers. Conversely, solar and wind locations within the state are chosen based on existing or committed renewable capacities. For the optimization model used in the study, specifying the locations of production, solar, and wind is critical. However, these locations are representative of possible projects and do not imply that they are the only possible sites in the state. Nonetheless, the insights derived within each state will remain consistent.
Scenario framework
In this study, multiple project configurations have been considered (see Exhibit 4). These scenarios are based on various methods of procuring renewable power and explore different potential configurations for co-locating green hydrogen production units with renewable energy assets. Additionally, the configurations take into account the intent of developers and consumers to invest in renewable energy assets.
Access to affordable and reliable green power is non-negotiable in order to produce green hydrogen at scale. In India, power can be obtained through different short- and long-term procurement models, including on-site production to third-party power purchase agreements (PPAs), green tariffs, and renewable certificates. Both long- and short-term procurement models pose different advantages and challenges, providing a range of options for consumers based on their needs.[19] Long-term procurement models provide stability and predictability in renewable energy procurement, which is important for large-scale green hydrogen production. Short-term procurement models offer more flexibility and are useful for consumers who need to balance fluctuations in their demand.[20]
Short-term power procurement models include green tariffs, Green Term Ahead Market (GTAM), renewable energy certificates, and peer-to-peer trading. Long-term procurement models include on-site capex model, third-party on-site PPA, third-party off-site PPA via open access, captive/group captive via open access, green energy open access, virtual power purchase agreements via bilateral transaction, and community solar (see details in Appendix B).
This study focuses on long-term power procurement models to create the project scenarios.
By examining these diverse scenarios, the study aims to provide a comprehensive understanding of the cost and logistical implications of different green hydrogen production strategies, taking into consideration the varying degrees of integration between hydrogen production facilities and renewable energy sources.
Projects can be connected to either the Inter-State Transmission System (ISTS) or the State Transmission Utility (STU)/Distribution Companies (DISCOM) system. ISTS-connected projects allow developers to avoid state electricity charges, but connectivity is not always possible. However, the Government of India has waived interstate transmission charges, so the only power transmission costs incurred are from transmission losses between the renewable site and the green hydrogen production unit connected to ISTS. This makes ISTS-connected projects technically similar to on-site projects behind the meter.

These scenarios are designed to offer a simplified yet comprehensive array of potential project configurations and their costs. The proposed arrangements, though exhaustive in scope, acknowledge that real-world project development can differ significantly based on several factors. Economic feasibility and profitability considerations by developers, the policy ecosystem in the region, and consumer expectations regarding demand frequency and volumes all play crucial roles in shaping the final project configurations. By exploring these variables, the study aims to capture a broad spectrum of possibilities, providing valuable insights into how different procurement methods, co-location strategies, and investment intents can influence the overall costs and operational dynamics of green hydrogen production projects. This approach ensures that the scenarios remain relevant and adaptable to the diverse conditions and challenges encountered in actual project development.
National and State Policies: Waivers and Incentives for Green Hydrogen Production
At the most fundamental level, the techno-economic feasibility of the project depends upon two critical factors: cost of renewable power and capital cost of equipment, particularly electrolyzers. Currently the production cost of green hydrogen is significantly higher than that of grey hydrogen. Grey hydrogen costs $1.5–$1.6/kg in a stable market but could soar to a range of $3–$7.5/kg due to liquefied natural gas market disruptions.
The landed cost of renewable power plays a critical role in determining the final levelized cost of green hydrogen production. As highlighted, it accounts for up to 70% of the LCOH, making it the most important variable to optimize for competitive green hydrogen production.
Landed cost of renewable power and impact of state policy
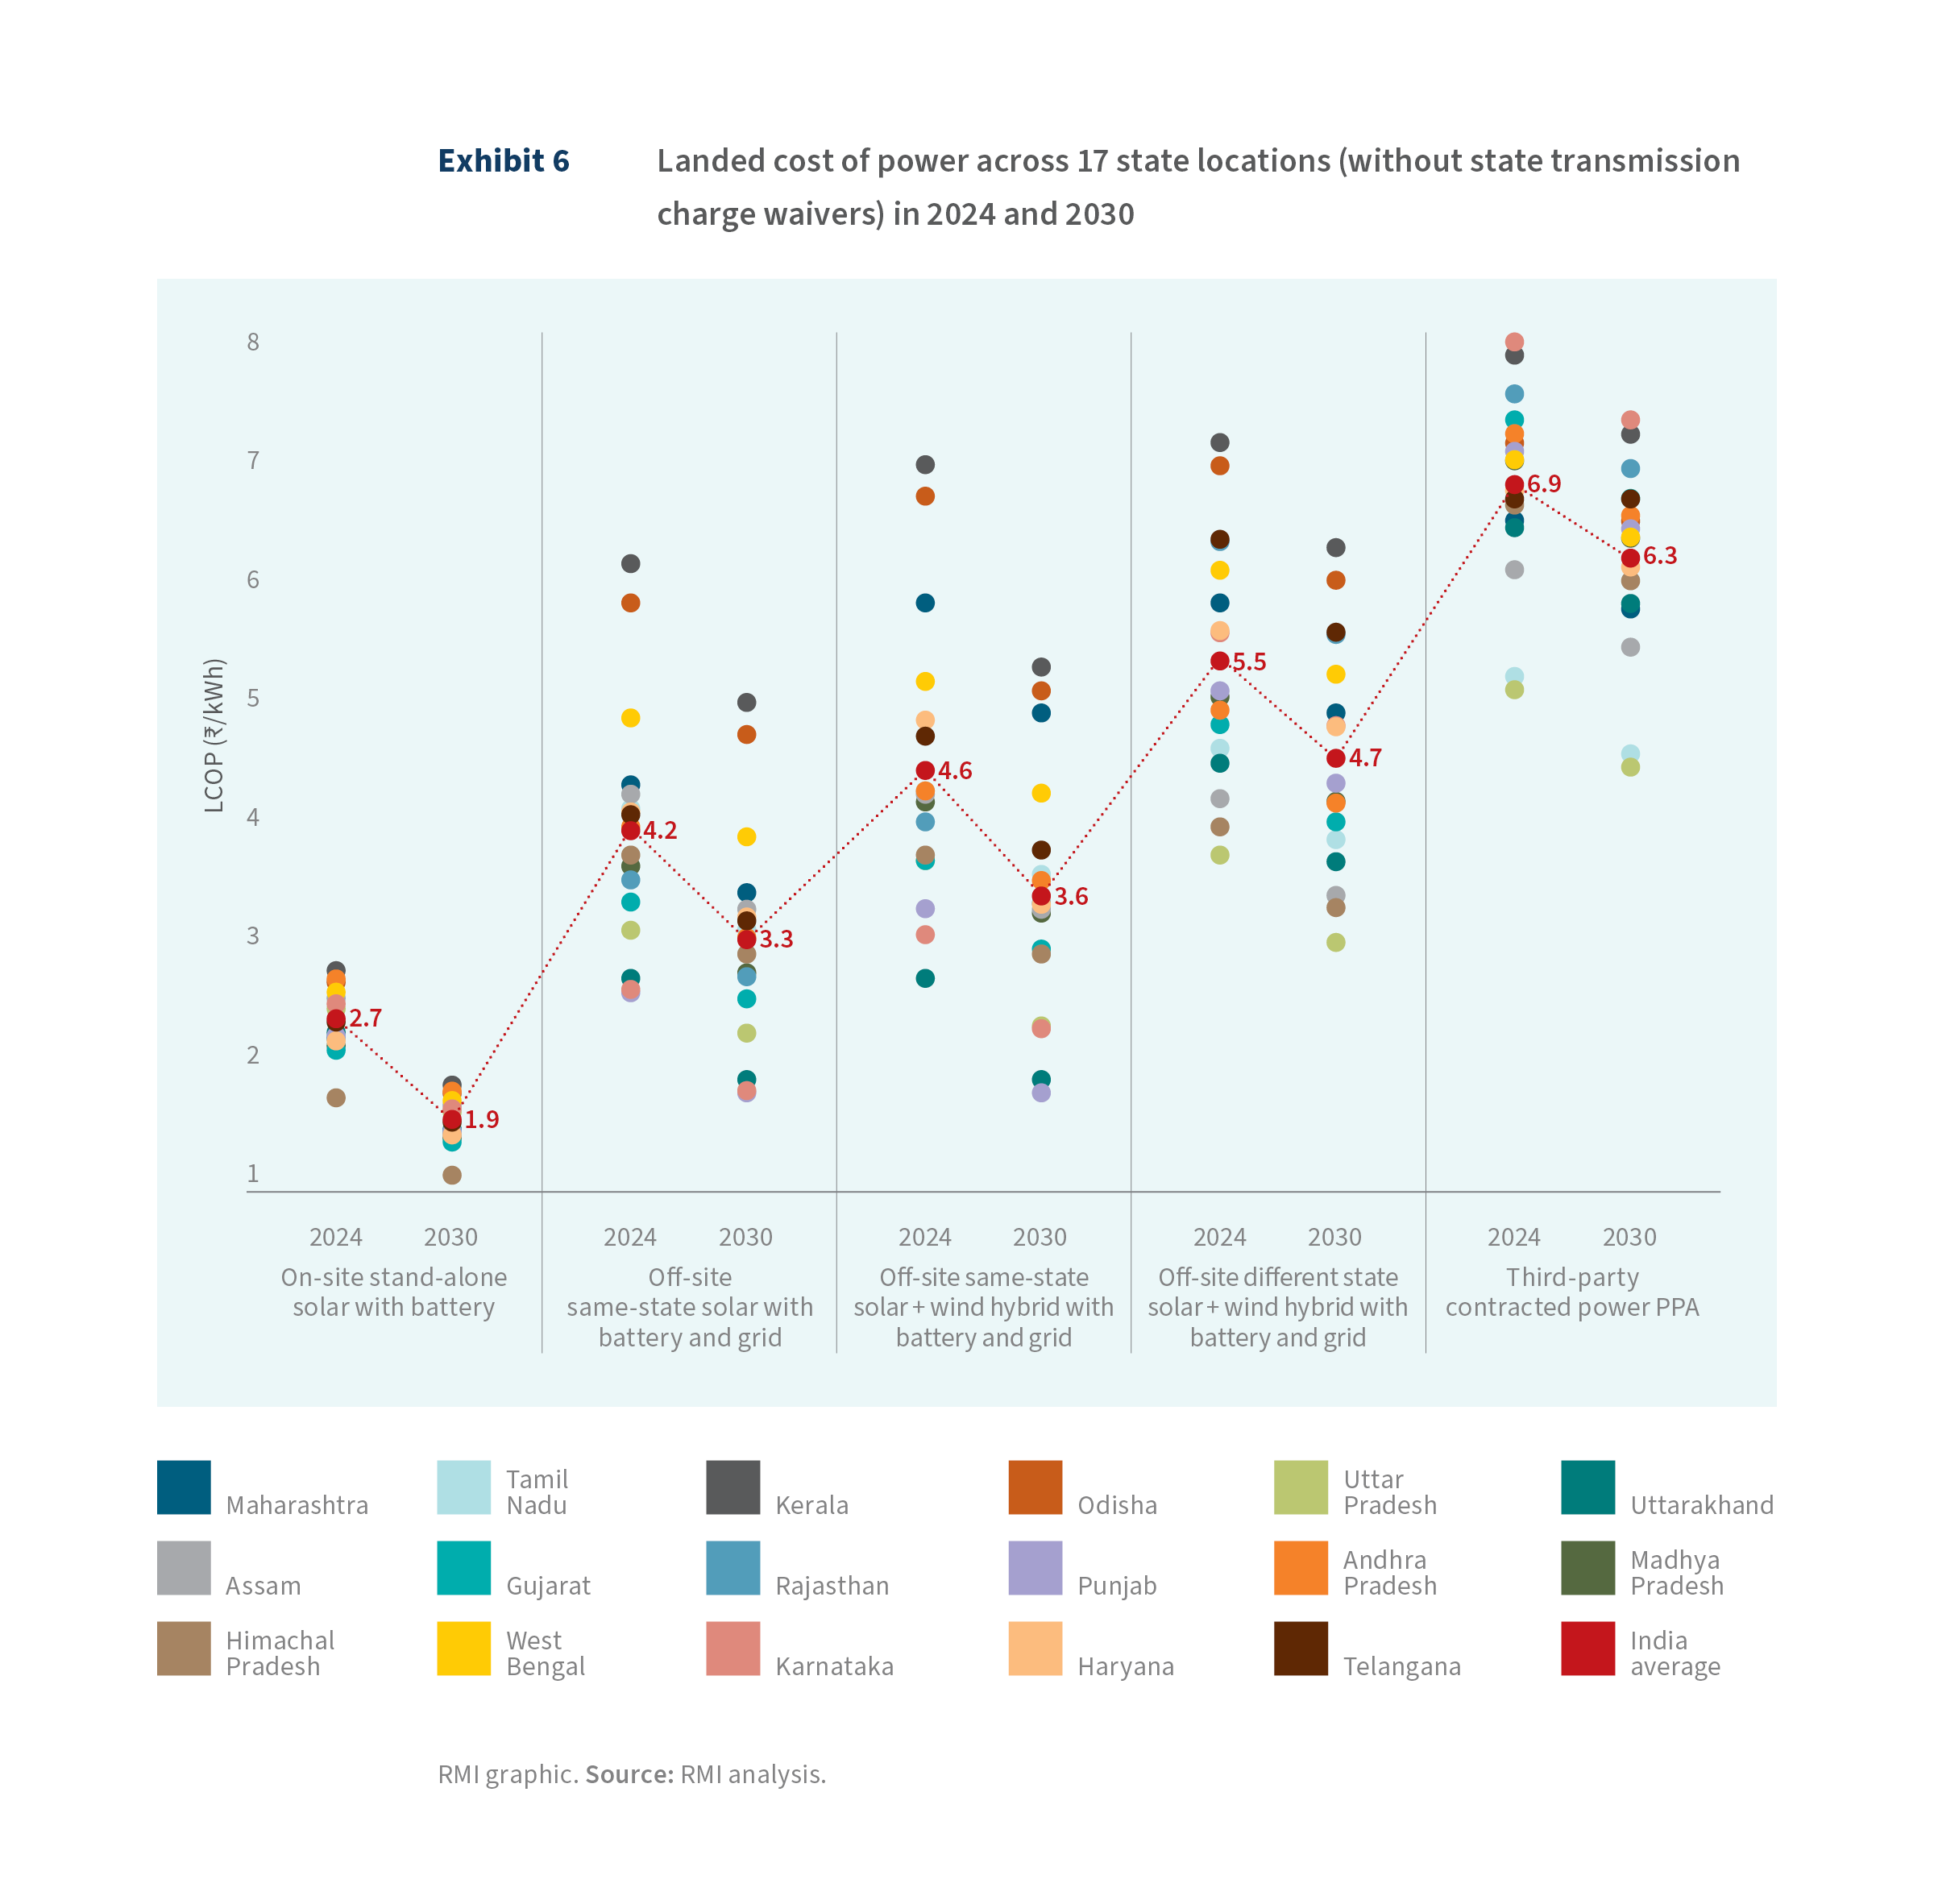
This study analyzes the landed cost of power across 17 states, as outlined in the Assessment Locations section, focusing on both on-site and off-site power generation projects. For on-site solar generation projects, where the cost of generating power is the same as the landed cost (since no transmission of electricity is involved), the current price of power can be as low as ₹2.1/kWh ($0.026/kWh). This is particularly true in renewable energy-rich regions like Gujarat, Maharashtra, and Rajasthan, which have favorable conditions for solar power generation. By 2030, due to advancements in technology, increased efficiencies, and economies of scale, this cost is expected to decrease by 30% to ₹1.5/kWh (US0.018/kWh).
In contrast, states like Andhra Pradesh, Kerala, and Odisha face higher costs for solar generation, with prices approaching ₹3.0/kWh ($0.036/kWh) due to less favorable climatic conditions, land availability issues, and less developed solar infrastructure. Across the 17 states examined, the average cost of solar power is currently around ₹2.7/kWh ($0.033/kWh), with a projected decrease to ₹1.9/kWh ($0.023/kWh) by 2030 (see Exhibit 6). This expected reduction in costs is driven by the declining price of solar panels, improved installation methods, and better grid integration for renewable energy.
For off-site projects, the situation becomes more complex due to state-imposed transmission charges. These charges, levied when power is generated in one state and transmitted to another or even within the same state, significantly increase the landed cost of power. Depending on the state and the specific project configurations, these charges can raise the landed cost by 4% to 104% — meaning considerable variability of project economics. The size of the increase largely depends on the state’s transmission infrastructure, the regulatory environment, and the nature of the power purchase agreement.
State-level transmission charges are a major contributor to the increased landed cost of green power. Across states, the share of these charges in the total landed cost ranges from 10% to 56%. States such as Gujarat, Karnataka, Tamil Nadu, and Uttar Pradesh tend to have lower transmission and wheeling charges, with the share of transmission costs being below the average of around 33% across the 17 states. On the other hand, Kerala, Maharashtra, Odisha, and Rajasthan states have higher charges, significantly increasing the overall landed cost of power in these regions.
For intra-state solar projects — where both the generation site and the green hydrogen production facility are in the same state — the price increase in the landed cost of power is relatively low, around 40% compared with stand-alone solar projects. These projects benefit from captive assets (where companies generate and use their own power) and incur only limited transmission and wheeling charges. However, when projects rely on third-party contracted power supply, the price increase can be much higher, averaging around 155% — primarily due to the higher transmission charges and fees associated with contracting power from external sources.
Additionally, projects that import power from other states — for example, solar power from Rajasthan or wind power from Tamil Nadu — face higher landed costs due to elevated transmission charges for moving power across state borders. These higher charges are often imposed because of the additional complexity and infrastructure needed to transport electricity over longer distances and significantly affect the overall cost structure for green hydrogen projects.
Third-party contracted power is significantly more expensive than captive or group captive setups due to the imposition of additional charges, such as cross-subsidy surcharges and wheeling surcharges. These charges are typically levied when power is purchased from third-party sources and transmitted across states or regions. In contrast, these surcharges are often waived for captive and group captive use cases, where companies generate and consume their own power or form a consortium to do so. This waiver makes captive setups much more economical for green hydrogen projects.
In scenarios involving third-party contracted power, the landed cost of power can increase substantially — by 80%–225%, depending on the state and the specific regulatory framework governing cross-subsidy and transmission charges. This dramatic rise in costs is especially evident in states with high regulatory fees and charges for power purchased from external sources.
However, some states present exceptions to this trend. For instance, Tamil Nadu and Uttar Pradesh impose relatively lower surcharges for third-party contracted power, making it more affordable than in other states. Additionally, states like Maharashtra have taken a progressive stance by waiving surcharges entirely for green hydrogen projects, further reducing the landed cost of power in these cases.
In states where these additional surcharges are lower or waived, the landed cost of power for green hydrogen projects can fall below the national average of ₹6.9/kWh ($0.084/kWh). This provides a competitive advantage for green hydrogen projects in these regions.
State policies offering various waivers on electricity charges reduce the landed cost of power for green hydrogen projects, from 2% to 94%, depending on the project structure and the state’s policy landscape. For off-site projects, which purchase electricity from the grid, these waivers play a crucial role in reducing both capital expenditure (capex) and operational expenditure (opex) by lowering electricity tariffs, which are one of the most significant components of hydrogen production costs.
However, for on-site projects — where power is generated directly at the project site through renewable energy sources like solar or wind — electricity waivers are not applicable since the power is not sourced from the grid. In these cases, capital subsidies become critical. These subsidies incentivize investment in renewable energy assets, enabling cost reductions through reduced up-front capital requirements. On average, capital subsidies for on-site projects can reduce power costs by about 30% (see Exhibit 7), lowering overall hydrogen production costs.
That said, not all states offer comprehensive support for on-site projects. For example, although states such as Andhra Pradesh, Punjab, and West Bengal have introduced dedicated green hydrogen policies, they do not offer capital investment subsidies for renewable energy assets. As a result, there is little to no cost reduction in power for on-site projects under these states’ policies.
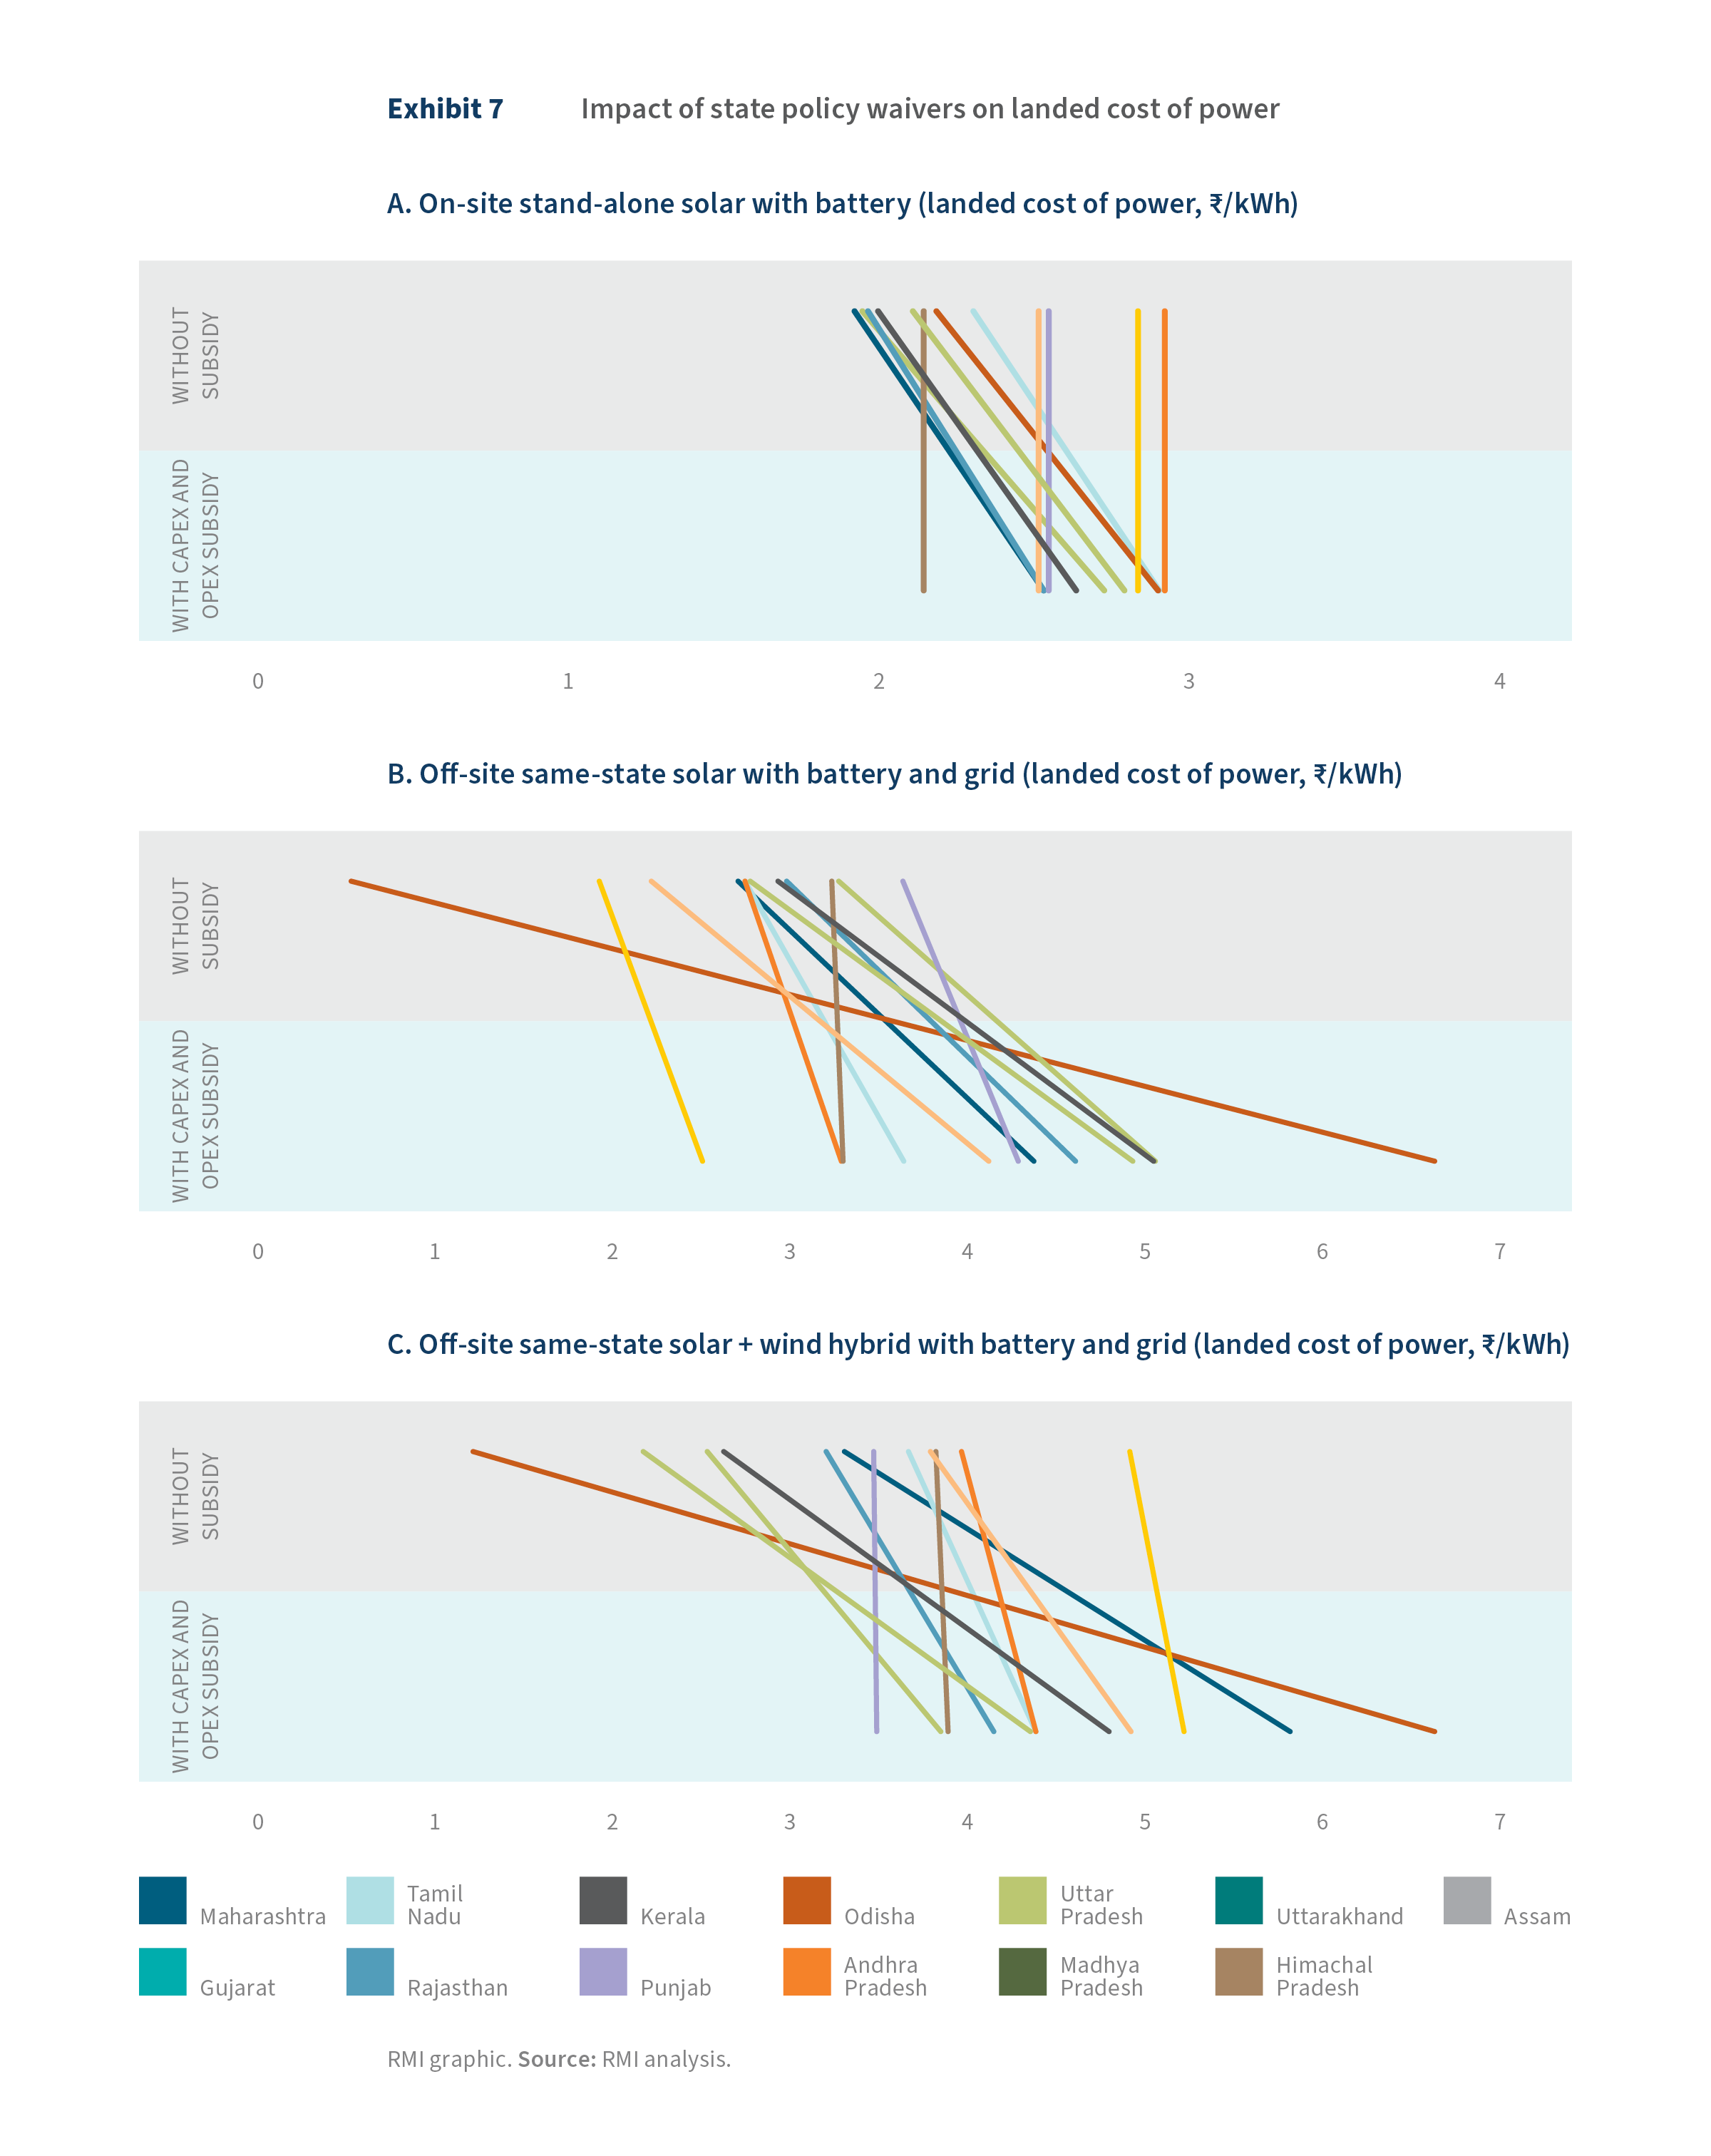
In contrast, off-site projects can take advantage of both capital subsidies and electricity charge waivers. These combined subsidies can reduce the cost of power by 2%–40%, with the smallest reduction observed in Himachal Pradesh, where baseline electricity charges are already minimal. In Rajasthan, where baseline charges are higher, more substantial subsidies lead to the largest reductions. In industrialized states like Maharashtra and Uttar Pradesh, the post-subsidy cost of power is notably lower, reaching ₹2.8/kWh and ₹2.1/kWh ($0.034/kWh and $0.026/kWh), respectively.
Among all states, Odisha stands out as a leader in driving down power costs for green hydrogen production. In addition to the capital subsidies and electricity charge waivers offered under its Industrial Promotion Policy, Odisha provides an additional waiver of ₹3/kWh ($0.036/kWh) on electricity prices, a unique incentive not currently matched by any other subnational policy. This combination of subsidies leads to a remarkable reduction of power costs in Odisha, slashing them by around 50%, and when combined with the additional waiver, this reduction can reach as much as 94%.
These reductions in power costs are crucial to making green hydrogen economically competitive. Detailed discussions on the cost implications across different project configurations are provided in the following sections.
Stand-alone on-site projects
Stand-alone green hydrogen projects are typically designed to operate independently from the electrical grid, relying exclusively on on-site renewable energy sources like solar or wind, and complemented by battery storage systems, to power the electrolysis process. However, some projects may have limited grid connectivity to supplement renewable energy during periods of low generation, while still adhering to strict carbon intensity thresholds.
For example, a project could be connected to the grid as long as the associated carbon emissions do not exceed 2 kg of CO2 per kg of hydrogen produced, criteria set by the MNRE.[i] This setup allows for operational flexibility while maintaining the environmental integrity of green hydrogen production.
This project configuration stands out for its exceptional cost competitiveness compared with alternative arrangements, primarily due to the absence of transmission charges that typically affect grid-connected projects. Without transmission charges, the ongoing operational costs for the project are reduced, directly lowering the overall cost of producing green hydrogen.
Consequently, with fewer recurring charges, the project can achieve better profit margins, especially in competitive markets where small cost reductions can make a significant difference. Transmission charges can fluctuate based on grid congestion, energy demand, or regulatory changes. By avoiding the grid altogether, stand-alone projects eliminate the uncertainty and volatility associated with these charges, offering more predictable operating costs.
Stand-alone green hydrogen projects represent one of the most economical project setups, with production costs ranging from $4.4/kg of hydrogen to $4.8/kg. Projects that completely avoid using grid electricity and rely solely on battery storage tend to produce hydrogen at a lower cost than those that use grid electricity to maintain a stable base load. Although using grid electricity offers flexibility, especially in managing fluctuations in renewable energy supply, it introduces two key risks:
- Higher production costs: Incorporating grid electricity increases overall production costs, as grid electricity tariffs are relatively high across many states.
- Emissions considerations: Although these projects can still be classified as “green” due to achieving carbon intensities below 2 kg CO2/kg H2, they are not completely emissions-free. This partial reliance on fossil-fueled grid power poses challenges, particularly for export-oriented projects, where international markets may demand stricter zero-emissions credentials.
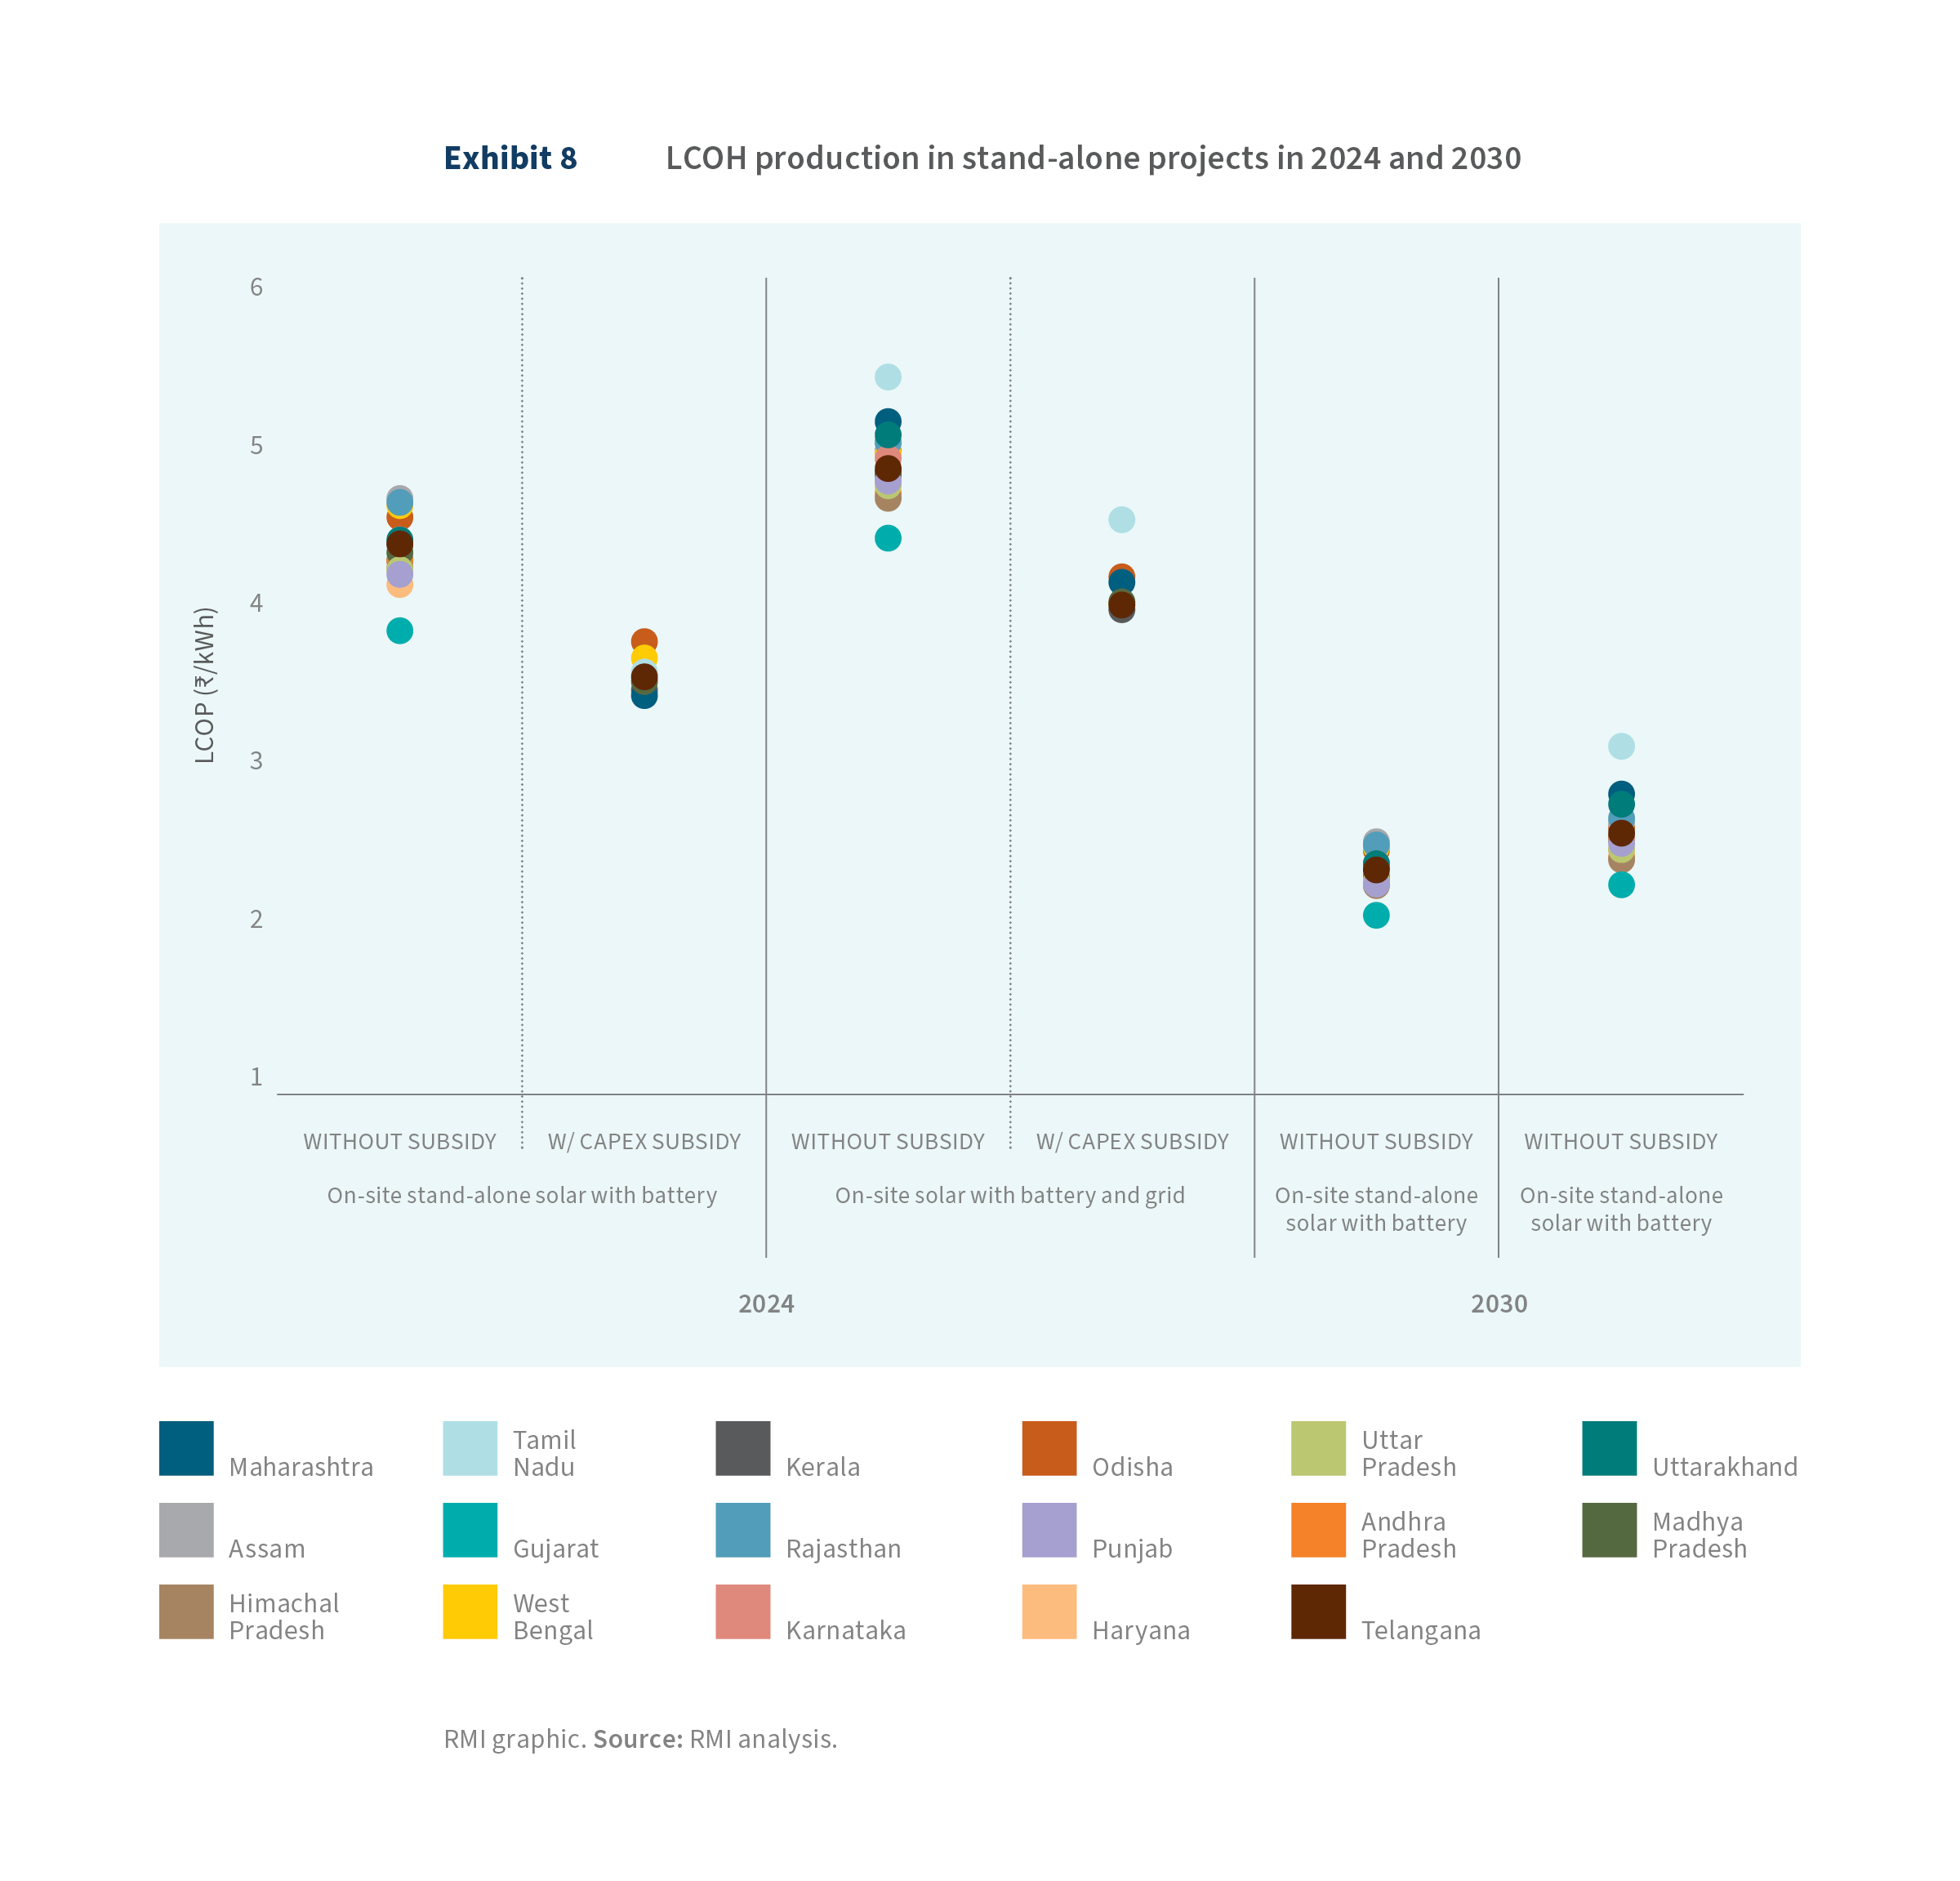
The cost of hydrogen production varies significantly across states. Andhra Pradesh, Karnataka, and Odisha face some of the highest renewable energy generation costs, which can push the hydrogen production price above $4.5/kg. In contrast, states like Gujarat, Maharashtra, and Uttarakhand offer some of the most attractive production prices, driven by more favorable renewable energy conditions.
An interesting exception is Himachal Pradesh, where hydrogen production costs are unusually low — less than $4/kg. This is primarily due to the state’s availability of more than 125 days of solar energy and a capacity utilization factor (CUF) of over 20%,[ii] which contributes to its lower costs. However, despite this advantage, Himachal Pradesh is not considered a prime candidate for large-scale green hydrogen production. The challenging terrain makes it difficult to install large solar facilities, and the absence of a significant industrial consumer base in the region limits the feasibility of scaling up hydrogen production.
Although the project structure may be similar across regions, the local renewable energy potential is a significant factor in sizing green hydrogen projects. For example, in an on-site solar and battery-connected project, the optimal size of the solar component for producing 50 ktpa of green hydrogen can vary widely — from 1.9 to 2.8 GW. This range reflects regional differences in solar irradiance and resource availability, with the highest capacity required in Andhra Pradesh and one of the lowest in Gujarat.
Key industrialized states like Maharashtra, Gujarat, Tamil Nadu, Odisha, and Uttar Pradesh, all of which are positioning themselves as leading green hydrogen producers, require an average solar capacity of approximately 2.3 GW for similar projects. The sizing of electrolyzers also shows a similar variation. The required electrolyzer capacity can range from 515 to 670 MW. Battery capacity, which is essential for storing energy to manage fluctuations in renewable supply, also varies significantly. Gujarat has the lowest battery size requirement at around 280 MW, whereas Himachal Pradesh requires battery capacity of approximately 555 MW. Additionally, the variation in green hydrogen storage requirements is considerable. For example, Karnataka has the highest storage requirement at around 916 tonnes, which is three times that needed in Kerala.
Since these projects do not incur transmission charges, owing to their on-site nature, capital subsidies from state governments become the key financial incentive to reduce overall production costs. However, not all states, even those with dedicated green hydrogen policies, offer capital subsidies. The availability of such subsidies has a significant impact on the viability and competitiveness of these projects. In states where subsidies are available, they can substantially lower capital costs, directly reducing the cost of green hydrogen production.
Several states, including Maharashtra, Uttar Pradesh, Odisha, Rajasthan, and Tamil Nadu, offer capital subsidies as part of their subnational policies to support green hydrogen projects. These subsidies typically range from 25% to 35%, with Uttar Pradesh providing the highest incentives due to an economic booster package layered on top of the capital subsidy.
On average, these capital subsidies result in a 20%–22% reduction in power costs for green hydrogen production. Although this represents a significant cost decrease, there remains a considerable gap between the cost of green hydrogen and its fossil fuel-based counterpart, grey hydrogen. This gap underscores the need for further financial and technological support to bring green hydrogen closer to cost parity with grey hydrogen.
The anticipated decline in production costs from 2024 to 2030 is even more substantial, with a projected average reduction of 46%. This decrease highlights the importance of technological advancements and economies of scale as the hydrogen sector matures. By 2030, the cost of producing green hydrogen is expected to drop from approximately $4.4/kg to $2.4/kg, driven by falling costs in renewable energy, electrolysis technology, and increased infrastructure development.
Although on-site stand-alone green hydrogen projects offer attractive cost economics by avoiding transmission costs and fully utilizing renewable energy, several critical constraints can limit their scalability and effectiveness. These constraints primarily concern the availability of land and proximity to demand centers.
Land availability
Solar and wind energy generation is land intensive. Solar power typically requires 3–5 acres per megawatt, and even more land is needed for wind energy installations due to the spacing needed between turbines. A large-scale green hydrogen facility, particularly one producing 50 ktpa, could require several thousand acres.
Not all regions have large contiguous tracts of land available for renewable projects. Additionally, land that is flat, is not prone to flooding, and has optimal solar or wind potential may be scarce. In densely populated states or regions with competing land uses (agriculture, industry, urban development), acquiring suitable land becomes even more challenging. Land acquisition can also be complicated by legal regulations, ownership disputes, and environmental considerations.
In regions where land is available, it might be prohibitively expensive, especially in proximity to industrial hubs or areas with high renewable potential. The cost of land acquisition — which is not considered in the current LCOH — can substantially increase capital expenditure, undermining the cost advantages of stand-alone projects.
Proximity to demand centers
Green hydrogen is often targeted at industrial sectors like fertilizers and refineries, which require a continuous and high-volume supply of hydrogen. Proximity to these demand centers is a critical factor for the success of on-site stand-alone projects.
If the hydrogen production site is far from industrial demand centers, the costs associated with transporting hydrogen (in either gas or liquid form) can significantly erode the economic benefits of on-site production.
Storing hydrogen for extended periods requires expensive infrastructure (such as high-pressure tanks or cryogenic storage), and the farther from demand centers, the larger the storage requirements. Additionally, distribution networks for hydrogen may need to be built to transport it from production sites to consumers, adding to capital and operational costs.
CTU-connected projects
Projects connected to the CTU or the ISTS are gaining attention from developers due to their ability to offer highly competitive production costs. This advantage primarily stems from the financial incentives and exemptions provided under the National Green Hydrogen and Ammonia Policy of 2022. Specifically, the policy waives CTU charges, enabling developers to minimize operational expenses. These cost savings translate into more favorable project economics, making CTU-connected projects particularly attractive for large-scale green hydrogen and ammonia production.
The ISTS is a network of high-voltage transmission lines that link generation centers to load centers across states. ISTS helps balance the national grid by transmitting electricity from surplus regions to deficit regions. It plays a key role in the integration of renewable energy projects, particularly large-scale solar and wind, by ensuring connectivity from remote generation sites to demand centers. ISTS facilitates the movement of electricity across states, which is crucial for interstate power trading under the open access regime. This enhances market competition and optimizes the utilization of generation assets.
Green hydrogen developers are keen to secure ISTS connectivity as they can source electricity from renewable energy plants in different states, ensuring a consistent and reliable power supply. This is especially important in regions with less favorable conditions for renewables. Additionally, green hydrogen projects can benefit from hybrid renewable energy setups, such as a combination of solar and wind, enabled by ISTS connectivity. This ensures round-the-clock energy availability, allowing hydrogen plants to operate efficiently even when one energy source (like solar) is unavailable.
Exhibit 9 highlights the LCOH production in a CTU-connected project. In this analysis, we assume that the green hydrogen production project is connected to the CTU network and is sourcing solar power from Rajasthan and wind power from Tamil Nadu. This project is connected to the grid to source renewable power. For the baseload needed to manage ramping up and down of the electrolyzer, the project can rely on the battery or purchase electricity from the grid at industrial tariffs, with the emissions constraint of 2 kg CO2/kg H2.
The production cost for green hydrogen projects connected to the ISTS can vary between $4 and $5 per kg of hydrogen, depending on the specific project components and configuration. This range reflects factors such as the inclusion of renewable energy sources (solar, wind), grid availability, and storage solutions. Projects connected to ISTS generally have more favorable economics, with costs being 20%–30% lower than those of STU-connected projects, which are often subject to multiple state-level transmission charges. These state charges can significantly inflate the cost of electricity, which is the largest operational expense in green hydrogen production.
In projects designed with a mix of grid connectivity, solar, and wind energy, battery requirements are typically limited. This is because wind and solar energy complement each other in terms of generation timing, and the grid acts as a balancing mechanism, allowing excess energy to be exported and any deficits to be met through grid power. However, in projects without access to both the grid and wind energy, batteries become essential to ensuring a steady supply of electricity, particularly when solar energy is unavailable (e.g., at night or during low-sunlight conditions). In such configurations, the share of battery-related costs (capital and operational expenditures) make up about 5% of the overall LCOH.
Similarly, in projects that have access to grid power and wind energy, hydrogen storage infrastructure is found to make up around 6% of LCOH. This is because the combination of solar, wind, and grid access ensures more continuous power generation, limiting the need for hydrogen storage to cover periods of low energy generation. In contrast, for projects relying solely on solar power, the storage component becomes critical to maintaining a consistent supply of hydrogen to consumers. In such cases, the share of storage costs rises substantially, contributing up to 20% of LCOH, as larger hydrogen storage systems are needed to bridge the gaps in solar generation.
These projects can also take advantage of capital subsidy incentives available for green hydrogen initiatives; however, these subsidies typically apply only to electrolyzers, batteries, and certain other plants and machinery. In the case of ISTS projects, where developers source renewable energy from different states, the capital subsidies provided by the state of production may not apply to the renewable energy asset. This limitation reduces the cost-saving potential that such subsidies can offer.
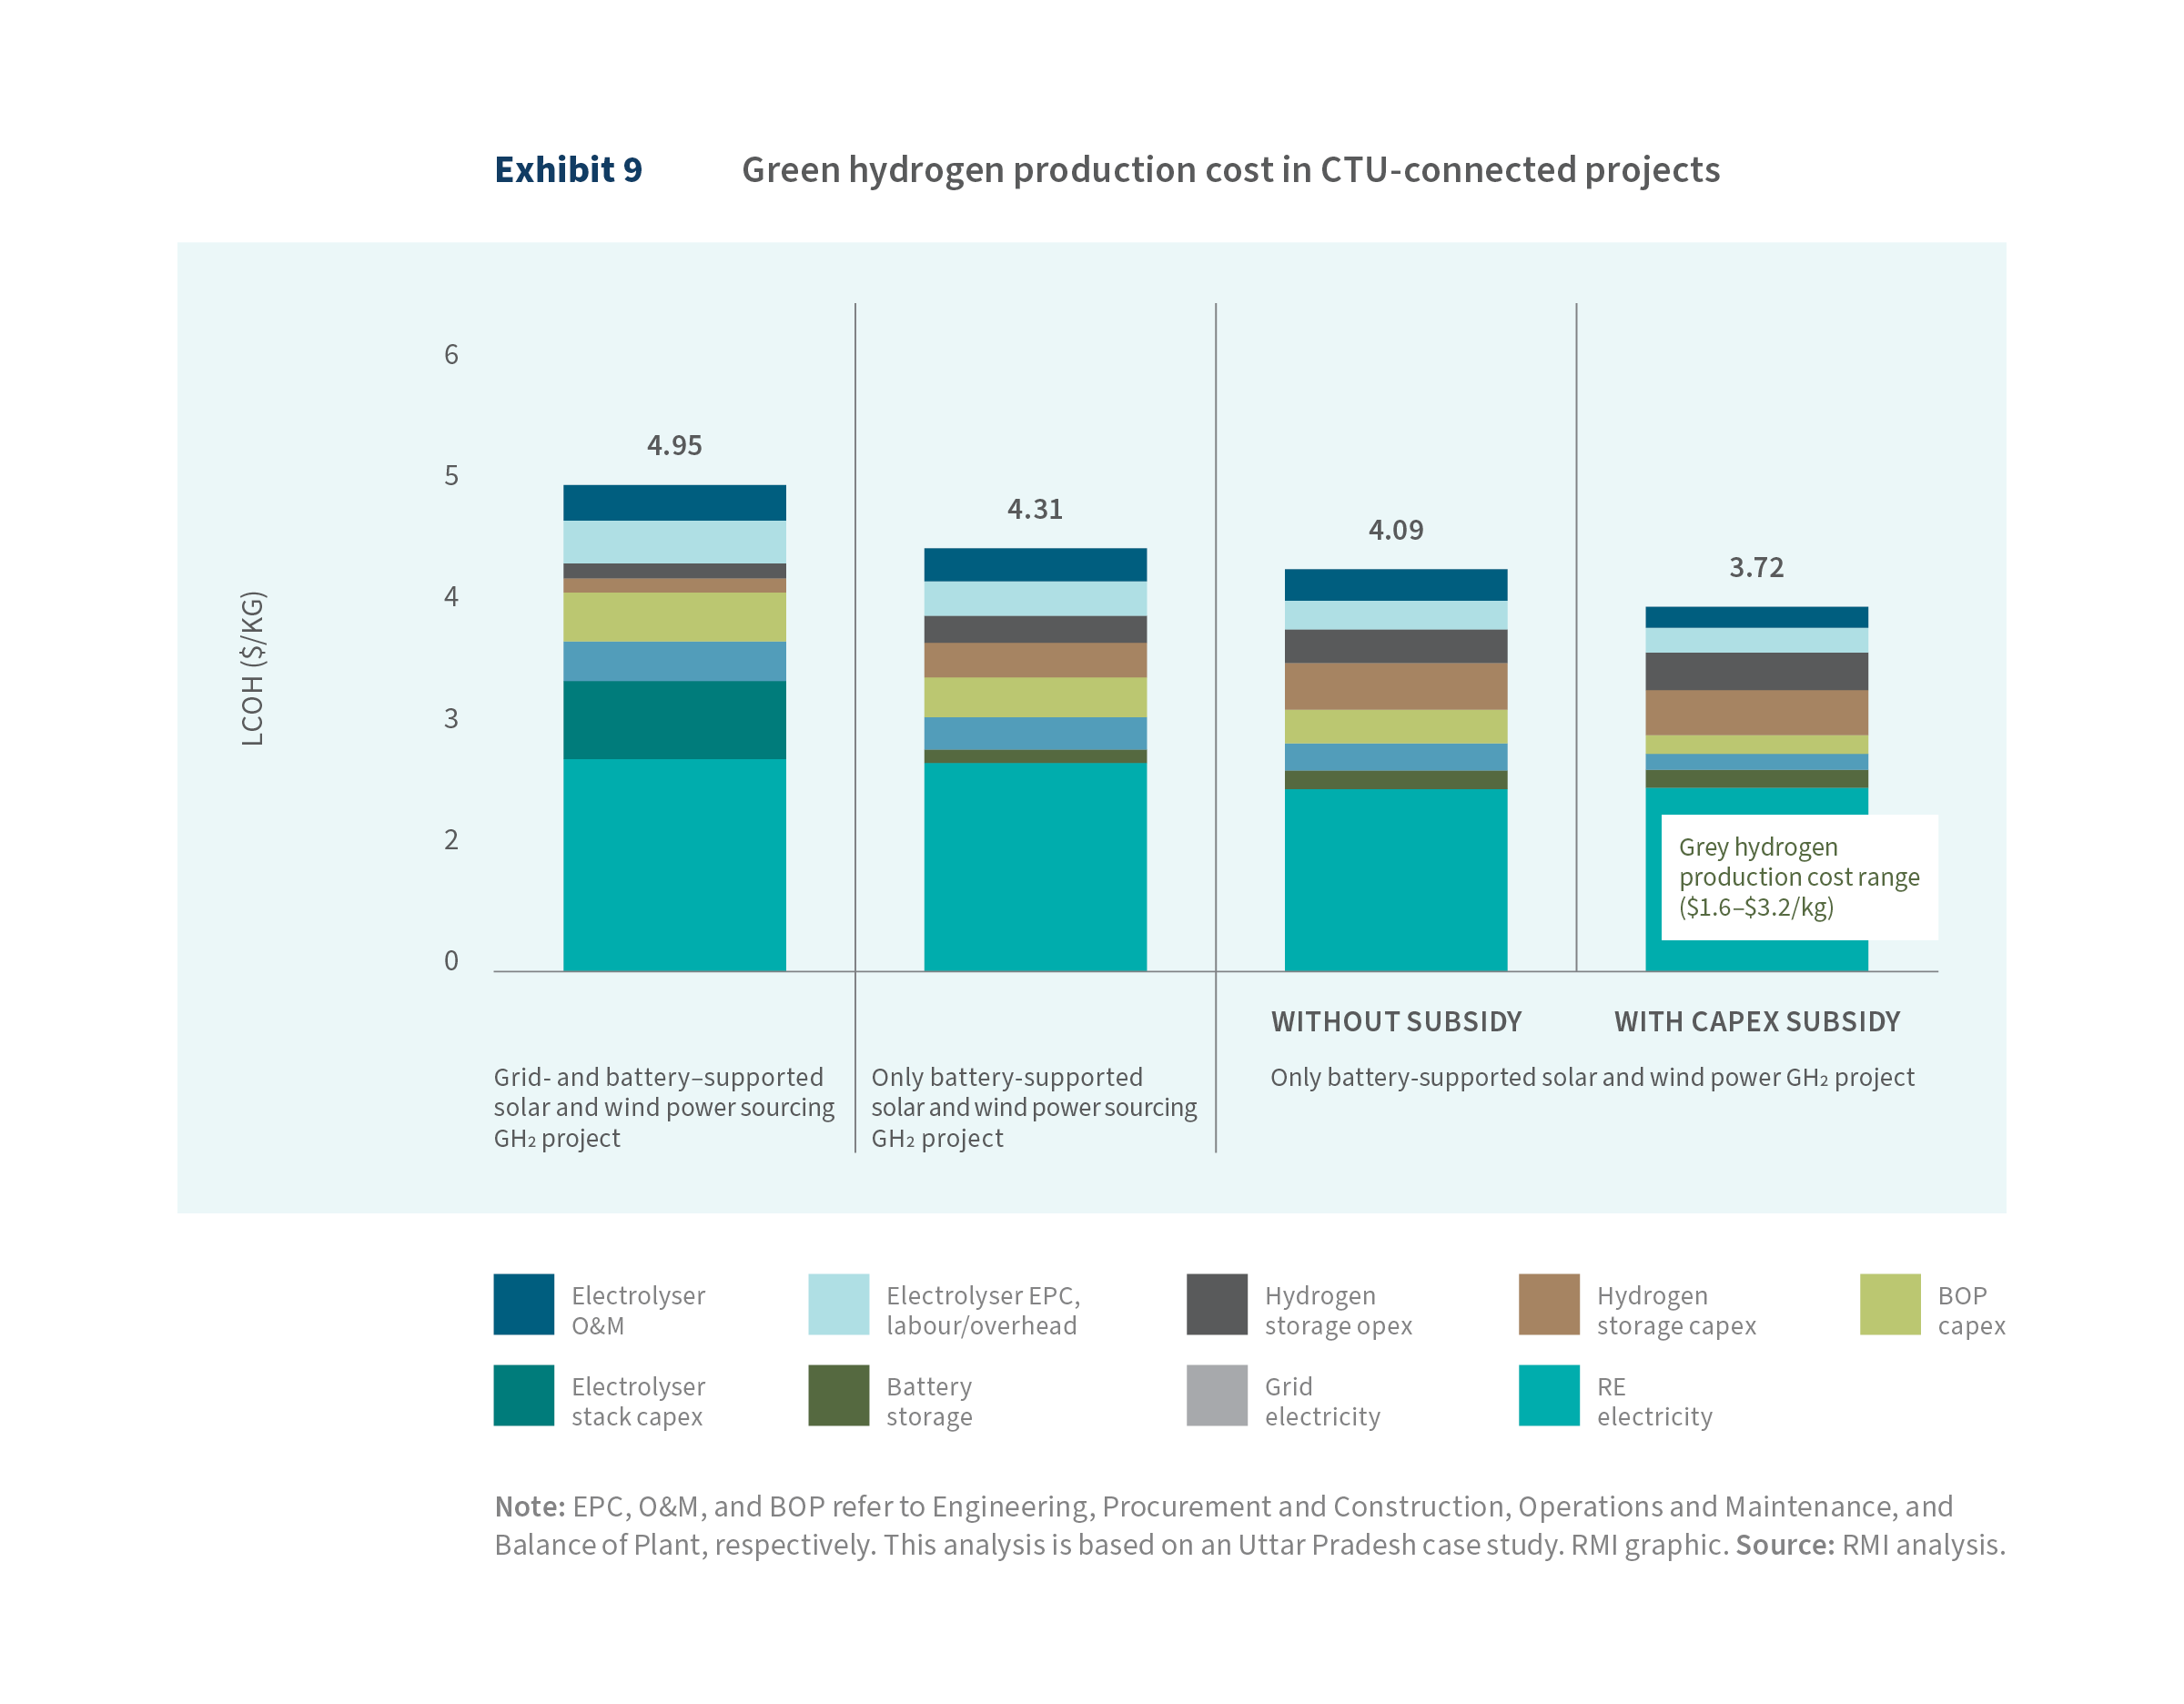
To better understand the implications, consider the example of Uttar Pradesh. With a capital subsidy of approximately 35% (including a booster), the LCOH could decrease by around 10% for a battery-supported solar project (see Exhibit 9). In this subsidized scenario, the final production cost is nearly 25% lower than that of a project using grid power in combination with batteries, solar, and wind energy.
This demonstrates that, although capital subsidies can significantly reduce production costs where they apply, their impact is less pronounced in ISTS projects due to the cross-state nature of renewable energy procurement.
ISTS connections also enable green hydrogen production units to be set up in diverse locations, including regions where renewable energy generation might not be feasible but where industries demanding hydrogen are located. The ability to transmit renewable electricity over long distances facilitates decentralized hydrogen production closer to demand centers, minimizing transport costs for hydrogen and improving its overall feasibility.
As India gears up to establish hydrogen hubs and clusters, ISTS connectivity will be essential in ensuring that these hubs are powered by renewable energy from across the country. This interconnected network helps balance supply and demand, making sure the hydrogen clusters have uninterrupted, clean electricity to meet their energy needs.
Though the ISTS connectivity can offer multiple benefits, it also comes with some key challenges that require attention from the regulatory authorities. One of them is the need for adequate transmission infrastructure. As renewable energy projects expand rapidly, particularly in remote locations with high solar and wind potential, the existing ISTS infrastructure may become insufficient. Transmission bottlenecks can delay the evacuation of renewable energy, limiting the ability of green hydrogen projects to access consistent electricity supplies.
Building new transmission lines and upgrading the ISTS infrastructure require significant investment. The capital costs associated with extending the ISTS network to remote renewable energy zones, particularly for large-scale projects like green hydrogen, can be substantial. These costs can pose financial risks, especially for developers of green hydrogen projects, as they rely on affordable electricity to remain economically viable.
Although ISTS is governed by a central regulatory framework, there are still complexities in navigating state-level regulations for renewable energy projects. Discrepancies in state policies, particularly with respect to energy banking, scheduling, and grid access, can create barriers for smooth ISTS connectivity. Additionally, policy uncertainty regarding the long-term availability of waivers or reduced transmission charges for renewable energy could affect project planning for green hydrogen developers.
Off-site (STU/DISCOM-connected) projects
As the green hydrogen ecosystem continues to mature, off-site projects that are STU- or DISCOM-connected are expected to become the most common type of green hydrogen projects. This shift will occur for several reasons, particularly due to the growing difficulty in setting up stand-alone or ISTS-connected projects in all potential demand locations.
STU/DISCOM-connected projects tap into the state’s existing transmission and distribution infrastructure, which can be more accessible and easier to integrate with the national grid or stand-alone solutions. This allows projects to be located closer to industrial or urban demand centers without the need for building new, isolated infrastructure.
Although STU-connected projects offer several advantages, they are not without challenges. The primary difficulty in prioritizing these projects lies in the higher cost of production, which is largely driven by the multiple state transmission charges, duties, and additional fees imposed when the developer is using grid infrastructure within state boundaries.
With more projects coming on line over time, it becomes increasingly difficult to find large contiguous land parcels for renewable energy generation at every demand location. State-level grid connections via STU/DISCOMs allow for the renewable energy plant to be sited in areas in the state where land and renewable resources are more abundant, while the hydrogen production facilities can remain closer to demand centers. This flexibility makes it easier to scale projects.
On average, these transmission-related charges can increase the landed cost of power to 1.5–2.5 times the base generation cost of renewable energy. The exact magnitude of these charges varies from state to state, depending on the specific regulatory framework. States with higher transmission and wheeling charges, or less favorable policies for renewable energy transmission, can make it more expensive to develop STU-connected projects. This variability creates uncertainty for developers and can complicate project planning and cost estimation.
To explore the complexities and cost implications of STU-connected projects, three different scenarios have been considered regarding the siting of renewable energy plants relative to the hydrogen production facility. The first scenario involves siting the solar plant in the same state as the green hydrogen production facility, but off site. The second scenario places off-site solar and wind plants in the same state as the hydrogen production (see Exhibit 10). The third scenario considers solar and wind plants located in different states, with solar energy sourced from Rajasthan and wind energy from Tamil Nadu in this analysis.
Whereas Kerala has the highest cost for green hydrogen production among all states — more than twice the cost of grey hydrogen — states like Gujarat, Karnataka, Punjab, Rajasthan, and Uttar Pradesh come closest to achieving costs comparable to grey hydrogen. The elevated production cost in Kerala can be attributed mainly to the higher base cost of power generation, but a significant portion is also due to substantially higher transmission charges.
When state incentives to promote green hydrogen production are evaluated, two critical factors emerge: the magnitude of the waivers (i.e., the size of the subsidies) and the tenure (how long the incentives last). These factors heavily influence the final cost of green hydrogen production. Depending on the state, the reduction in production costs due to subsidies can vary significantly, from as little as 1% in West Bengal to 61% in Odisha.
In states like Andhra Pradesh and West Bengal, the waivers for electricity charges are granted for five years, and no additional support is provided for capital investment. Green hydrogen projects typically have a life span of around 30 years, meaning that these incentives cover only one-sixth of the project’s duration. Thus, for most of the project’s life span, developers would have to bear the higher transmission charges, significantly affecting their long-term financial planning.
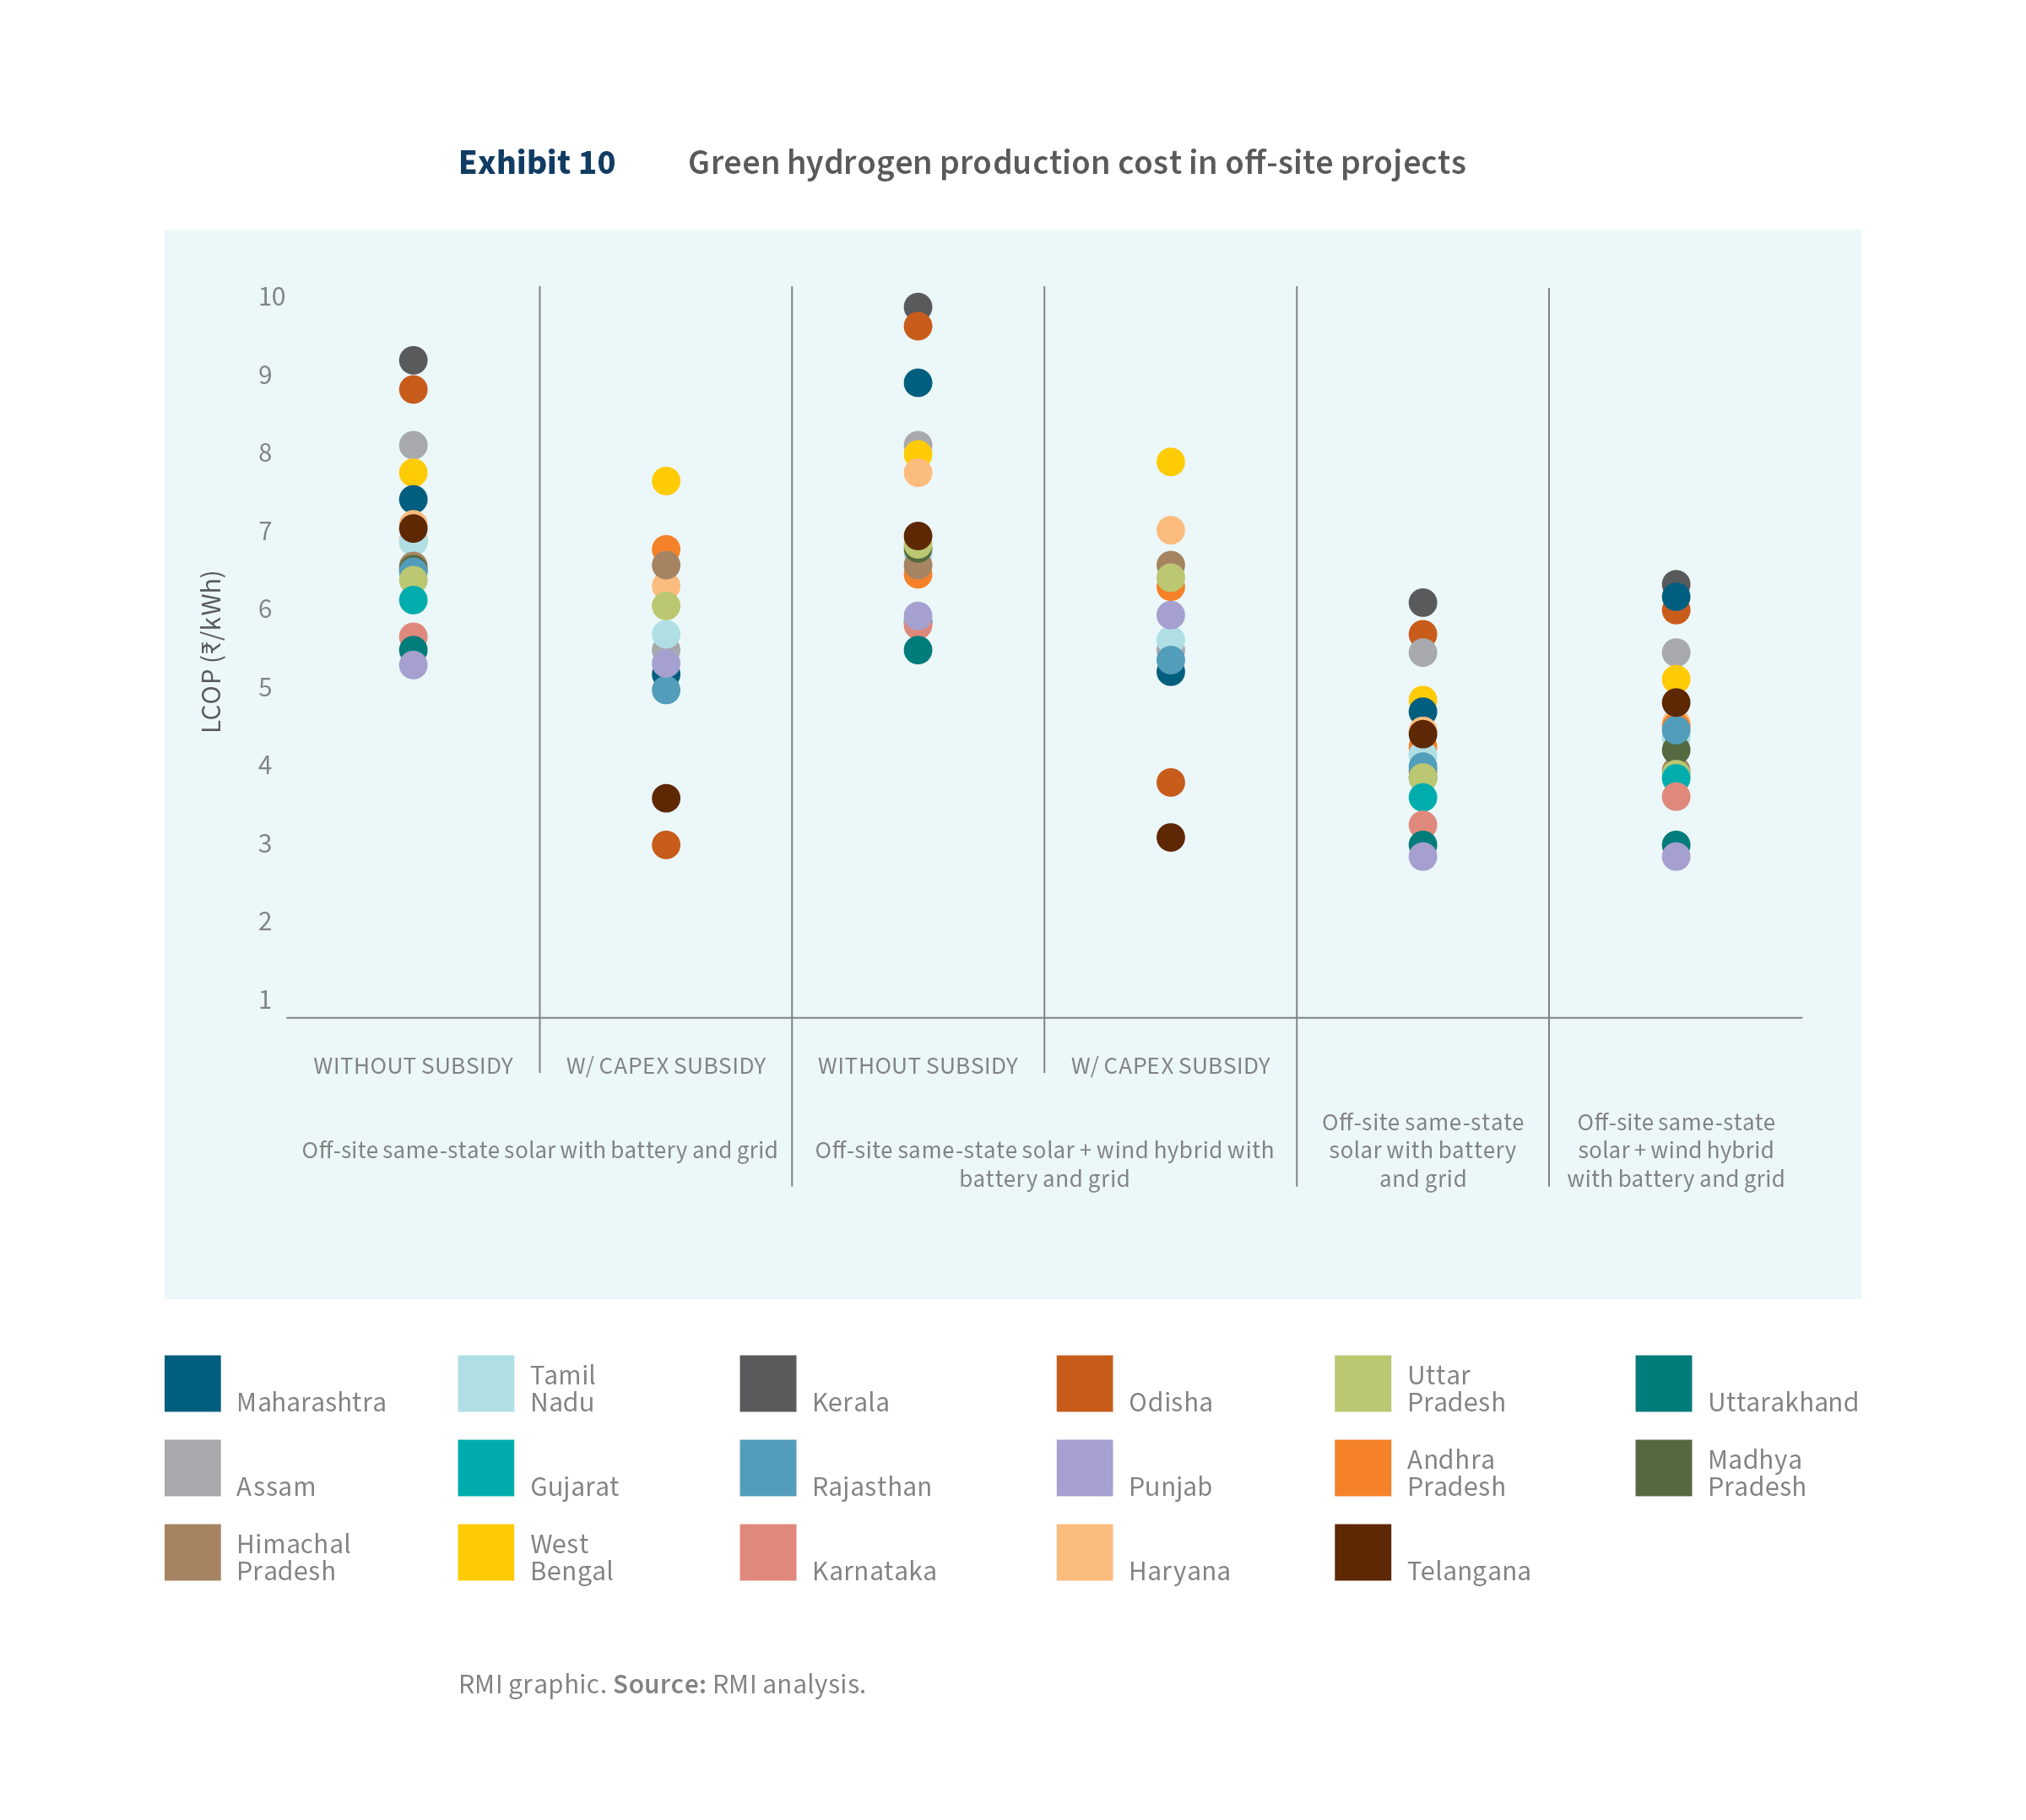
Odisha emerges as a leader in green hydrogen production cost competitiveness. As outlined in Stand-Alone On-Site Projects, the state’s comprehensive incentive package could bring down green hydrogen costs to as low as $3/kg, which is roughly 42% lower than the average production cost across other states. This positions Odisha as one of the most attractive locations for green hydrogen development, offering significant cost advantages both in the short and long term. Moreover, the scale of these incentives makes Odisha the only state capable of achieving green hydrogen prices that could currently compete with the cost of grey hydrogen, further enhancing its appeal for investment in the sector.
Long-term economies of scale are expected to play a crucial role in enhancing the overall competitiveness of green hydrogen production across states. As projects scale up, production costs will decrease due to more efficient use of resources, better technology, and lower unit costs. Currently, the average cost of green hydrogen production across 17 states is around $4/kg, without factoring in state-specific incentives.
By 2030, 9 of these 17 states will already be producing green hydrogen at a cost below $4/kg, with some of the most competitive prices expected in Gujarat, Uttar Pradesh, Karnataka, and Rajasthan. These states benefit from lower transmission and energy costs, making them attractive for large-scale green hydrogen production.
However, important industrial states such as Maharashtra, Odisha, and Andhra Pradesh continue to face higher production costs due to elevated transmission charges levied by the state governments. These transmission fees significantly drive up the cost of power, which is the key input for producing green hydrogen, making it harder for these states to compete on cost.
On the other hand, industrial powerhouses like Gujarat and Karnataka offer some of the most favorable cost structures. Their lower transmission fees, combined with the ability to scale production, give them a significant competitive advantage. By capitalizing on economies of scale, these states can offer some of the best cost dynamics for green hydrogen production, which will strengthen their position as leaders in the emerging green hydrogen economy.
Contracted power–based projects
In the green hydrogen sector, many players are aiming for vertical integration in the whole supply chain, from renewable energy generation to green hydrogen production. Some are also expanding into the production of hydrogen derivatives and exploring end-use applications. However, a segment of the industry is focusing exclusively on green hydrogen production, opting not to invest directly in renewable energy generation. In these cases, companies rely on sourcing renewable energy through PPAs rather than owning renewable assets.
One of the key advantages of sourcing power through a PPA is the ability to maximize the utilization of the hydrogen production plant, potentially up to 100%. This high utilization rate allows for the optimal use of electrolyzers, reducing both the capital and operational expenditures associated with them. By running at full capacity, companies can minimize the size and cost of the electrolyzer needed for hydrogen production, leading to improved efficiency in equipment use and overall project cost management.
PPAs enable companies to secure a reliable supply of renewable electricity for hydrogen production without the need to diversify into the renewable energy business. These agreements offer the advantage of stable energy access, which is critical for hydrogen production processes that require continuous power supply. However, this arrangement tends to come with a higher landed cost of electricity compared with vertically integrated models.
Based on the analysis, the landed cost of contracted power is expected to range between ₹5.3/kWh and ₹8/kWh ($0.065/kWh and $0.098/kWh), with an average of ₹6.9/kWh ($0.084/kWh) across 17 states. Since the base contract cost remains constant, the variation in landed cost arises from the differing charges applicable in each state. Compared with other scenarios across the states, this landed cost is 6%–140% higher.
The baseline cost of power in a third-party PPA is typically higher than the base generation cost that would be achieved through direct ownership or captive power generation. This is due to the added expenses from transmission and distribution charges, including cross-subsidy surcharges and additional surcharges. These fees, often applied in third-party agreements, are typically waived in captive or group captive projects, where companies generate and use their own power or share resources among a consortium. As a result, the reliance on third-party power procurement adds to the operational expenses of hydrogen production.
Consequently, the cost of hydrogen production shows significant variation, ranging from $5.9/kg to $8.5/kg, which is considerably larger than in other scenarios. Although state policies help reduce costs, most waivers are applicable for only a limited time and do not span the entire project life cycle, limiting their impact. According to the analysis, the anticipated cost reduction could be around 10%. However, it is important to note that these contracts are typically not for project life, and subsequent negotiation may help secure lower prices as market dynamics evolve.
Despite the benefits of high utilization, the significantly higher landed cost of electricity in third-party PPA arrangements outweighs the gains. The elevated electricity costs result in a higher overall cost of hydrogen production compared with other project configurations, such as vertically integrated models or captive power setups. This raises important considerations for investors about the trade-off between maximizing production efficiency (by fully utilizing electrolyzer capacity) and minimizing overall costs through more strategic project structuring.
This scenario also prompts broader questions about the most effective investment strategy for green hydrogen projects. Should the industry prioritize maximum utilization of production assets, or should it focus on optimizing the project structure to balance power costs and operational efficiency? These questions are crucial for determining the long-term sustainability and profitability of green hydrogen ventures and are explored in further detail in the next section.
Notes
[i]. “India Announces Definition of Green Hydrogen,” Ministry of New and Renewable Energy, August 19, 2023, https://pib.gov.in/PressReleaseIframePage.aspx?PRID=1950421.
[ii]. Arjun Joshi, “Himachal Pradesh Increases Levelized Tariffs for Solar Projects up to 5 MW for FY 2022-23,” Mercom Clean Energy Insights, March 29, 2022,
https://www.mercomindia.com/himachal-increases-levelized-tariffs-for-solar-projects.
Techno-Economic Feasibility of Green Hydrogen Projects
Discussions on Critical Choice Consideration for Green Hydrogen Project Developers
This study provides a comprehensive look at the complexities of India’s green hydrogen sector, focusing on the gaps in project planning, economics, and risk management. Key insights from the research reveal that state-level policy support, alongside national initiatives, can significantly reduce renewable energy costs for green hydrogen production, with reductions of over 90% in some cases.
Stand-alone green hydrogen projects represent a promising, cost-effective approach, with production costs ranging from $4.4/kg to $4.8/kg. Despite this, challenges such as land availability and the need to locate projects near demand centers remain significant. The study emphasizes the need for green hydrogen production costs to drop by at least 50% in off-site projects to make them competitive with grey hydrogen. Achieving this will require scaling up production, which is expected to drive cost reductions through better resource utilization and technological advancements.
However, the path to commercializing green hydrogen is fraught with risks, ranging from volatile renewable energy prices and regulatory uncertainties to technological challenges and financial constraints. High up-front capital costs, technological limitations in electrolyzers, and the need for infrastructure development for grid integration, storage, and transport all pose significant hurdles. In addition, a fragmented regulatory landscape across states adds complexity to project planning, while the adoption of green hydrogen by end-users is crucial for long-term commercial success.
To fully realize the potential of green hydrogen in India, several strategic priorities must be pursued:
First, aligning state-level policies with national goals will be essential. Policymakers need to work closely with state governments to enhance incentives, subsidies, and regulatory frameworks that reflect both national ambitions and local conditions. This will improve the feasibility and competitiveness of green hydrogen projects across diverse regions.
Second, increasing investment in R&D will be critical to advancing electrolyzer technologies and renewable energy systems. Enhanced R&D can drive improvements in efficiency, cost reduction, and technological innovation, addressing the challenges associated with hydrogen production and ensuring India’s competitive advantage in the sector.
Third, infrastructure development should be prioritized, particularly focusing on grid integration, energy storage, and transportation. Robust infrastructure will ensure stable production and efficient distribution, as well as help minimize fluctuations in hydrogen supply — all essential for large-scale deployment.
Fourth, strengthening domestic supply chains for key components like electrolyzers and renewable energy systems is crucial. Developing local manufacturing capabilities and fostering partnerships along the value chain will reduce India’s reliance on global markets, ensuring consistent production capacity while mitigating potential supply chain disruptions.
Lastly, addressing safety concerns and raising public awareness will be vital. Public confidence in the safety, benefits, and potential of green hydrogen will facilitate the adoption of hydrogen technologies. A coordinated effort among government, industry, and research institutions will help India position itself as a global leader in green hydrogen, while navigating challenges and building a sustainable green hydrogen economy.
Conclusion and the Way Forward
This study provides a comprehensive look at the complexities of India’s green hydrogen sector, focusing on the gaps in project planning, economics, and risk management. Key insights from the research reveal that state-level policy support, alongside national initiatives, can significantly reduce renewable energy costs for green hydrogen production, with reductions of over 90% in some cases.
Stand-alone green hydrogen projects represent a promising, cost-effective approach, with production costs ranging from $4.4/kg to $4.8/kg. Despite this, challenges such as land availability and the need to locate projects near demand centers remain significant. The study emphasizes the need for green hydrogen production costs to drop by at least 50% in off-site projects to make them competitive with grey hydrogen. Achieving this will require scaling up production, which is expected to drive cost reductions through better resource utilization and technological advancements.
However, the path to commercializing green hydrogen is fraught with risks, ranging from volatile renewable energy prices and regulatory uncertainties to technological challenges and financial constraints. High up-front capital costs, technological limitations in electrolyzers, and the need for infrastructure development for grid integration, storage, and transport all pose significant hurdles. In addition, a fragmented regulatory landscape across states adds complexity to project planning, while the adoption of green hydrogen by end-users is crucial for long-term commercial success.
To fully realize the potential of green hydrogen in India, several strategic priorities must be pursued:
First, aligning state-level policies with national goals will be essential. Policymakers need to work closely with state governments to enhance incentives, subsidies, and regulatory frameworks that reflect both national ambitions and local conditions. This will improve the feasibility and competitiveness of green hydrogen projects across diverse regions.
Second, increasing investment in R&D will be critical to advancing electrolyzer technologies and renewable energy systems. Enhanced R&D can drive improvements in efficiency, cost reduction, and technological innovation, addressing the challenges associated with hydrogen production and ensuring India’s competitive advantage in the sector.
Third, infrastructure development should be prioritized, particularly focusing on grid integration, energy storage, and transportation. Robust infrastructure will ensure stable production and efficient distribution, as well as help minimize fluctuations in hydrogen supply — all essential for large-scale deployment.
Fourth, strengthening domestic supply chains for key components like electrolyzers and renewable energy systems is crucial. Developing local manufacturing capabilities and fostering partnerships along the value chain will reduce India’s reliance on global markets, ensuring consistent production capacity while mitigating potential supply chain disruptions.
Lastly, addressing safety concerns and raising public awareness will be vital. Public confidence in the safety, benefits, and potential of green hydrogen will facilitate the adoption of hydrogen technologies. A coordinated effort among government, industry, and research institutions will help India position itself as a global leader in green hydrogen, while navigating challenges and building a sustainable green hydrogen economy.
Appendices
Appendix A: Modeling framework and analytical tool
In this study, the modeling approach focuses on optimizing the capacities of renewable energy installations, electrolyzers, green hydrogen storage, and battery storage to minimize initial project costs (see Exhibit A1). Similar to other large-scale ventures, stakeholders in the green hydrogen sector aim to reduce capital expenditures while securing competitively priced green power. The optimization model emulates the decision-making process of investors and developers, aiming to minimize project capital outlay, thereby lowering the levelized cost of production.
Key factors considered in the model include production and renewable asset locations, assumptions regarding capital and operational expenses, variables pertaining to electrolyzers and renewable power plants, the choice of hydrogen storage technology, and the annual consumer demand pattern.
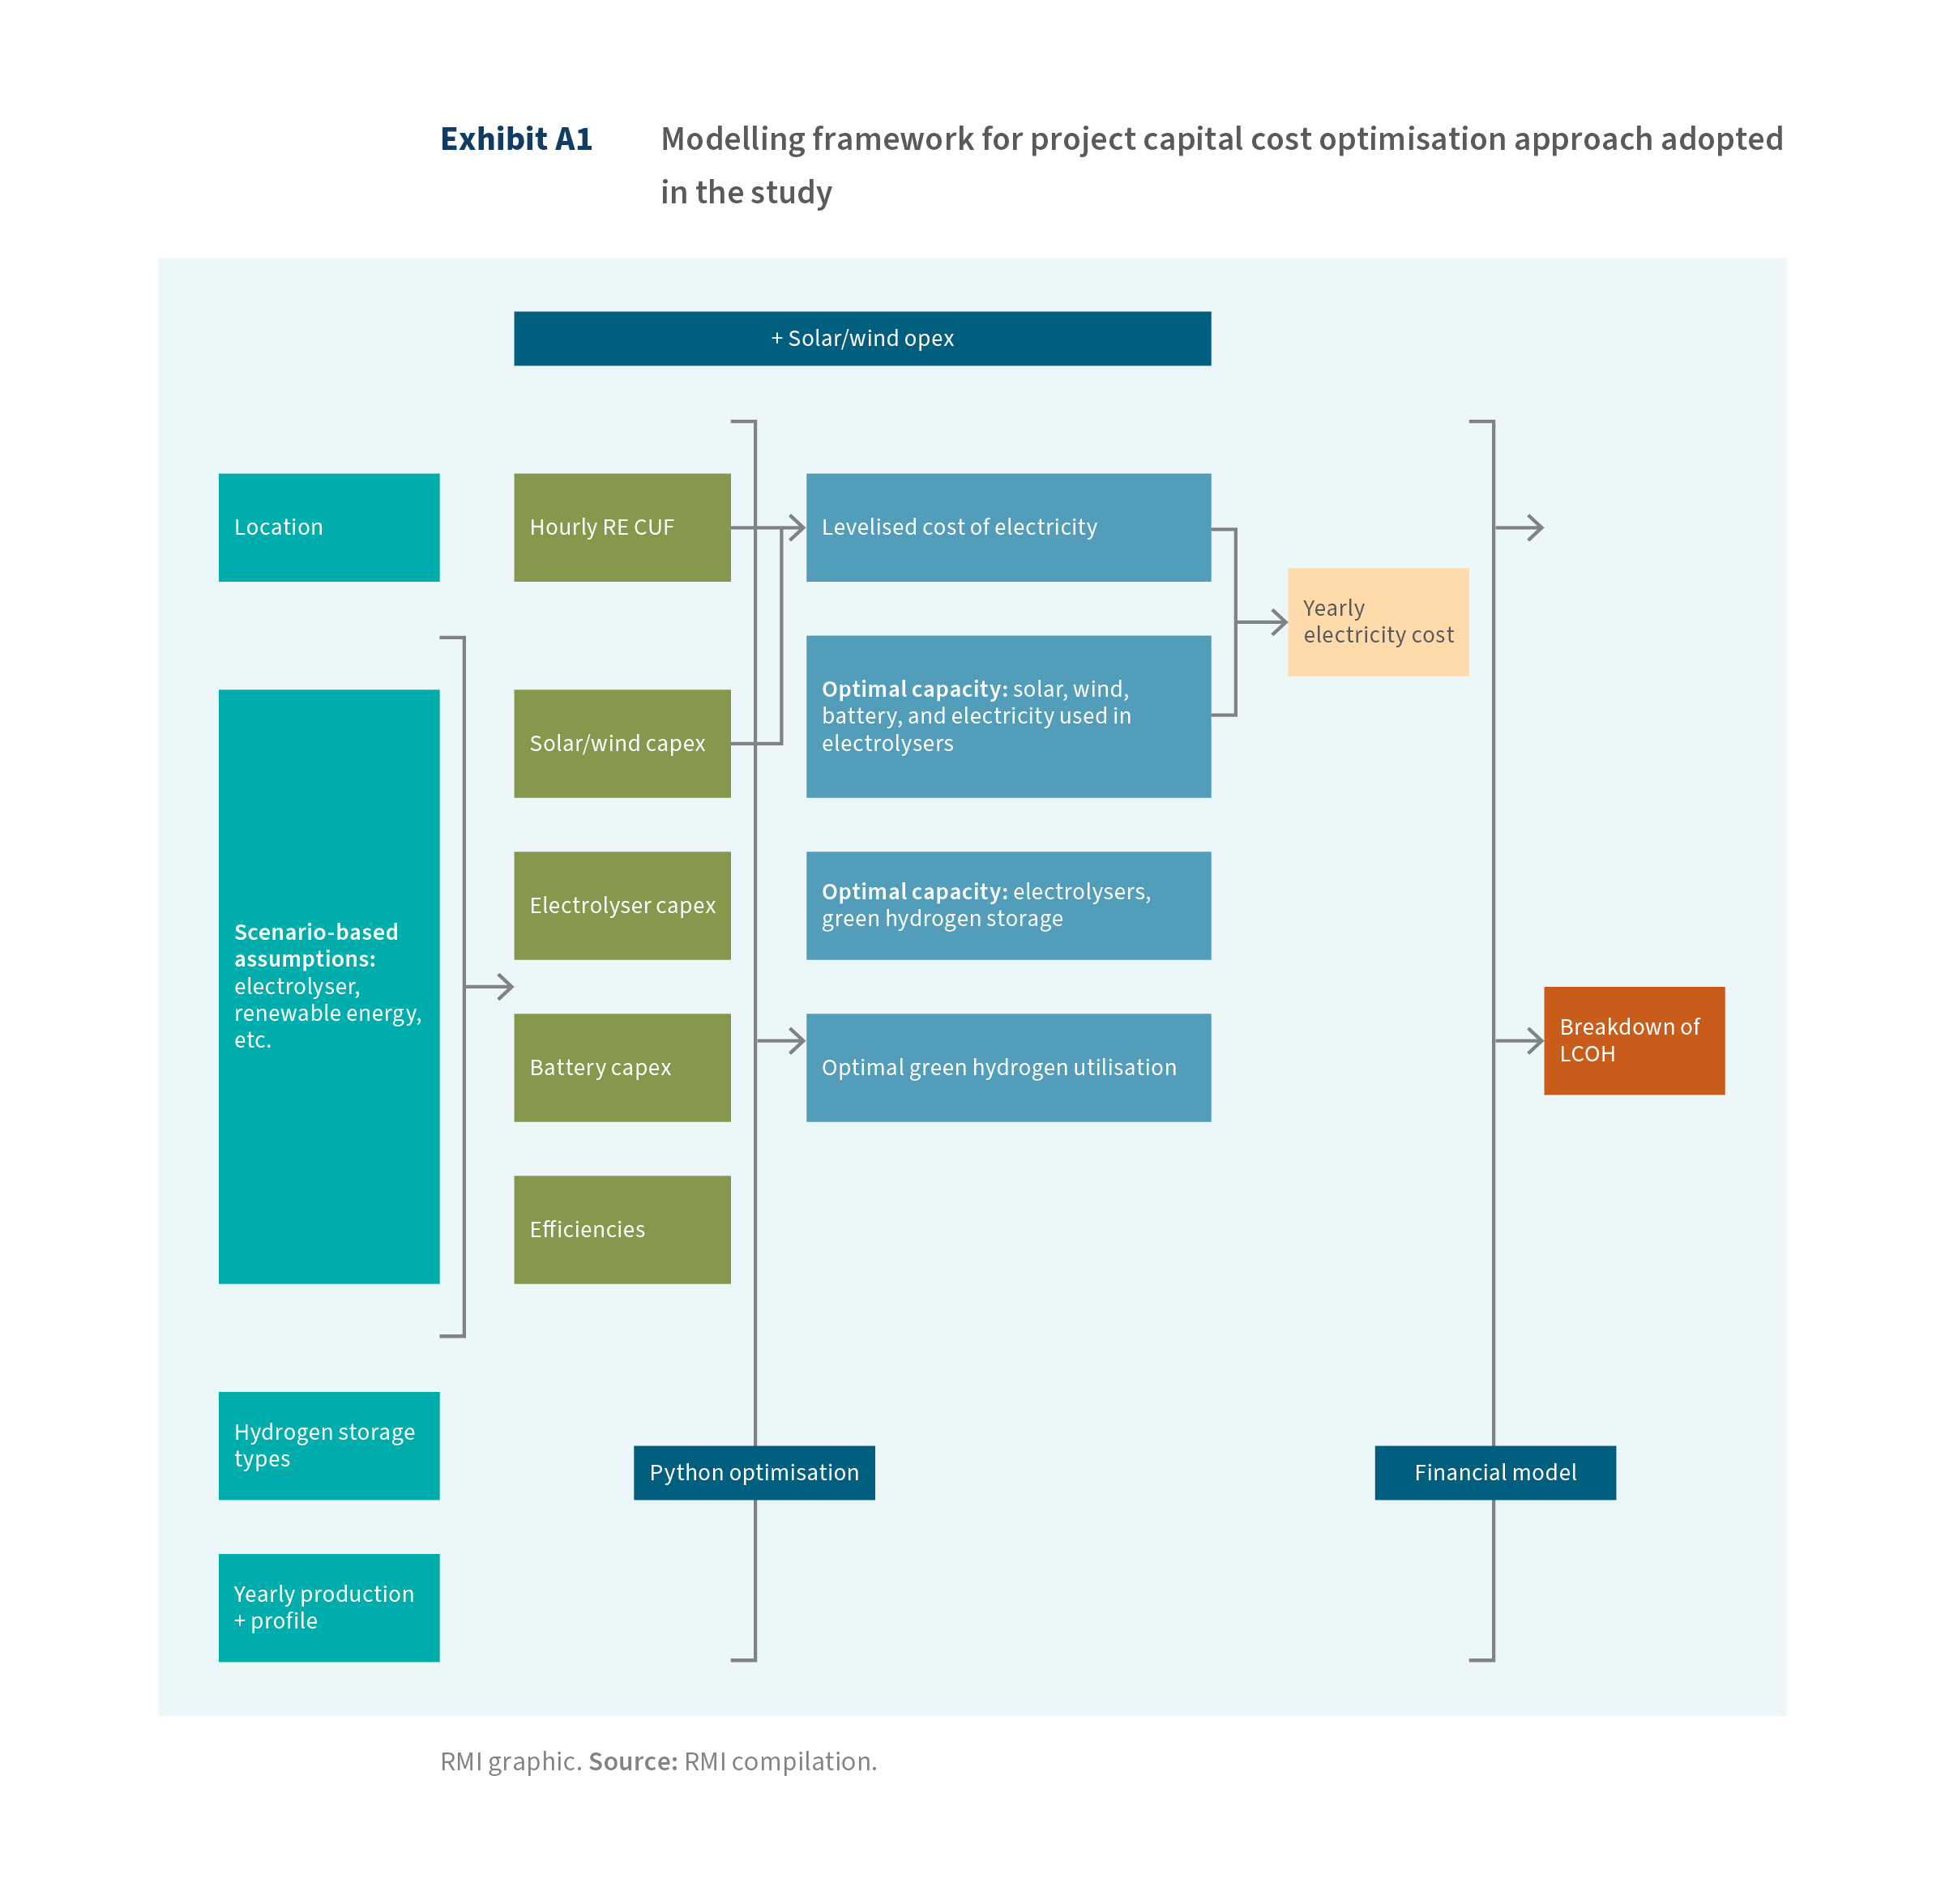
This modeling approach not only provides insights into optimal sizing but also offers valuable perspectives on efficient system utilization and the complexities of production costs. Beyond these aspects, the analysis serves as a guide for developers in making informed decisions. It helps navigate choices between battery storage and green hydrogen storage, which are pivotal for ensuring reliable output to end consumers. This underscores the importance of a thoughtful and informed approach to project development, ensuring sustainability and competitiveness in the green energy sector.
Appendix B: Summary of State Policies Influencing Green Hydrogen

Acknowledgments
We extend our sincere gratitude to Ashok Rajput, former Member (Power System) at the Central Electricity Authority, Ministry of Power, Government of India, for his invaluable guidance, unwavering support, and meticulous review throughout our study. We are deeply thankful to Akshima Ghate, Managing Director, along with Sonika Choudhary, Principal, and Arjun Gupta, Manager, at RMI, whose insightful guidance and detailed feedback significantly contributed to shaping our project. Additionally, we express our appreciation to Tessa Weiss, Anton Krimer, Shilpi Sharma, and Carmela Chaney from RMI for their invaluable support in modeling and other research aspects during the project.
About RMI
Rocky Mountain Institute (RMI) is an independent, nonpartisan nonprofit founded in 1982 that transforms global energy systems through market-driven solutions to secure a prosperous, resilient, clean energy future for all. In collaboration with businesses, policymakers, funders, communities, and other partners, RMI drives investment to scale clean energy solutions, reduce energy waste, and boost access to affordable clean energy in ways that enhance security, strengthen the economy, and improve people’s livelihoods. RMI is active in over 60 countries.
Copyrights and Citation
Ankur Malyan, Parimal Kogekar, and Jagabanta Ningthoujam, Green Hydrogen Production Pathways for India: Techno-Economic Considerations for Green Hydrogen Project Development, RMI, 2025, https://rmi.org/green-hydrogen-production-pathways-for-india/
RMI values collaboration and aims to accelerate the energy transition through sharing knowledge and insights. We therefore allow interested parties to reference, share, and cite our work through the Creative Commons CC BY-SA 4.0 license. https://creativecommons.org/licenses/by-sa/4.0/.
All images used are from iStock.com unless otherwise noted.
Endnotes
[1] All ₹ to $ conversions in this document have been calculated using a fixed exchange rate of ₹82 per $. All dollars in this report refer to US dollars.
[2] The Green Term Ahead Market (GTAM) and Green Day Ahead Market (GDAM) enable procurement of green energy through power exchanges.
[3]. Ujwal Sontakke and Santosh Jaju, Green Hydrogen Economy and Opportunities for India, IOP Conference Series: Materials Science and Engineering, 1206 (2021) 012005, DOI: 10.1088/1757-899X/1206/1/012005, https://iopscience.iop.org/article/10.1088/1757-899X/1206/1/012005; and Braj N Singh, Tripti Ratn, and Prakhash Jha, India’s Green Hydrogen Revolution: An Ambitious Approach, EY and India’s Ministry of New and Renewable Energy, 2024, https://static.pib.gov.in/WriteReadData/specificdocs/documents/2024/may/doc2024510336301.pdf.
[4]. Raul Leote De Carvalho, “Huge Hydrogen (Investment) Potential Yet to Be Unlocked,” BNP Paribas Asset Management, October 27, 2023,
https://viewpoint.bnpparibas-am.com/huge-hydrogen-investment-potential-yet-to-be-unlocked/; and Susana Moreira and Tim Laing, Sufficiency, Sustainability, and Circularity of Critical Materials for Clean Hydrogen, The World Bank Group, 2022,
https://documents1.worldbank.org/curated/en/099340012132232793/pdf/P1740030a03d520a60a5570f776c34e1701.pdf.
[5]. Under the US definition, qualifying “clean hydrogen” may not produce more than 4 kg of carbon dioxide equivalent (CO2e) per kg of hydrogen produced. “Financial Incentives for Hydrogen and Fuel Cell Projects,” US Department of Energy, 2022, accessed March 23, 2025,
https://www.energy.gov/eere/fuelcells/financial-incentives-hydrogen-and-fuel-cell-projects.
[6]. The Risk Profile of Renewable Energy Tax Equity Investments, American Council on Renewable Energy, December 1, 2023,
https://acore.org/resources/the-risk-profile-of-renewable-energy-tax-equity-investments/.
[7]. “European Hydrogen Bank,” European Commission, 2022, accessed April 15, 2025,
https://energy.ec.europa.eu/topics/energy-systems-integration/hydrogen/european-hydrogen-bank_en.
[8]. Bernhard Lorentz et al., “Green Hydrogen: Energizing the Path to Net Zero,” Deloitte, 2023, https://www.deloitte.com/global/en/issues/climate/green-hydrogen.html.
[9]. National Green Hydrogen Mission, Ministry of New and Renewable Energy, January 2023, https://cdnbbsr.s3waas.gov.in/s3716e1b8c6cd17b771da77391355749f3/uploads/2023/01/2023011390.pdf.
[10]. MNRE. “National Green Hydrogen Mission”, 2023
[11] Sunrise sectors refer to rapidly growing industries in their early stages with high potential for expansion and significant economic impact.
[12]. Shalin Sheth, “India’s Green Hydrogen Mission: A Closer Look at Sub-National Roles and Strategies,” Times Tech, May 14, 2024,
https://timestech.in/indias-green-hydrogen-mission-a-closer-look-at-sub-national-roles-and-strategies/.
[13]Power-to-x refers to the process of converting renewable electricity to a variety of end products (x) such as hydrogen, methanol, synthetic fuels, etc.
[14]. “Project Database,” Ministry of New and Renewable Energy, accessed December 1, 2024, https://nghm.mnre.gov.in/project.php?cat=15&language=en.
[15]. Theodore Reed-Martin, “GlobalData: Innovations Driving Investment in Green Hydrogen,” Energy Global, March 19, 2024,
https://www.energyglobal.com/other-renewables/19032024/globaldata-innovations-driving-investment-in-green-hydrogen/.
[16]. Reed-Martin, “GlobalData,” 2024.
[17]. Rodolfo Dufo-López, Juan M. Lujano-Rojas, and José L. Bernal-Agustín, “Optimisation of Size and Control Strategy in Utility-Scale Green Hydrogen Production Systems,” International Journal of Hydrogen Energy 50, Part B (2024): 292–309, ISSN 0360-3199,
https://www.sciencedirect.com/science/article/pii/S0360319923044671; Decarbonising End-Use Sectors: Green Hydrogen Certification, IRENA Coalition for Action, 2022,
https://www.irena.org/-/media/Files/IRENA/Agency/Publication/2022/Mar/IRENA_Green_Hydrogen_Certification_Brief_2022.pdf; and Green Hydrogen Market: Potentials and Challenges, 100% RE Multi-Actor Partnerships, August 21, 2023,
[18]. “Building Innovative Green Hydrogen Systems in Isolated Territories,” BIG HIT,
https://www.bighit.eu/; and “Europe’s Hydrogen Hub: H2 Proposition Zuid-Holland/Rotterdam.” Accessed May 1, 2025. https://h2v.eu/hydrogen-valleys/europes-hydrogen-hub-h2-proposition-zuid-hollandrotterdam; and “H2iseO Hydrogen Valley,” Clean Hydrogen Partnerships,
https://h2v.eu/hydrogen-valleys/h2iseo-hydrogen-valley; and “SoHyCal: Solar PV Hydrogen Production Plant in Central California,” H2B2 Electrolysis Technologies,
[19]. “Gateway to India’s Dymaxion,” Lodha and RMI India Foundation, India, September
2023,
www.lodhagroup.in/netzerourbanaccelerator/rmi-lodha-sustainability-conclave.
[20]. “Gateway to India’s Dymaxion,”2023.
[21] Energy banking is an exchange of electricity for electricity. It is an arrangement where surplus power generated in a particular period is fed into the grid. This surplus energy known as banked energy is then supplied back during periods of low RE generation.
[22]. Industrial Policy Resolution 2022, Industries Department, Government of Odisha, November 30, 2022, https://investodisha.gov.in/industrial-policy-2022/.
[23]. Venkatesh Raman Prasad, Ashish Suman, and Ashwin Navar, Gujarat Government Issues Policy on Land Allotment for Green Hydrogen Production, JSA Advocates and Solicitors, June 2, 2023, https://www.mondaq.com/india/oil-gas–electricity/1324664/gujarat-government-issues-policy-on-land-allotment-for-green-hydrogen-production.
[24]. White Paper on Green Hydrogen Policy in Gujarat State, Gujarat Energy Development Agency, January 12, 2024, https://geda.gujarat.gov.in/Gallery/Media_Gallery/GreenHydrogenPolicy.pdf.
[25]. “India Announces Definition of Green Hydrogen,” Ministry of New and Renewable Energy, August 19, 2023, https://pib.gov.in/PressReleaseIframePage.aspx?PRID=1950421.
[26]. Arjun Joshi, “Himachal Pradesh Increases Levelized Tariffs for Solar Projects up to 5 MW for FY 2022-23,” Mercom Clean Energy Insights, March 29, 2022,
https://www.mercomindia.com/himachal-increases-levelized-tariffs-for-solar-projects.
[27]. Report on Short-Term Power Market in India: 2022–23, Economics Division Central Electricity Regulatory Commission, 2023, https://cercind.gov.in/2023/market_monitoring/Annual%20Report%202022-23.pdf.
[28]. Ministry of Power. “In a Big Boost to Off-Shore Wind Energy Projects, Government Gives Complete Waiver of ISTS Charges for 25 Years to Projects Commissioned on or before 31st Dec, 2032.” Accessed April 21, 2025. https://pib.gov.in/PressReleasePage.aspx?PRID=1928128.
[29]. Industries, Energy and Labour Department, Government of Maharashtra. “Maharashtra Green Hydrogen Policy 2023,” October 17, 2023. https://gr.maharashtra.gov.in/Site/Upload/Government%20Resolutions/English/202310171551048810.pdf.
[30]. Government of Tamil Nadu. “Tamil Nadu Industrial Policy,” 2021. https://www.indembassybern.gov.in/docs/1617966871Tamil_Nadu_Industrial_Policy_2021.pdf.
[31]. Government of Andhra Pradesh. “Andhra Pradesh Green Hydrogen and Green Ammonia Policy,” June 20, 2023. https://www.nredcap.in/PDFs/2023/GO_Ms_No_14_Dt_20_06_2023.pdf.
[32]. Industries Department, Government of Odisha. “Industrial Policy Resolution 2022,” November 30, 2022. https://industries.odisha.gov.in/sites/default/files/2023-07/IPR-2022.pdf.
[33]. Department of Energy, Government of Odisha. “Odisha Renewable Energy Policy, 2022,” November 30, 2022. https://energy.odisha.gov.in/sites/default/files/2022-12/3354-Energy%20dept._1.pdf.
[34]. Power Department, Government of West Bengal. “West Bengal Green Hydrogen Policy 2023,” December 5, 2023. https://wbpower.gov.in/wp-content/uploads/GreenHydrogenPolicy2023.pdf.
[35]. Power Department, Government of Assam. “Assam Integrated Clean Energy Policy 2025,” February 24, 2025. https://www.apdcl.org/website/docs/acts_and_rules/Assam_%20ICEP_2025.pdf.
[36]. Government of Uttar Pradesh. “Uttar Pradesh Green Hydrogen Policy 2024,” May 3, 2023. https://upneda.org.in/MediaGallery/Policies/GreenHydrogenPolicy_2024.pdf.
[37]. Himurja. “Energy Policy 2021.” Accessed April 21, 2025. https://himurja.hp.gov.in/policy/.
[38]. Punjab Energy Department Agency. “Draft – Punjab Green Hydrogen Policy,” December 2023. https://www.peda.gov.in/assets/media/news/GH_Policy.pdf.
[39]. Energy Department, Government of Rajasthan. “Rajasthan Green Hydrogen Policy, 2023,” September 29, 2023. https://jankalyanfile.rajasthan.gov.in/Content/UploadFolder/DepartmentMaster/197/2023/Oct/30409/19754c1396c-1eb8-49f0-b1aa-11f734668671.pdf.
[40]. Directorate of New and Renewable Energy. “Draft Haryana Green Hydrogen Policy 2024,” February 15, 2024. https://cdnbbsr.s3waas.gov.in/s3f80ff32e08a25270b5f252ce39522f72/uploads/2024/02/20240215954959595.pdf.
[41]. Energy Department, Government of Telangana. “Telangana Clean and Green Energy Policy 2025,” November 1, 2025. https://tgredco.telangana.gov.in/Updates_2025/Telangana_Clean_and_Green_Energy_Policy_2025.pdf.

Related Insights

Help build the clean energy future. Donate today.
Independent research. Real-world solutions. Supported by donors.
RMI can pursue the highest-impact climate and energy solutions because we’re supported by people who believe change is possible. Every gift helps advance the work needed to make clean energy the default choice worldwide.
For other ways to give to RMI, including checks or gifts of stock, please visit Other Ways to Give.
