

Learn how we are working to transform how we use and produce energy.
Caught Between Rate Classes: Lessons from Massachusetts Multifamily Building Electrification
Why we share this work for free
RMI is an independent nonprofit working to accelerate the clean energy transition. We publish research like this to inform decision-makers and drive real-world impact.
Our work is supported by philanthropy as well as partnerships, including fee-for-service engagements. This support makes it possible for us to share our independent insights for free.
If you find this work valuable, you can support it anytime.
Get more insights like this
Stay up to date with the latest research, analysis, and tools from RMI by opting in to receive occasional emails below. You’ll get new reports, event invitations, and practical insights to help us all accelerate the clean energy transition.
Loading form...
Your download should start automatically. If it doesn’t, click the download button below.
This work is made possible by philanthropy
RMI is a nonprofit supported by donors and partners. Philanthropy enables us to produce independent research and make resources like this freely available.
If you find this report valuable, please consider supporting our work. You can also explore how we partner with organizations to drive impact.
Jump to Section
Introduction
Building electrification projects in multifamily buildings require building owners to make several key design choices, such as whether to install central or in-unit HVAC systems and how to configure metering to account for electricity consumption and bill responsibility among tenants. Building owners must also evaluate available electric rate options, as rate choice can significantly affect project economics.
As building electrification becomes a growing policy priority for states and local governments, regulators and utilities are implementing residential rates to support electrification, including heat pump rates, electric heating rates, and seasonal rates. As these rates become available, rate choice is becoming an increasingly important consideration in electrification planning.
Rate choice decisions are especially complex in multifamily housing, where similar buildings may qualify for either commercial or residential rates, depending on factors such as their load size, account holder, HVAC type, or metering configuration.
Massachusetts’ recent adoption of residential heat pump rates by investor-owned utilities (IOUs) has heightened this complexity.1 Building owners, policymakers, residents, and other stakeholders are now asking how multifamily buildings can benefit from heat pump and other electrification-friendly rates.
These questions stem from concerns that heat pump rates, which are only accessible to buildings within the residential customer class, may not deliver the same benefits for multifamily buildings — particularly master-metered buildings that can access only commercial rates. There may also be uncertainty around which rate options will result in the lowest utility bills for different building configurations.
We conducted a Massachusetts case study to evaluate how different electric rate structures affect electricity costs for a representative multifamily building. Specifically, the analysis addressed two questions:
- How do electric rate structures affect electrification costs and design decisions in multifamily buildings?
- How do low-income rate discounts and heat pump rates create electricity cost differences across multifamily buildings?
Massachusetts case study
In this case study, we evaluated the bill impacts of electrifying the HVAC systems of a typical mid-rise, 53-unit building in the Greater Boston area served by Eversource. We analyzed the project from the perspective of a hypothetical building owner making common choices around system type, metering strategy, and electric rates. We used the National Laboratory of the Rockies (NLR) ResStock 2025.1 dataset to develop a representative building electricity load profile and applied RMI’s rate analytics tool to determine electricity bill impacts. Additional details on our methodology can be found in the methodology appendix.
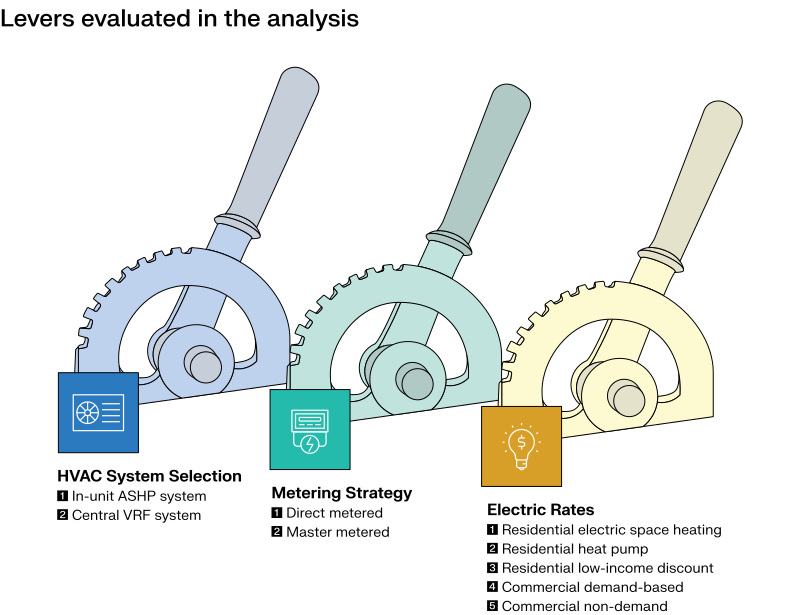
We compared how the following levers affect total electricity costs for electrification retrofits: HVAC system selection, metering strategy, and electric rates.
HVAC system selection and metering strategy
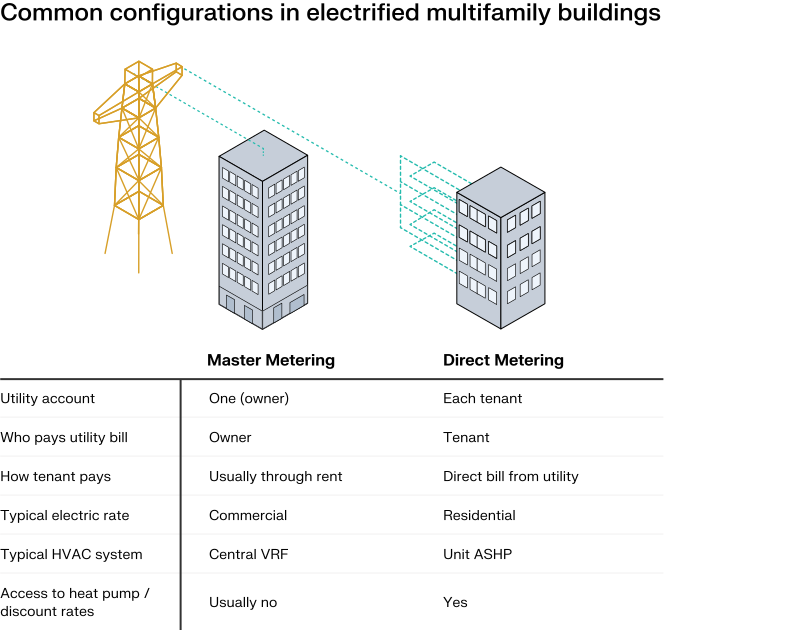
Metering configuration is a key factor in determining how multifamily buildings are billed for electricity and which electric rates they can access. Exhibit 2 summarizes the key features across the spectrum of metering for multifamily buildings. Many buildings use a mix of different metering types rather than a single configuration. As illustrated in Exhibit 2, master-metered buildings with central HVAC systems are often on a commercial electric rate, whereas direct-metered buildings with in-unit HVAC systems are often on a residential electric rate.2
Electric rates
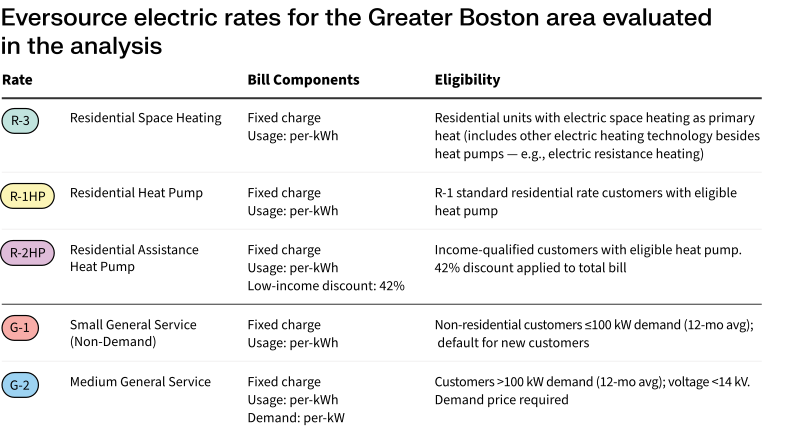
Eversource, the IOU that provides electricity to the Greater Boston area, offers several residential and commercial electric rates with different eligibility requirements and bill structures. Exhibit 3 summarizes the electric rates evaluated in this analysis.
Analysis levers
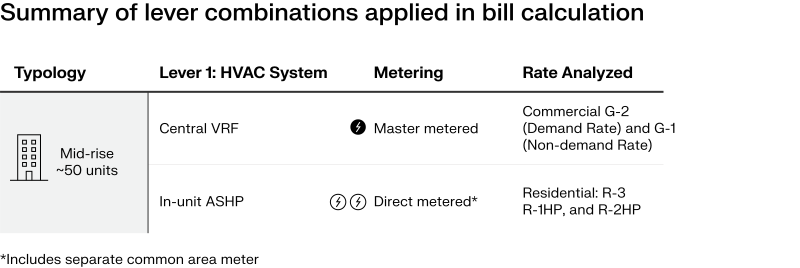
Rather than evaluating each lever independently, we modeled two representative electrification configurations that reflect common combinations of HVAC systems, metering approaches, and electric rates. Exhibit 4 summarizes these combinations.
Specifically, we compared total building-wide utility costs for:
- A central variable refrigerant flow (VRF) master-metered system under the G-1 and G-2 commercial rates, and
- A direct-metered system with in-unit air source heat pumps (ASHPs) under the R-3, R-1HP, and R-2HP rates (assuming all tenants have an income level that qualifies them for the R-2HP rate)
Results
To illustrate how the analysis levers influence electrification costs, we follow a hypothetical owner planning to electrify a multifamily building. The owner is planning a high-performance retrofit that replaces an existing central fossil fuel HVAC system with electric heat pumps. Setting aside the upfront capital costs of installing a new system, the owner works through a series of decisions that influence electricity costs.
The owner’s first decision is which HVAC system to install: a central VRF system or in-unit ASHPs.
Lever 1: HVAC system type
The two HVAC system types we modeled (central VRF vs. in-unit ASHPs) had similar energy performance and resulted in only a modest difference in energy costs, assuming the same electric rate and similar equipment efficiencies. As shown in Exhibit 5, total electricity costs are only 1.6% higher for the in-unit ASHPs scenario than for the central VRF scenario. Because this difference is small, we held the HVAC system type constant as central VRF for the remainder of the analysis.3
Levers 2 and 3: Metering configuration and applicable rates
To minimize changes to the building, the owner chooses the simplest electrification retrofit pathway: replacing the existing central fossil fuel HVAC system with a central VRF system while retaining the building’s existing master-metered configuration.
A building of this size and electricity demand is only eligible for Eversource’s G-2 commercial rate, which includes a demand charge. If the building had the same overall electricity consumption, but lower monthly peak demand, the building could instead qualify for Eversource’s G-1 commercial non-demand rate, which does not include a demand charge, reducing total utility bills by around $47,000, or 31%.
Retaining a master-metered configuration limits the building to commercial electric rates. The owner therefore next considers how costs would change if the building could instead access Eversource’s residential electric rates. Under that scenario, the building would be eligible for the standard residential rate and the R-3 and R-1HP rates, for electric space heating and heat pump customers respectively. The following exhibits show what utility costs would look like if the building switched to the R-3 and R-1HP residential rate options but maintained its existing master-metered setup.
In this scenario, both the R-3 and R-1HP residential rates would reduce electricity costs significantly compared with the G-2 demand rate. However, electricity costs under the non-demand G-1 rate would be comparable to costs under the two residential rates.
Income qualification
The owner’s final question is whether the building’s tenants qualify for Eversource’s low-income discount. If they do, the building becomes eligible for the R-2HP low-income heat pump rate.
If 100% of tenants in the building qualify for the low-income discount, switching to the applicable R-2HP rate would substantially reduce total building utility bills. Compared with the G-2 commercial demand rate, the reduction is drastic. When compared with the G-1 non-demand commercial rate, the savings are smaller but still significant. As long as 25% or more of the building’s tenants qualify for the R-2HP rate, then overall utility costs are less than what they would be under commercial rate G-1.
Although the hypothetical owner would realize substantial savings under the R-2HP rate, Eversource’s commercial customers with centrally metered buildings cannot currently access low-income electric rates. Our findings suggest that extending comparable low-income rate benefits to multifamily buildings in Massachusetts could substantially reduce buildings’ electricity costs.
Summary of findings
Through our analysis, we found that electric rate eligibility had a greater effect on electricity costs for multifamily building electrification than many building design decisions, including HVAC system choice. Avoiding demand-based commercial rates (Eversource’s G-2) and accessing low-income residential rates when tenants qualify produced the largest reductions in electricity costs.
Key takeaways
- Electric rate design and eligibility can substantially affect electricity costs for multifamily buildings. In this case study, a fully electrified multifamily building eligible for Eversource’s R-2HP residential low-income heat pump rate reduced total electricity bills by up to 52% compared with the same building under other Eversource rate options. The largest cost differences occurred between the R-2HP rate and the G-1 commercial demand rate.
- Rate eligibility can create inequitable electricity costs across similar multifamily buildings. Because many multifamily buildings served under commercial rate classifications do not qualify for residential rates designed to support building electrification, otherwise similar buildings can face substantially different electricity costs.
Recommendations
For building owners
- Evaluate electric rate options and metering configurations alongside HVAC system design when planning electrification projects.
- For buildings that remain on demand-based commercial rates, consider strategies to reduce peak demand through building performance improvements and energy management.
- Maximize enrollment in available low-income rate programs where tenants qualify.
For utilities and policymakers
- Design electric rates that provide equitable access to electrification benefits across multifamily building types.
- Test proposed rate reforms against representative multifamily building types before implementation. Eversource and Massachusetts’ other IOUs are transitioning from a flat low-income discount to tiered income-based discounts. Because these discounts will remain available only to residential customers, policymakers and other stakeholders should evaluate the bill impacts of proposed rate reforms across representative multifamily building configurations to identify and address potential cost inequities before implementation.4
- Improve transparency by providing building owners with decision-support tools that compare electric rate options and estimate bill impacts early in the building design process. Examples include “shadow billing” to illustrate how alternative rates would affect electricity bills and early assessments comparing metering configurations and rate combinations.
Other factors that may influence electricity costs but were outside the scope of this analysis
- Building performance: Improving building performance (e.g., weatherization and insulation) will reduce overall energy consumption and electricity costs.
- Building monitoring systems: Controlling usage/peak demand can make demand-based commercial rates more affordable.
- Rate utilization: Enrollment rate of eligible tenants on low-income discounts can impact building-level bill savings.
- Behavioral impacts: Tenants can be more conservative in their usage when they pay for their utilities, so switching to a direct-metered in-unit ASHP system could result in lower consumption.
Additional Contributors
Mike Henchen, Ella Mure, Eva Rosenbloom, Amar Shah, Al Qarooni
Methodology appendix
This appendix summarizes the analytical approach used to calculate annual utility costs for the representative mid-rise multifamily building evaluated in this blog. The analysis combines building samples from NRL’s ResStock 2025.1 dataset, equipment-specific heat pump performance assumptions, and Eversource Massachusetts electric tariffs. Exhibit A1 summarizes the overall analytical workflow.
| Step | What was modeled | Result |
|---|---|---|
| 1 | Representative building samples were selected from ResStock. | A building sample that reflects a mid-rise multifamily building in the Greater Boston area. |
| 2 | Hourly delivered thermal loads were compiled from ResStock for space heating, space cooling, and domestic hot water. | A building thermal demand profile. |
| 3 | Thermal loads were converted to hourly electricity use using equipment-specific performance curves. Non-HVAC load profiles were calculated by subtracting HVAC load from the total electricity load. | Equipment/scenario-specific electricity load profiles. |
| 4 | Common-area electricity was estimated separately using floor area and energy-use-intensity assumptions, then combined with dwelling-unit loads. | A full building load profile for direct-metered and master-metered scenarios. |
| 5 | Tariff data for the relevant Eversource residential and commercial tariffs was applied to the resulting load profiles. | Annual utility costs for each scenario. |
Building sample selection
Representative multifamily building samples were selected from the ResStock 2025.1 AMY18 dataset and filtered to Norfolk and Suffolk Counties, Massachusetts.5 To represent existing multifamily buildings with moderate envelope performance, the sample was further restricted to buildings with R-11 or R-19 wall insulation, which corresponds to moderately insulated walls relative to the broader ResStock housing stock.6
The analysis focuses on a representative mid-rise multifamily building, defined as approximately 53 units, 5–6 stories, and 824 square feet per unit. Six ResStock sample buildings were used to represent the makeup of the building, including a mix of studio, 1-bedroom, and 2-bedroom units.
Load modeling
To represent a moderately higher performance building, load profiles for the selected six ResStock samples were compiled for ResStock 2025.1 upgrade scenario 11 (air sealing).7 This upgrade scenario models improved air sealing by lowering air changes per hour at 50 Pascals (ACH50) to 5 ACH50 for all dwellings with a baseline infiltration rate of 6 ACH50 or greater. As a result, the representative building used in the analysis has marginally lower heating and cooling demand than the baseline ResStock scenario due to improved air sealing.
Delivered energy load profiles in kBtu were compiled separately for space heating, space cooling, and water heating. The delivered energy load reflects the thermal energy required by the building, independent of the equipment used, and varies only with factors such as envelope performance or occupant behavior.
These thermal loads were then converted to electricity consumption (kWh) using performance curves from the NEEP cold climate heat pump database and specific heat pump and heat pump water heater equipment models (see equipment specifications below).
Systems modeled:
- In-unit heat pump system: Daikin minisplit ductless ASHP, AHRI #212494260
- Central VRF heat pump system: Gree Ultra Heat GMV6, AHRI #212437187
- Heat pump water heater: RHEEM 65-gallon hybrid
- Central water heater: Mitsubishi QAHV-N136TAU-HPB
To isolate non-HVAC electricity loads (plug loads, lighting, appliances, etc.), ResStock’s reported combined electricity consumption for space heating, space cooling, and water heating was subtracted from ResStock’s reported total electricity consumption.
The final tenant load profiles were constructed by combining the non-HVAC loads with the modeled electricity consumption for heating, cooling, and water heating. The common area building load was estimated using floor area and EUI assumptions.
Applying electric rates
Electric tariff data was pulled from Genability, a comprehensive tariff database, for Eversource Massachusetts for calendar year 2025.
For in-unit heat pump scenarios, tenant loads were billed under the relevant residential tariff while common-area loads were billed separately under Eversource’s G-2 commercial demand rate. For master-metered scenarios, tenant load and common-area loads were combined and billed under the applicable commercial tariff.
Key notes
- Differences across modeled scenarios are driven by the equipment type and/or tariff assumptions; occupant behavior, building size, and weather are held constant.
- As the representative building is fully electrified, electricity costs reflect total building energy costs.
- The upfront capital costs of installing a new HVAC system were not considered in this analysis.
Endnotes
- Residential heat-pump rates became available for customers in all three Massachusetts electric IOUs (Eversource, Until, and National Grid) on November 1, 2025. See: mass.gov/info-details/residential-electric-seasonal-heat-pump-rates. ↩
- A sub-metered building — a building where the owner installs secondary meters to measure and allocate energy consumption from a central system to individual units — is another metering strategy that is used in some multifamily buildings. Since submetering is prohibited in Massachusetts, however, we did not model this as a lever in our analysis. ↩
- Exact differences in performance between central VRF and in-unit ASHP systems may vary on a building-by-building basis, depending on factors such as load shape and equipment efficiency ratings. In practice, VRF systems can often perform worse in real life relative to their higher performance ratings (due to cycling issues). ↩
- Within Massachusetts, an interagency group has taken the analysis from this case study as a catalyst and communication tool to collaborate with the utilities to devise ways in which affordable multifamily housing can access the upcoming LMI rates. ↩
- Andrew Parker et al., ResStock 2025 Release 1, dataset, Open Energy Data Initiative (OEDI), National Laboratory of the Rockies (NLR), 2025. ↩
- The range for wall insulation R-values in ResStock 2025.1 is R-7 to R-19. ↩
- Jeff Reyna et al., ResStock Technical Reference Documentation, Active Development Version, technical report, National Laboratory of the Rockies (NLR), 2025. ↩


Related Insights


Reality Check: For Power Plants, Changing the Fuel Doesn’t Fix the Economics


Beyond the First Frontier: What Comes Next for Carbon Removal
Help build the clean energy future. Donate today.
Independent research. Real-world solutions. Supported by donors.
RMI can pursue the highest-impact climate and energy solutions because we’re supported by people who believe change is possible. Every gift helps advance the work needed to make clean energy the default choice worldwide.
For other ways to give to RMI, including checks or gifts of stock, please visit Other Ways to Give.