
Gas Pathing 101
Unpacking the Pipeline: The Path to Supply Chain Clarity
Natural gas powers roughly 40% of the US electric grid and heats about 60% of American homes. Yet, despite this widespread reliance, regulators and the public have relatively little insight into where the gas they use originates or how it travels to reach them.
That matters for two reasons: first, if we don’t know where the gas is coming from, we cannot assess potential vulnerabilities in its supply chain. Complications in one state that impact gas travel to another state create risk, especially in colder winter months, and ultimately higher prices. Furthermore, as data center construction, new liquefied natural gas (LNG) export terminals, and global disruptions reshape where gas is needed and what it costs, states and utilities are increasingly being asked to plan around supply chain dynamics that they cannot fully observe.
Secondly, this lack of transparency creates an emissions data black hole when it comes to measuring methane pollution. Methane is a climate super-pollutant with 80 times the global warming potential as CO2 over a 20-year time period. And methane "leakiness" can vary dramatically depending on where in the US gas is produced and how far it must travel to its final destination. Supply chain clarity allows for accurate life-cycle emission estimations, which can enable regulators and gas buyers to understand the climate footprint of the gas they are buying.
Unraveling the gas supply chain is not simple, but policymakers do have options to get the transparency they need. As outlined below, two new solutions are emerging in this space: (1) leveraging direct purchase data (when available), and (2) analyzing public pipeline data. Each of these approaches comes with unique strengths and weaknesses, and both should be considered by policymakers looking to better understand their natural gas supply chain.
Creating transparency in the supply chain is not without challenges. America's gas network is complicated and nearly opaque. A single cubic foot of gas can change hands several times and pass through multiple pipelines and compressor stations between the wellhead and its final destination, mixing with gas from many other sources along the way. Key data are time intensive to collect and require significant analysis to interpret. However, these barriers are addressable problems, not roadblocks. Indeed, a handful of firms have built proprietary models to collect and interpret this data, but they typically sell that analysis at a high cost, placing it out of reach for many public stakeholders who might benefit from it.
This article will begin by examining why access to this data matters more than ever. Next, we'll break down exactly why the supply chain has historically been so opaque, walking through the specific barriers that stand in the way of transparency — e.g., confidential contracts, layers of intermediaries and resellers, and messy, hard-to-use public records. Finally, it will outline two emerging solutions being used to understand natural gas supply chains and highlight ongoing efforts — by RMI and others — to make this data more available in the future.
Supply chain transparency is more critical than ever
Accurate life-cycle emissions information for products and activities that use gas requires gas supply chain transparency. Methane intensity, a measure of how much gas leaks relative to how much is produced, varies widely by gas production basin. Research has demonstrated that methane intensity can vary by a factor of 10 times or more between production basins due to factors like geologic formations, operational practices, and local regulations.1,2 However, it is impossible for a gas buyer — or regulator — to account for this variability if they don’t have any visibility into the system that delivers gas across the country.
Additionally, gas supply chain transparency enables states and other consumers, such as utilities and hyperscalers, to anticipate and plan for new and evolving supply chain pressures. Data center construction is already driving increased electricity demand in some locations and continued and future construction may increase gas demand more broadly in the United States.3,4,5 New LNG projects around the country may also be an increasing source of gas demand, and one that may increase prices for US consumers. Meanwhile, at a global level, the Iran War is demonstrating the impact international conflict can have on gas flows. While the US natural gas market has thus far been insulated from global supply disruptions, this may change as US LNG exports increase. Despite the rapidly evolving developments in the natural gas market, US consumers and regulators have exceptionally limited insight into our domestic natural gas supply chain.
To understand how this all comes together, let’s consider an example: a new data center being built to leverage ‘behind-the-meter’ power produced by natural gas.
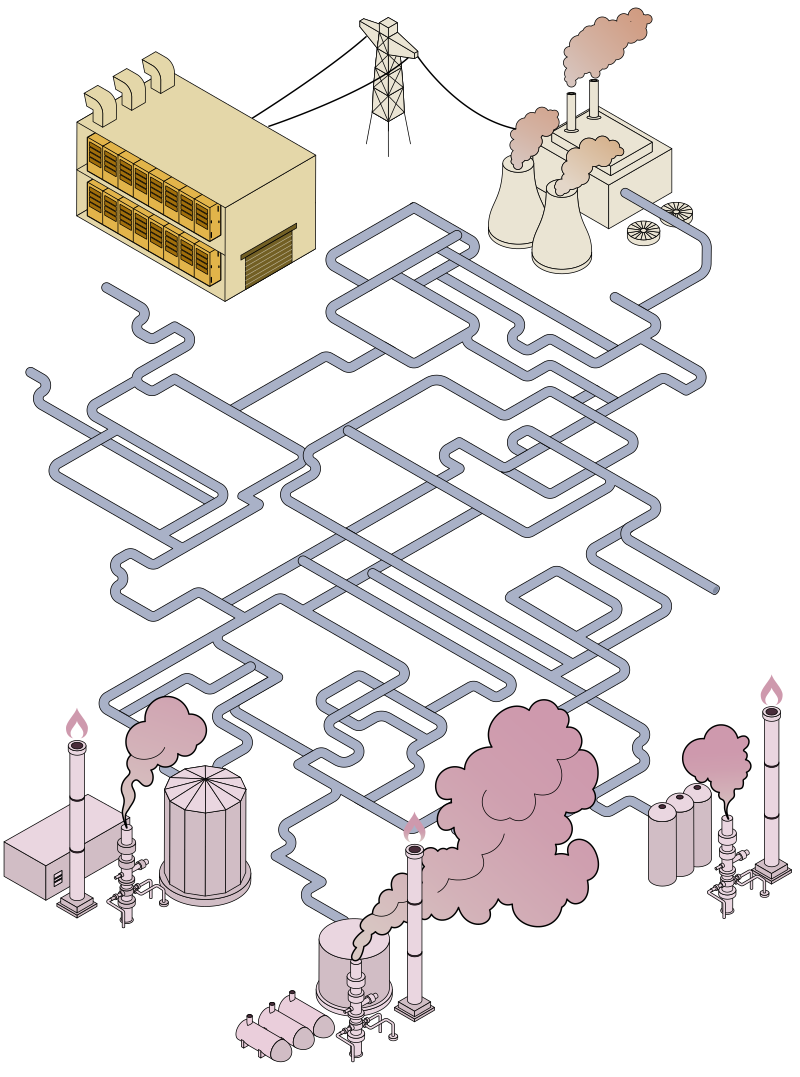
We know how to measure the emissions from the power plant powering the data center.
Further upstream, we know how to measure emissions at the production site.
But how can we understand the connection between them?
- How do we know whether gas burned to power that data center was produced in a super leaky area or an area with better emissions controls?
- Where else could gas have been used if not by that data center?
- Is the data center gas demand going to constrain the supply available to residential customers, thereby driving up prices?
Breaking down the barriers: Why the US gas system has remained so impenetrable
In many countries, the oil and gas industry is dominated by a small number of vertically integrated companies, meaning they control multiple aspects of the supply chain: oil and gas extraction, processing, transport, and sales, or some combination. This vertical integration makes it fairly straightforward to understand the path a product takes through a supply chain as information is owned by a limited number of actors. In contrast, companies operating in the US oil and gas industry are not vertically integrated, and there are many companies operating at each segment in the supply chain: the production segment alone has had over 10,000 active operators between 2024 and 2026.6 This abundance of actors and lack of vertical integration make gas pathing in the US more complicated than in nations where the industry primarily operates under a small number of vertically integrated companies.
Understanding this complexity requires unpacking two key topics. First, the physical gas transportation system — or, how gas actually moves through pipelines to reach its final destination. Second, the commercial transactions between pipeline operators, producers, buyers, and third-party “gas traders.”
1. How does natural gas move around the United States?
Moving gas around the country requires a complex network of gathering lines, processing plants, compressor stations, and intra- and inter-state pipelines.
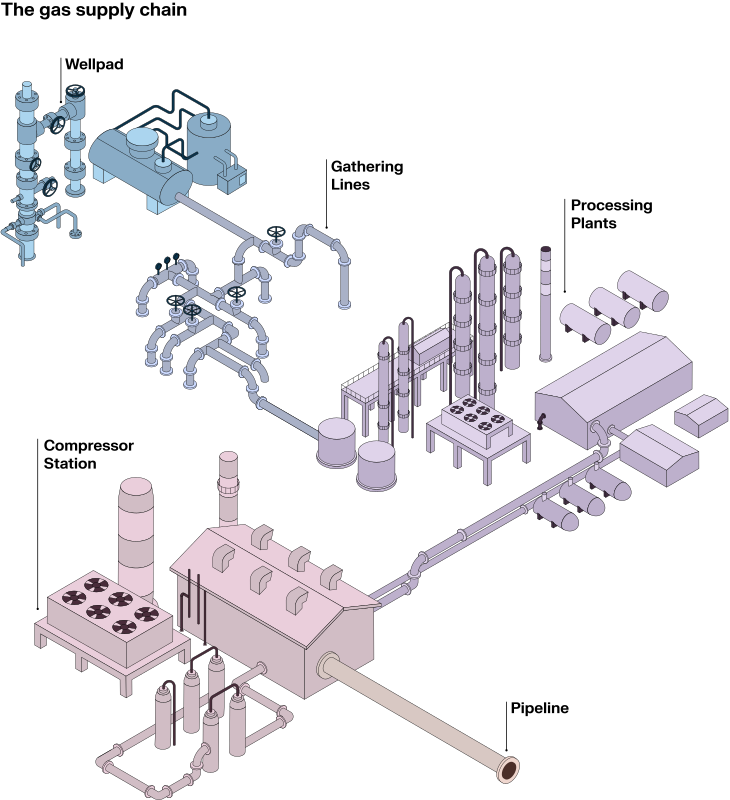
To begin its journey, gas is pulled out of the ground at a well and transported via gathering lines —smaller pipelines that move gas from drill sites to its next destination. Often, this is a processing plant (the natural gas analog to an oil refinery), where methane gas is separated from liquids and other contaminants (like mercury and hydrogen sulfide) and processed into pipeline-ready gas. Gas then enters the network of intra- and inter-state pipelines that take it to its destination.
These pipelines have many locations where gas is loaded on for transport and unloaded for use — these are called “delivery” and “receipt” points. Because of this, gas from one producer or basin often commingles with gas from a variety of other producers and basins as it travels from its origin to its destination point. This can happen throughout the pipeline network: at processing plants, junctions with other pipelines, and within the pipeline itself.
This this means that gas from various sources, all with different emissions profiles, mixes in the pipeline system. Gas from one area may have high wellhead emissions but relatively low emissions from gathering and processing facilities, or vice versa. As the gas travels, additional leakage occurs from the pipeline and at compressor stations, often during non-routine operations like maintenance events.
2. How is gas sold?
Gas can be sold in a variety of different ways, but generally these transactions fall into two categories. First, direct transactions between a producer and a gas buyer, or second, in a marketplace with one or more intermediaries between the producer and the ultimate buyer.
When gas is sold through a direct transaction, the gas producer sells gas directly to an end user. In these cases, one party may also contract with the relevant pipelines to facilitate the transportation of that gas from the production site to the final user. These transactions may be documented through pipeline nominations, invoices, and other data – for instance, when one party contracts with a pipeline for capacity to transport gas, transaction details are public. However, details of other transaction types are often confidential.
Alternatively, gas producers can sell their gas to a pipeline operator or other intermediary that is not the gas consumer. The intermediary is then responsible for selling the gas to the next intermediary or to a consumer. These transactions are also often private, making it difficult to understand all the hands gas passes through on its way from producer to consumer, where it ends up being used.
Information on which type of sale has happened is difficult to come by. Currently, there is little public data that would allow someone to estimate how frequently direct gas sales occur compared to gas sales involving intermediaries, and there is very little information on who buys gas directly and how often.
Even when this information is available, these cases cannot be assumed to be representative. In one study, authors found that Cheniere – a large natural gas buyer and exporter – directly purchased about 60% of gas processed at its Corpus Christi Liquefaction Facility and 73% of gas processed at its Sabine Pass Liquefaction Facility in 2022.7 However, Cheniere’s gas purchasing strategy could vary significantly year to year, and it is not necessarily representative of the LNG industry, let alone gas buyers as a whole. Company gas purchasing strategies are unique and closely guarded.
Tools to unravel the natural gas supply chain
Due to the complexity outlined above, some industry actors claim it is impossible to truly unravel the gas supply chain. And, while it is true the intermingling of US gas makes it difficult for a buyer to ever accurately track the exact molecules of gas back through the supply chain, that does not mean we are left with no options for supply-chain clarity.
Recent literature has outlined two options for how we can begin to interpret US supply chains.8,9
1. Direct Purchase Data
Buyers that purchase directly from producers can sometimes look to their private transaction data. In direct producer-to-consumer transactions, such as the Cheniere transactions outlined above, the location of production, volume of gas sold, and location of consumption are documented. Sometimes, these transactions are structured in a way that the buyer has insights into that gas’s origin and transportation path. While we can’t track any one specific molecule of gas from production to consumption point, we can determine the pathway a specific volume of gas in the system will take.
However, these data are often proprietary, and this method can only be used for some gas, since a significant portion of gas is sold through intermediaries, not direct producer-consumer transactions.
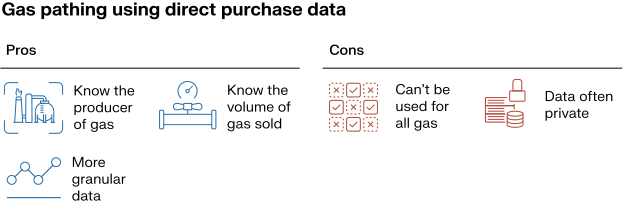
When possible, this approach is effective. However, these transaction data are often private, and even when public, they only describe a limited portion of gas bought and sold in the US. So, how can we get a clearer picture of the full gas supply chain?
2. Public Pipeline Data
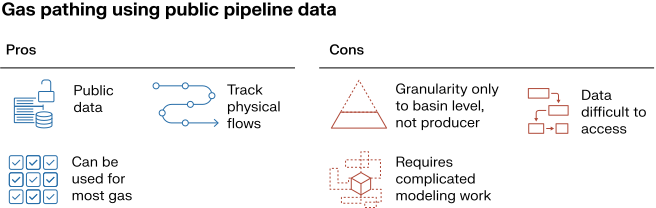
Publicly available pipeline data can illuminate the gas supply chain, regardless of how gas is bought and sold. As discussed above, commercial information that could illuminate gas supply chains is difficult to come by. However, a key federal regulation makes it possible to untangle this complicated web. FERC Order No. 637 requires pipeline operators to post scheduled flow and other information for each receipt and delivery point on interstate pipelines.10
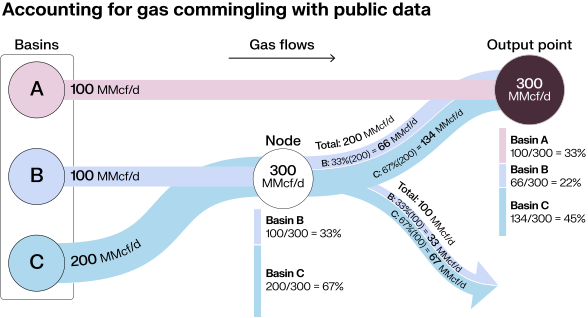
These pipeline data are available for any gas that travels through the interstate pipeline system — a majority of gas sold in the US. Collating information on the pipelines delivering gas, delivery and receipt points, and pipeline capacity information enables analysts to quantify deliveries and trace those deliveries back to their likely origin basin(s) based on physical gas flows. This analysis, sometimes referred to as “gas pathing,” relies on pipeline nomination data, which documents all gas volumes transported between delivery and receipt points on a pipeline. This enables users to determine the likely basin-of-origin of a unit of gas at any given point within the interstate pipeline network.
The below graphic illustrates a (simplified) example of how this can be done, where Basins A, B, and C are distinct oil and gas production basins, the Node is a hub where gas from a variety of areas intermingles (like Henry Hub), and the Output Point represents a consumption point for the gas.
There are challenges to this approach, however. FERC data, while technically public, are not analysis-ready. Some companies fulfill the requirement to make these data available by providing a 1-800 number that the public can call to request the data, and even when data are available online, they are reported in inconsistent formats, some of which are not easily machine-readable or downloadable. This makes data collection difficult to automate. While some companies do the work required to collate the data into an analyzable format, they sell it for a high fee.
And even once that data is collected, the analysis described above is complicated and time intensive. However, modeling tools can make it cheaper and easier to replicate over time. Ongoing analysis work is needed because, although commercial contracts and pipeline capacity commitments influence physical flows, the US system is flexible: physical gas flows shift to accommodate day-to-day and year-to-year volatility.
While it may be difficult to get clarity into the gas supply chain and begin to answer these questions, it is possible. Academic researchers at the University of Texas, in collaboration with RMI, are currently building a model to understand how gas flows from respective production basins to California. This effort relies on the publicly available FERC pipeline data, and similar models could be built for states across the US.
To learn more and get the most up-to-date information, sign up for RMI’s Spark.
Endnotes
Sherwin, E. D, Rutherford, J. S., Zhang, Z., Chen, Y., Wetherley, E. B., Yakovlev, P. V., Elena, Jones, B. B., Cusworth, D. H., Thorpe, A. K., Ayasse, A. K., Duren, R. M., & Brandt, A. R. (2024). US Oil and Gas System Emissions from Nearly One Million Aerial Site Measurements. Nature, 627(8003), 328–334. https://doi.org/10.1038/s41586-024-07117-5↩︎
Oil Climate Index plus Gas. (2026). RMI.Org. https://ociplus.rmi.org/↩︎
Commercial electricity demand grew fastest in states with rapid computing facility growth. (2024). EIA.Gov. https://www.eia.gov/todayinenergy/detail.php?id=62409↩︎
Disavino, S. (2026, June 9). US power use to beat record highs in 2026 and 2027 as AI use surges, EIA says. Reuters. https://www.reuters.com/business/energy/us-power-use-beat-record-highs-2026-2027-ai-use-surges-eia-says-2026-06-09/↩︎
Lenton, C. (2026, March 12). Data center surge could spike natural gas demand beyond forecasts, EIA says [Review of Data center surge could spike natural gas demand beyond forecasts, EIA says]. Natural Gas Intelligence. https://www.naturalgasintel.com/news/data-center-surge-could-spike-natural-gas-demand-beyond-forecasts-eia-says/↩︎
Enverus Data↩︎
Roman-White, S. A., Mallikarjuna Prasanna, D., McCullagh, A., Ravikumar, A. P., Allen, D. T., Chivukula, K., Khutal, H., Balcombe, P., Ross, G., Handler, B., Bazilian, M., & George, F. C. (2024). Gas pathing: Improved greenhouse gas emission estimates of liquefied natural gas exports through enhanced supply chain resolution. ACS Sustainable Chemistry & Engineering, 12(46), 16956–16966. https://doi.org/10.1021/acssuschemeng.4c07162↩︎
Ibid.↩︎
Zhu, Y., Ross, G., Brown, J., Khaliukova, O., Daniels, W., Wang, J. L., Roman-White, S., George, F., Zimmerle, D., Hammerling, D., & Ravikumar, A. (2025). Tracking U.S. liquefied natural gas supply chain greenhouse gas emissions intensity through direct measurements [Review of Tracking U.S. liquefied natural gas supply chain greenhouse gas emissions intensity through direct measurements]. https://doi.org/10.26434/chemrxiv-2025-8751d↩︎
Federal Energy Regulatory Commission. Regulation of Short-Term Natural Gas Transportation Services, and Regulation of Interstate Natural Gas Transportation Services; Order No. 637. Docket No. RM98-10-000. Issued February 9, 2000. https://www.ferc.gov/sites/default/files/2020-05/rm98-10.pdf↩︎