

Learn how we are working to transform how we use and produce energy.
Building Charging Networks That Meet Drivers’ Needs Without Breaking the Bank
Informed planning decisions reduce costs in deploying EV charging infrastructure
Why we share this work for free
RMI is an independent nonprofit working to accelerate the clean energy transition. We publish research like this to inform decision-makers and drive real-world impact.
Our work is supported by philanthropy as well as partnerships, including fee-for-service engagements. This support makes it possible for us to share our independent insights for free.
If you find this work valuable, you can support it anytime.
Get more insights like this
Stay up to date with the latest research, analysis, and tools from RMI by opting in to receive occasional emails below. You’ll get new reports, event invitations, and practical insights to help us all accelerate the clean energy transition.
Loading form...
Your download should start automatically. If it doesn’t, click the download button below.
This work is made possible by philanthropy
RMI is a nonprofit supported by donors and partners. Philanthropy enables us to produce independent research and make resources like this freely available.
If you find this report valuable, please consider supporting our work. You can also explore how we partner with organizations to drive impact.
Jump to Section
Introduction
As the electric vehicle market continues its growth in the United States (and abroad, where it is growing even more quickly), we need charging infrastructure to keep pace. But EV chargers and the supportive grid infrastructure are not cheap, so developers and planners have to make sure that they are building out charging networks that will meet the needs of EV drivers without breaking the bank.
EV charging projects must balance drivers’ desire for convenience and accessibility with the finite resources and limited capital available to local planners and private EV charging developers. Developers attempt to maximize capital efficiency by deploying chargers in locations where they anticipate there will be sufficient demand. For example, DC fast charging (DCFC) is typically sited at quicker-stop locations such as grocery or convenience stores and in strategic placements along highway corridors, with slower Level 2 chargers often sited at workplaces, parks, or other locations where drivers stop for longer.
In an ideal world, driving patterns, consumer preferences, and equipment costs could be perfectly harmonized to develop the lowest-cost network that meets charging demand from all users. Reaching this level of coordination is unrealistic; however, the details of such a hypothetical network reveal real-world strategies for building more cost-effective charging.
Our Approach
To explore this approach, we assessed individual travel patterns and modeled how charging network costs change as planners gain more information about the combination of options for where and when drivers could charge.
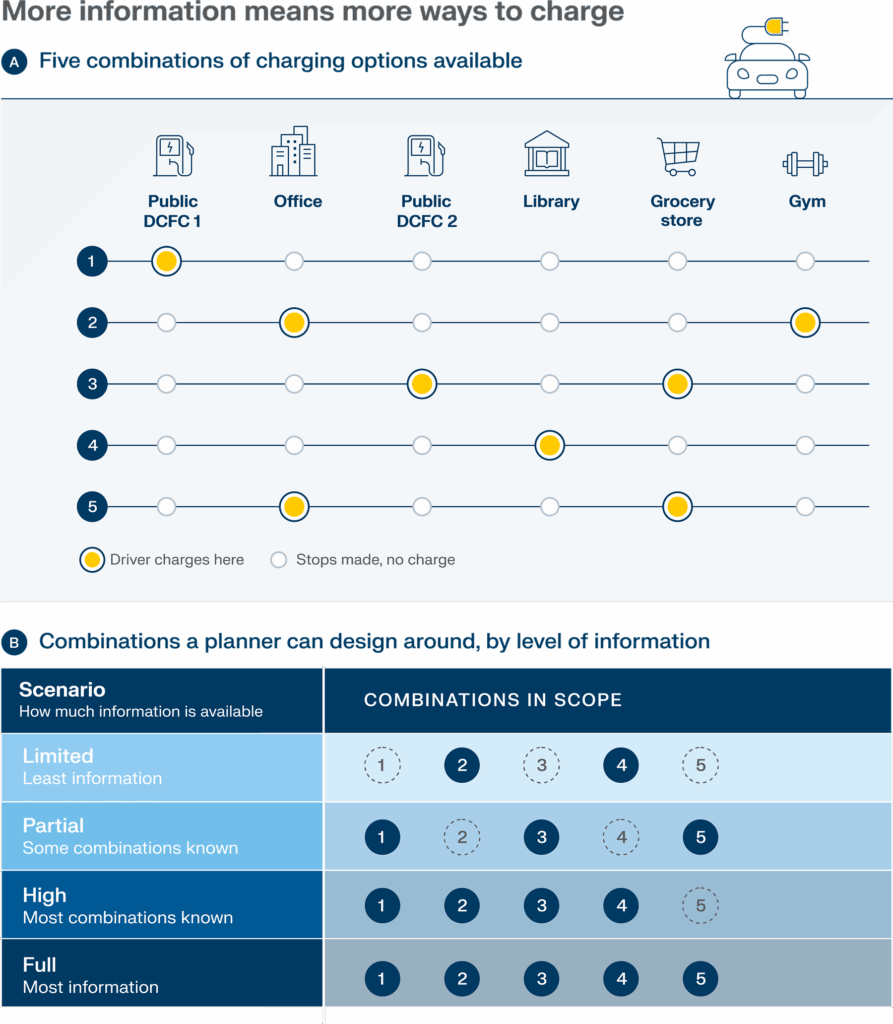
We used the total number of combinations of potential public charging opportunities for each driver as a proxy for how accurately the network can be built to drivers’ needs. For example, a driver who makes six stops of varying lengths at work, businesses, and other public places throughout the day would have many potential combinations of when and where to charge (Exhibit 1).
To explore the value of coordination and assess the impact of more information on the network’s cost, our model produces charging networks based on varying levels of information available about these combinations, with a constant focus on minimizing costs. The paired tables below illustrate our approach. The first shows five different combinations of charging opportunities available to an illustrative EV driver over the course of a day. The second shows how different levels of information allow planners to consider different subsets of these combinations when designing the charging network.
Exhibit 1
We considered four distinct regional geographies to present our results: Charlottesville, Virginia; the Buffalo–Rochester region in New York; Pittsburgh, Pennsylvania; and greater Salt Lake City, Utah. These geographies differ in population density, built environment, and driving distances, allowing us to test whether the same patterns persist across different travel contexts.
More Information Leads to Greater Cost Efficiency
The results show a consistent relationship between better information about drivers’ charging flexibility and lower network costs. With limited information, planners build more chargers that are used less frequently, while knowledge of even a few additional charging alternatives per driver enables greater sharing, higher utilization, and substantially narrows the cost gap with the hypothetical, fully informed network.
The exhibit below compares the estimated charger capital cost of building a charging network to meet anticipated demand in 2030 in Charlottesville, by scenario (level of information availability). Costs are broken down between home charging (encompassing both single-family and multifamily homes) and public charging locations. As planners gain more information about driving patterns and charging flexibility, they can design networks that meet demand at lower overall cost. The “full including home charging” scenario illustrates an idealized, if unrealistic, lower-bound cost where drivers are assumed to forgo home charging to improve system-wide efficiency. This flexibility produces the lowest total capital cost even though costs for public charging are the second highest of the five scenarios modeled. Greater investment in highly utilized, shared public charging infrastructure would reduce the need for a much larger number of private home chargers. While asking residents to forgo the convenience of home charging is not a realistic approach (and would undermine one of the most compelling attributes of driving an EV), it is interesting to see the magnitude of network cost savings this would represent.
Exhibit 2
Moving beyond Charlottesville highlights the way additional information reduces system cost in diverse regions of the United States. First, deployment of the limited information network is 30%–80% more expensive than that of the full information network. Second, even a moderate increase in information between the limited and partial information approaches consistently results in a substantial decrease in costs for the public network (14%–25%). Third, the resulting reduction is largest in lower-density Salt Lake City and becomes progressively smaller as regional population density increases. One possible explanation is that denser regions concentrate travel around a more overlapping set of destinations, allowing the identification of charger-sharing opportunities even with relatively limited information.
Exhibit 3
The falling cost of the overall system is driven by an increase in daily charger usage across geographies as more information becomes available to planners. This appears especially valuable for right-sizing expensive DCFCs because it allows planners to avoid spreading demand across lightly used DCFCs. In the full information network, DCFCs get about 40%–78% more daily visits than in the limited information network, whereas Level 2 chargers receive about 13%–24% more visits.
Exhibit 4
Recommendations
As the EV market grows, there is clear value in focusing on better coordination of charging network development to lower costs and help support more affordable electric transportation options. While the fully optimized network modeled in our analysis (labeled “Full” in the exhibits above) may be unrealistic, several clear recommendations can be drawn from the results.
Deployment: Determine the total charging needs in a region, and coordinate entities to build toward those needs.
Private developers are the backbone of public charging in the United States. However, additional coordination and orchestration by public-sector entities — such as local and regional planning agencies — can help right-size the overall network and direct collective efforts to the highest-value deployments. Information on where drivers stop, how long they stay, and which charging locations they are willing to use can reveal flexibility that aggregate demand estimates miss.
Where detailed mobility data is unavailable, public agencies and data providers can support planners with more accessible proxies such as charging-session records, site-level utilization, dwell-time distributions, traffic volumes, land-use data, and surveys of charging preferences. Even these simpler datasets can help identify where demand can shift, where charger sharing is most feasible, and where incentives or new infrastructure would provide the greatest value as EV adoption rises.
- Local planners can take advantage of programs such as Charging Smart, which offers free technical assistance to help local governments adopt policies, practices, and incentives for enabling efficient EV charger expansion.
- Planners, developers, and other stakeholders can leverage tools such as GridUp to better understand total charging needs in their area over time and incorporate this information into their planning efforts and funding solicitations.
- Mobility data providers, electric utilities, charging-network operators, and other stakeholders can make travel, grid-capacity, charging-behavior, and related data more accessible to planners to support coordination efforts.
Operation: Increase utilization of chargers to lower total network costs.
EV charging planners and developers can only achieve a smaller, less expensive charging network that still meets drivers’ needs if they work to increase the utilization of the chargers deployed. Different stakeholders can encourage this outcome in different ways:
- Charging providers can use time-varying pricing and other targeted discounts to change incentives for when charging takes place. Utilities can support the grid-side benefits of this temporal flexibility by offering rates that align with the costs of providing electric power at different times of day.
- Employers can offer discounted or complimentary workplace charging as a perk to incentivize EV drivers to use shared infrastructure. Depending on companies’ typical working hours, this often aligns with off-peak hours and supports better overall grid utilization.
- Charging providers also have the opportunity to dynamically adjust prices between stations and across different times of day to encourage better usage of infrastructure that would otherwise remain underutilized.
The Opportunity Is Large
We’re going to need a lot more charging infrastructure to support EVs as the market grows with time. While individual charging locations are typically planned independently by different network operators, site hosts, or public agencies, more deliberate coordination among these stakeholders could help align infrastructure decisions and reduce overall costs. Of course, the network will never be perfectly optimized, and having some excess capacity is arguably valuable for creating backstop redundancy and enhancing consumer choice. However, understanding the significant cost savings potential presented by increased coordination sheds light on the value of collaboration. We have much of the data we need to plan efficient infrastructure — let’s use it to enable more people to drive electric at lower cost.
AI was used for text editing and generating Exhibit 1. AI coding tools were also used to create scripts to generate the results.
Authors

Hamidreza Zoraghein
Senior Data Scientist
Kirill Tchernyshyov
Senior Data Scientist
Ben Shapiro
Principal
Nick Pesta
ManagerRelated Insights



Help build the clean energy future. Donate today.
Independent research. Real-world solutions. Supported by donors.
RMI can pursue the highest-impact climate and energy solutions because we’re supported by people who believe change is possible. Every gift helps advance the work needed to make clean energy the default choice worldwide.
For other ways to give to RMI, including checks or gifts of stock, please visit Other Ways to Give.